What is long term? That’s a question with many answers depending on your point of view. Some people might think a year is long term. I had a client tell me once that he was so old he didn’t buy green bananas because he might not be around to eat them. Some might say 3 years is long term but markets can and have gone through many 3 year periods of poor returns. Even 5 years is no guarantee of reasonable returns if you are talking about the standard 60/40, stock/bond portfolio.
Right now the two-year total return of a 60/40 portfolio (60% S&P 500, 40% aggregate bond) is -1.24%. In market terms, that isn’t a long time but that doesn’t change the fact that many people have made no progress on their financial goals over that time frame. If you’re working and saving, it has been an opportunity to accumulate new investments at better prices but for those already retired, with no continuing income and savings, it has been a frustrating time.
That lack of return is not confined to the large-cap stock/bond portfolio either. If you expand the 60/40 to a Vanguard Total Stock/Vanguard Total Bond mix, you actually did even worse at -3.7%. Even a portfolio diversified across multiple asset classes, like ours, has a slightly negative return. Diversification has been called the only free lunch in economics but over the last two years, it has cost investors money.
With such a poor two-year track record, the temptation is to abandon your previous approach and shift to something new with a steadier return. Why take this extra risk if I’m not being rewarded? The most popular alternative right now is TBills because short-term interest rates have risen to levels that seem attractive today. 1, 3, and 6-month TBills all yield over 5% and, despite the angst of the debt ceiling drama, are highly likely to be redeemed as scheduled. Given the volatility of the last two years that is very, very tempting. But should you give up on your portfolio now to achieve some short-term relief from market anxiety?
History says no. TBills have, over the long term, produced a barely positive average real return of just 0.3% (1928-2022, adjusted for inflation; NYU Stern market data). You are not going to reach your financial goals with that low real return. The real return of the S&P 500 over that same time is 8.3% so the difference is not small. 10-year Treasuries, Corporate bonds, Real estate, and gold have all historically produced higher average real returns than TBills. And that is true across almost all long-term (over 5 years) time frames.
Diversifying across multiple asset classes has usually been the best choice for long-term investors. Including gold, commodities, real estate, and non-US stocks in your portfolio provides diversification benefits you can’t get from just US stocks and bonds. Asset correlations are not stable and US bonds and stocks have been positively correlated many times throughout history, last year being only the most recent example. Including other asset classes raises the odds that you’ll have something zigging when everything else is zagging.
In the last major inflation cycle – the 1970s – a diversified, multi-asset portfolio outperformed the US-based 60/40 by a wide margin. Looking at returns by decade there are periods when the 60/40 performs very well and you could have just ignored everything else. And there are extended periods where the diversified approach was obviously superior. And over the very long term, the diversified portfolio produces almost exactly the same return as the 60/40 with 20% less volatility.
| Portfolio | 1972-1979 | 1980-1989 | 1990-1999 | 2000-2009 | 2010-2019 | 1972-2019 |
| Multiple Asset Class | 10.3% | 14.6% | 9.3% | 5.9% | 6.5% | 9.2% |
| Standard Deviation | 8.3% | 8.6% | 7.2% | 10.8% | 6.9% | 8.7% |
| US 60/40 | 5.2% | 15.2% | 14.0% | 2.9% | 9.6% | 9.5% |
| Standard Deviation | 13.8% | 9.8% | 10.6% | 10.6% | 6.9% | 11.1% |
*The multiple asset class portfolio consists of International stocks, US stocks, REITs, TBills, Intermediate Treasuries, Long term Treasuries, Gold and commodities. No asset has a higher allocation than 20%. Gold and commodity allocations are less than 10% each. The US 60/40 consists of the S&P 500 and Intermediate Treasuries. Data is from Robert Shiller, Vanguard funds (where available), NYU Stern data set and S&P. Portfolio data is constrained by REIT returns which are only available starting in 1972. Returns are annualized.
There have been long periods in the past of poor returns from all kinds of portfolios. The 60/40 portfolio produced a total return of less than 2% from 1970 to 1974 while a more diversified, global approach produced double-digit returns (does not include REITs). The diversified approach hasn’t always produced such high returns during US bear markets though. The 2000-2002 bear market saw the diversified approach produce a barely positive 0.3% return. But the US 60/40 lost 3.9% over that time so the diversified approach was still superior.
Another thing to note is that the returns of the diversified portfolio and the 60/40 portfolio are not highly correlated (about 0.65 using the decade returns above). Using these two approaches together should provide some diversification benefit. Since we can’t know which will outperform over any given time period in advance, it might make sense to use both. It certainly makes sense for a goals-based investor who uses different risk tolerances for different goals. A more aspirational goal might use the US 60/40 (or something more aggressive) while longer-term goals might take a conservative route with the more diversified portfolio.
It is at times like this, after a period of poor returns, that investors start to get antsy, thinking they need to do something drastic with their portfolio. I think that’s the wrong approach though. An investor’s portfolio can consist of more than one strategy and thus produce a tactical result. If your options are cash (TBills), the US 60/40 portfolio, and the multiple asset class portfolio, you might have your money divided among the three approaches.
| Tbills | 20% |
| US 60/40 | 30% |
| Multiple Asset Class | 50% |
| 100% |
How you allocate your assets between those three options is likely going to reflect your feelings about the future. The pessimist will choose TBills and the optimist will choose the 60/40 (or something even more aggressive). The person who just assumes the future is unknowable will choose the Multiple Asset Class portfolio. In the real world, we combine these. You might put most of your assets in the Multiple Asset Class portfolio but reserve some for the bad outcome (TBills) or the possible good outcome (60/40). How you split that up will tell you a lot about yourself.
Environment
The dollar finally found some traction last week, as I’ve been expecting, but the rally so far is pretty feeble. The driver going forward is likely to be relative growth expectations. With the US and the rest of the world all slowing at once – and that is what it looks like right now – it will really be about rates of change. We may be returning to a period when the US is the best of the worst – although the political class seems determined to make it a close call. If the US is performing better than the rest of the world, that is likely to prove positive for the dollar. The short-term trend of the dollar is very near a reversal but it’s not quite there yet.
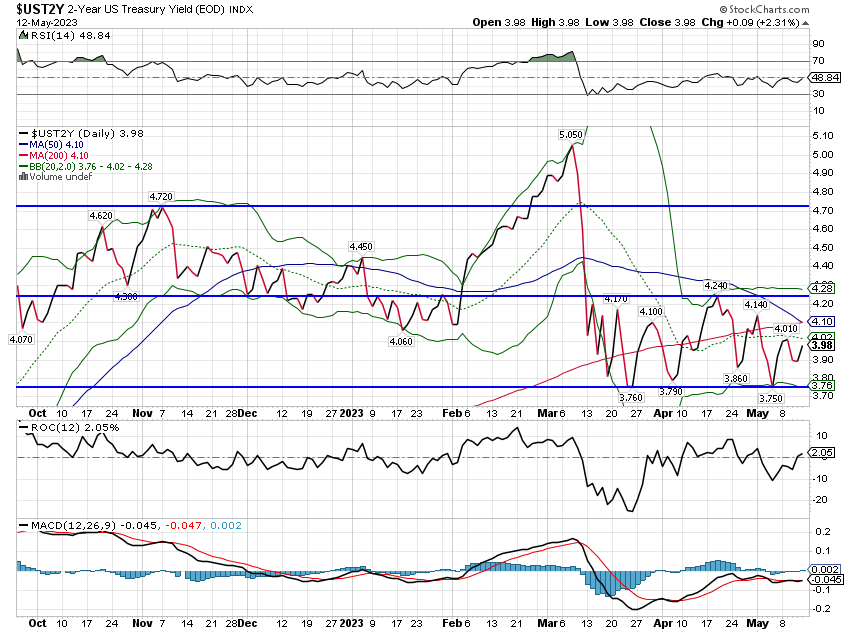
Rates were also higher on the week but there really hasn’t been much movement all year with the 10-year trading in a 70 basis point range. Rates are down on the year but over the last year, intermediate-term Treasuries (3-10 years) are essentially unchanged (total return 0.3% year-over-year). The short-term trend for the 10-year yield is still down. The 2-year Treasury yield continues neutral as it has been for some time. Short-term rates (TBills) are still in an uptrend but they haven’t risen much in the last couple of months. The whole rate complex may be making a top.
Markets
All the major asset classes were down last week but the losses were fairly mild. Year to date, gains have been confined to quite narrow parts of the market. Growth stocks are up but the gains are concentrated mostly in the very large tech/communications stocks. Mid and small-cap growth are up too but a lot less. Value stocks are down on the year but the uptrend versus growth that started in January of 2022 is still intact – for now.
Japan and Latin America were up last week but non-US stocks were down as a whole.
Sectors
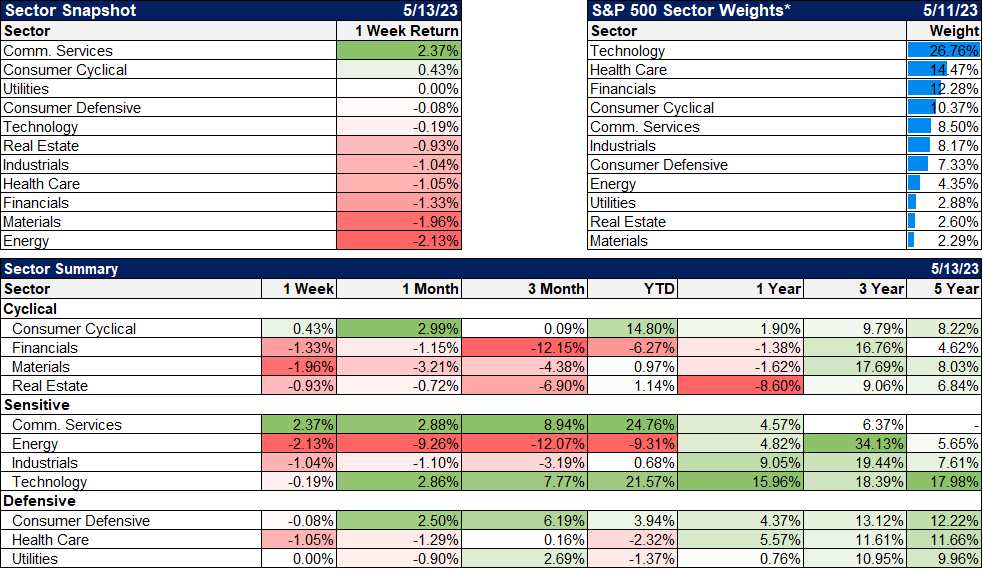
Communication services returned to the top spot, primarily due to news from Google on AI. I don’t know how significant the update was for Google’s bottom line but AI is the market’s new shiny object so it moved the stock up 11.3% on the week.
Energy and materials were the worst performers as commodity prices were down on the week. Crude oil was the main culprit for the index but copper was down nearly 4% too. Natural gas caught a bid though as reports showed the industry is responding to lower prices by cutting back on drilling of new wells in a big way.
Market Indicators/Economic Data
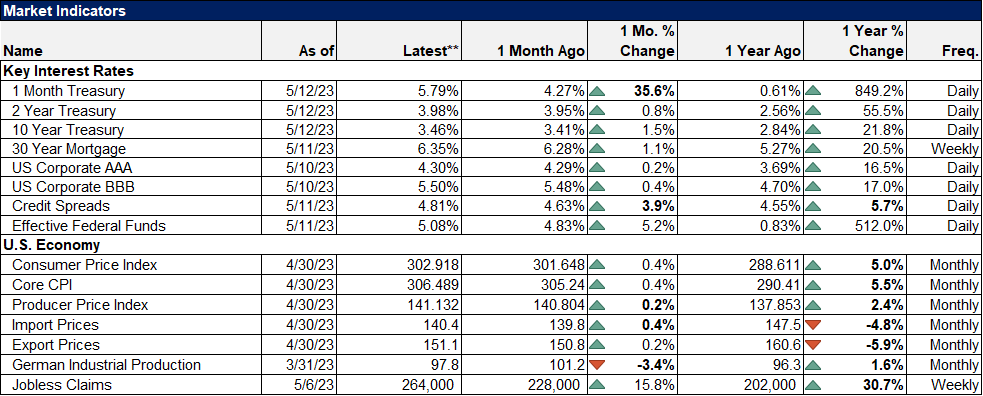
The debt ceiling standoff is affecting the rate on short-term Treasuries, specifically the 1-month TBill where the yield has risen nearly 36% in just the last month. The 3-month bill rate is up over that time frame too but only by a little over 3%. The logical conclusion is that the market believes there will be some problems at the deadline (which the market puts somewhere in the next 1-2 months) but they will be resolved by the time the 3-month TBill comes due.
So, the market believes that getting paid on that 1-month bill is a bit dicey but 3 months is fine. Okay, sure. I’ll just repeat what I’ve said before which is that I have no doubt at all that all Tbills will be paid on time. The Treasury has a prioritization procedure and paying existing debt is right at the top. If they do actually push this past the brink, you may well see some form of government shutdown, including furloughs of some Federal employees. That happened in the mid-90s standoff between Gingrich and Clinton.
Credit spreads continue to creep wider but are still below the long-term average. That isn’t good news and has to be watched closely. If we get a real credit crunch this is where it will show up first.
Last week’s economic reports were dominated by inflation data at the consumer and producer levels. Headline CPI continues to moderate but core is coming down a lot slower. That will concern the Fed. Producer prices are coming down a lot faster so for now I’d discount all the worries about corporate profit margins. Import and export prices are now down year-over-year and not by an inconsiderable amount. These prices are very volatile though so I don’t think we should extrapolate to domestic prices.
I also included German industrial production for March which was down considerably month-to-month. The European economy appears to be slowing but this data is from March so it’s a little dated. With the US and the rest of the world slowing the key for investors will be about rates of change, who is getting worse faster. If Europe slows faster than the US – and that seems a toss-up at this point – I’d expect the dollar to react positively versus the Euro.
Patience is, by far, the most difficult part of being an investor. Extended periods of low returns happen regularly and it is always tempting to try to shift to that one thing that’s working today. But momentum, in markets or investment strategies, is not eternal. You could easily swap from something that is about to work to something that is about to go out of style. That’s why choosing a strategy – or more likely, strategies – is so important. You have to be able to ride out the downtimes.
The old saying to not miss the forest for the trees is never as true as it is in managing your assets. It is easy to get distracted by some piece of your portfolio that isn’t performing well, when you should be concentrating on the whole. Rather than trying to choose specific investments, think about choosing entire portfolios, entire strategies that will perform well in the environment you expect. If you think there is a high probability that the dollar will fall in the future, you can construct a strategy with a high probability of success if that happens.
But unless you are 100% sure the dollar will fall – which you can’t be – you can’t put all your eggs in that one bucket. There is some probability that you will be wrong. In fact, your odds of success in choosing the future direction of the dollar over some time frame are probably less than 50/50. More information, more data – which we have by the bucket loads today – does not improve your ability to predict the future. In fact, considering that so much of what is produced as economic/market content today is dis or misinformation, I’d venture to say that a “well-informed” investor is actually at a major disadvantage. You’d be better off just flipping a coin.
The way to flip a coin in investing is to invest equally in both outcomes, have a rising dollar strategy and a falling dollar strategy. If you want to make a tactical call, make the split between the two something other than 50/50 but never go to 100/0. Most investors tend to think in all-or-nothing terms, in or out, but that doesn’t take into account our fallibility. Humility reduces risk.
Joe Calhoun


Stay In Touch