
Clearly, sustained low inflation implies less uncertainty about the future, and lower risk premiums imply higher prices of stocks and other earning assets. We can see that in the inverse relationship exhibited by price/earnings ratios and the rate of inflation in the past. But how do we know when irrational exuberance has unduly escalated asset values, which then become subject to unexpected and prolonged contractions as they have in Japan over the past decade?
– Alan Greenspan, The Challenge of Central Banking in a Democratic Society, 1996-12-05
It was very difficult to definitively identify a bubble until after the fact—that is, when its bursting confirmed its existence.
– Alan Greenspan, Economic Volatility, Jackson Hole, 2002
The S&P 500 is up 16.75% since bottoming on March 30th. That is despite the Iran War and the closing of the strait of Hormuz that the consensus believes should have been a big negative for stocks. That fact, that stocks are rallying despite something so obviously negative, is cited repeatedly as evidence that the stock market is in a bubble, experiencing irrational exuberance or just plain nuts. It does seem extreme but markets often act in ways contrary to the consensus. What is unprecedented is to see a move this big, this fast, in the context of an ongoing bull market. All the other big moves like this in recent times (since 1990) were either bear market rallies or crash recoveries. There was the 18% move up in November/December of 2008, which turned out to be a head fake; the market went on to make further new lows. And there was the 25% move in April/May of 2020 when we were coming out of the COVID hole. This current moonshot, though, came after a correction that didn’t even reach a 10% loss.
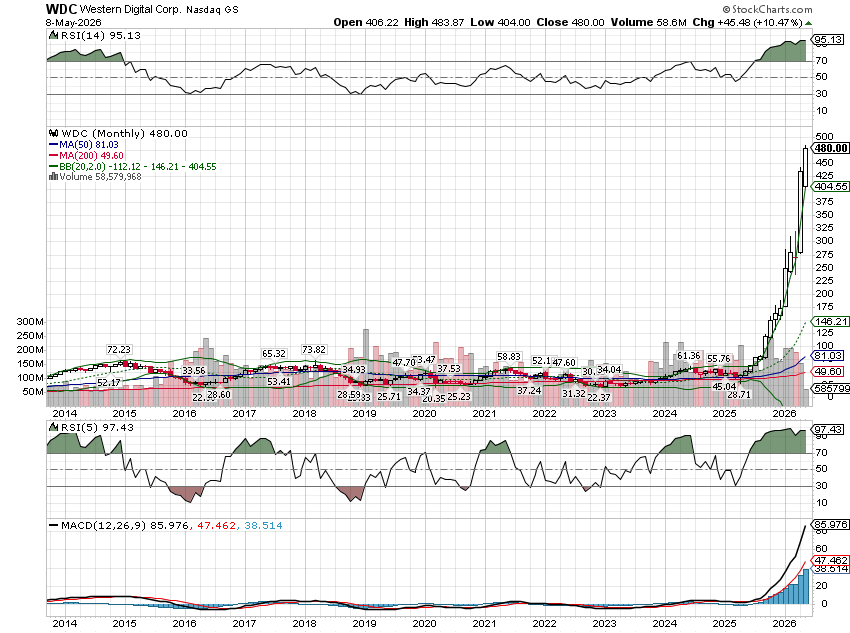
The S&P has actually been the laggard in this AI frenzy. The Magnificent Seven stocks most closely associated with AI, and the NASDAQ Composite as a whole, are both up 26% over the same time frame. Even more incredible are some of the non-Mag 7 AI stocks: Sandisk 173%, AMD 132%, Micron 132%, Western Digital 91%; the semiconductor index overall is up 65%. But does a big move in a short period of time (only 40 days) equal a bubble? Probably not but this bull market isn’t new; this is just the latest – and largest – surge. If you look at the last year, Sandisk is up an astounding 4000% (no I didn’t miscount the zeros) and there are 6 stocks in the S&P 500 up over 500% in the last year, all of them related to AI. If we look at the last 3 years, the list of 1000% gainers expands, with 10 stocks in the S&P rising at least that much; eight of them are AI-related. Is that evidence of a bubble?
What about valuations? Surely if this is a bubble, these stocks must be ridiculously priced, right? There are plenty who will tell you that this rally, unlike the dot com era boom, is supported by earnings – and in general they are right. It is true that the forward P/E (based on analysts estimates) is “only” about 21 times, which is above the recent average but not outrageously so; the 5-year average is 19.9% and the 10-year average is 18.9, although the average since 1990 is 16.5. If we look at some of the Mag 7, their forward earnings multiples don’t seem that challenging, although price/sales ratios often tell a different story:
| Ticker | P/E | P/S |
| NVDA | 26 | 24 |
| GOOGL | 28 | 11.5 |
| MSFT | 21.5 | 10 |
| META | 20 | 7 |
Some of the semiconductor stocks do look expensive though; remember the semiconductor business is highly cyclical: AVGO P/E 38, P/S 30, AMAT P/E 39, P/S 12, LRCX P/E 38, P/S 17, KLAC P/E 34, P/S 17.
| Ticker | P/E | P/S |
| AVGO | 38 | 30 |
| AMAT | 39 | 12 |
| LRCX | 38 | 17 |
| KLAC | 34 | 17 |
A bit of a mixed picture for a “bubble”, isn’t it?
Three Valuation Metrics That Ought To Give Investors Pause
The Buffett Indicator
The Buffett indicator is the market cap of all US stocks as a % of GDP and it has recently reached an all-time high of 230%, a level (over 200%) where Warren Buffett famously said you were “playing with fire”. That probably explains Berkshire Hathaway’s cash pile of nearly $400 billion which is roughly 30% of the company’s total assets. That, by the way, is roughly double the long-term average for the company. Not only is the indicator at an all-time high but it is also about 40% above the dot com era (159%). BTW, the previous all-time high was set in 2021, right before the bear market of 2022.
S&P 500 Dividend Yield
The dividend yield of the S&P 500, at 1.07%, is at an all-time low, despite continued dividend growth. Dividends grew by 6.5% last year which is a little below the long-term average of 7.4% but still quite respectable. But, obviously, stock prices have risen much faster and the dividend yield has fallen. Of more importance, I think, is the state of stock buybacks, which are often cited as mitigating the low dividend yield. Amazon (halted). Meta (reduced 90%), Alphabet (-50%), Microsoft (-35%), Tesla (halted), Oracle (halted), Salesforce (slowed but did a big buyback last year when the stock was higher), Adobe (reduced but no official announcement) and AMD (reduced) have all reduced or eliminated their stock buyback programs. And no wonder when you look at their capex, most of which is on some aspect of AI. Just to take Alphabet as an example, their free cash flow in Q1 was just $10 billion, which sounds like a lot, but is down 60% from the year before. On a TTM basis their capex spending has risen from an average of $26 billion from 2019 to 2023 to $110 billion in the latest quarter.
Shiller P/E (CAPE)
The Shiller P/E is not at an all-time high but it isn’t far from it at 42.1 while the all-time high of 44.2 was set in December of 1999. The historical average is 17.7. The Shiller P/E divides the current price of the index by the inflation-adjusted 10-year average of index earnings. Of all the valuation metrics, I think this one actually gives you the best indication that things are not exactly kosher right now*. Why? Well, it takes time to really build expectations so high that we end up calling it a bubble. The dot com boom started around 1995 and it wasn’t obvious that the hype was hype until at least 2000, although I will admit to being flabbergasted well before that. The indicator hit a below average 13 in the wake of the 2008 financial crisis but it didn’t stay there long; it broke above the long-term average in late 2009 and hasn’t traded below it since.
The Shiller P/E has been at least 25% above the long-term average since 2013. It traded 50% above the average in 2015, 75% above in 2017, double the average in 2021 and today stands at 138% above the long-term mean. Along the way, we’ve seen multiple examples of bubble-like behavior: 3D printing stocks in 2013, the first bitcoin surge from around $900 to $20k, the second bitcoin surge that took it to $64k, the third bitcoin surge that took it to $126k, the NFT boom for bad art (Bored Ape Yacht Club and many others), the ICO boom and all the companies who goosed their stock by adding “blockchain” or “AI” to their name, the FANG stocks from 2015-2018, the pot stock craze in 2018, the SPAC craze of 2021 that introduced us to the SPAC King, Chamath Palihapitiya, who once compared himself to Warren Buffett, zero days to expiration options (which Buffett recently called “just gambling”), options volume exceeding stock market volume, Cathie Wood and her ARK funds, and, finally, the existence of roughly 1700 “unicorns” who are starting to line up at the IPO window. Did I miss anything?
Is this evidence of a bubble? Or many serial bubbles? Why does this keep happening? Why have we seen so many speculative episodes over the last 15 years? Why is gambling pervasive throughout our society? I’ve seen many explanations, many citing some form of inequality as the culprit or the lack of opportunity for younger generations, some kind of active financial nihilism. It does seem as if we’re living in some kind of 21st century remake of the Gilded Age and there is certainly an element of envy at work here. But I prefer Occam over Nietzsche. Speculative periods throughout history are about one thing – money. People don’t waste millions of dollars on digital tchotchkes with no intrinsic value when money is dear. They don’t hand billions of dollars to a fund manager who manages to perform worse than their benchmark with higher volatility unless money is cheap. They don’t buy stocks just because they added “blockchain” or “AI” to their company name. In short, when money is not overly abundant, people don’t do stupid things with it.
The three biggest episodes of market overexuberance in my adult life were Japan in the late 80s, the US dot com boom and, possibly, today. There is one common denominator for these three episodes – a rising currency. From early 1985 (when the Plaza Accord to weaken the dollar started to get priced in) to the end of 1988, the Yen rose from 38 to 82 against the dollar. That rapid influx of capital drove the Nikkei up from 12,000 to 39,000 and blew a real estate bubble to match. From the summer of 1995 and Netscape’s IPO, the US Dollar index rose from 82 to nearly 120 by the time the dot com mania peaked in 2000. And in this most recent period, the dollar index rose from 73 in 2011 to a peak of nearly 115 in 2022 and today’s 98. Over the last 15 years the narrative has changed from “the cleanest dirty shirt in the world” to “American exceptionalism” but the money has come, from all over the world, regardless of what we call it.
The consensus today is that the outcome of this latest speculative time will be determined by how AI performs, how it changes our economy, for better or worse. My opinion, for what’s it’s worth, is that AI will be a useful tool but, like most technological changes, will take time for us to figure out how best to use it. Companies that today are firing people and blaming it on AI are more likely just finding a convenient scapegoat to do things they were going to do anyway. And for the companies that are true believers and have reduced headcount because they thought they didn’t need real people, many of them are discovering that this technology doesn’t work the way they thought it did. But I could be wrong. Maybe AI really will usher in an age of incredible productivity and economic growth. It hasn’t happened yet but it could, right?
What should investors do? Well, if you believe the payoff from AI is still yet to come, I guess you do nothing. If you own one of the major market indexes, you are sitting on a big bet on AI already so you don’t have to do anything. But if you have any doubts, it might not be a bad time to start reducing your bets. That doesn’t mean go out and sell all your stocks – blind optimists are a lot like blind squirrels. It just means you need to think sell before buy. Check your asset allocation; if you’re invested in stocks, rebalancing will likely involve selling some. Maybe hold more cash then you normally would. You might consider some inflation protection. And if you own a stock whose chart looks like this, you might just think about how you’d feel if it comes down as fast as it went up.
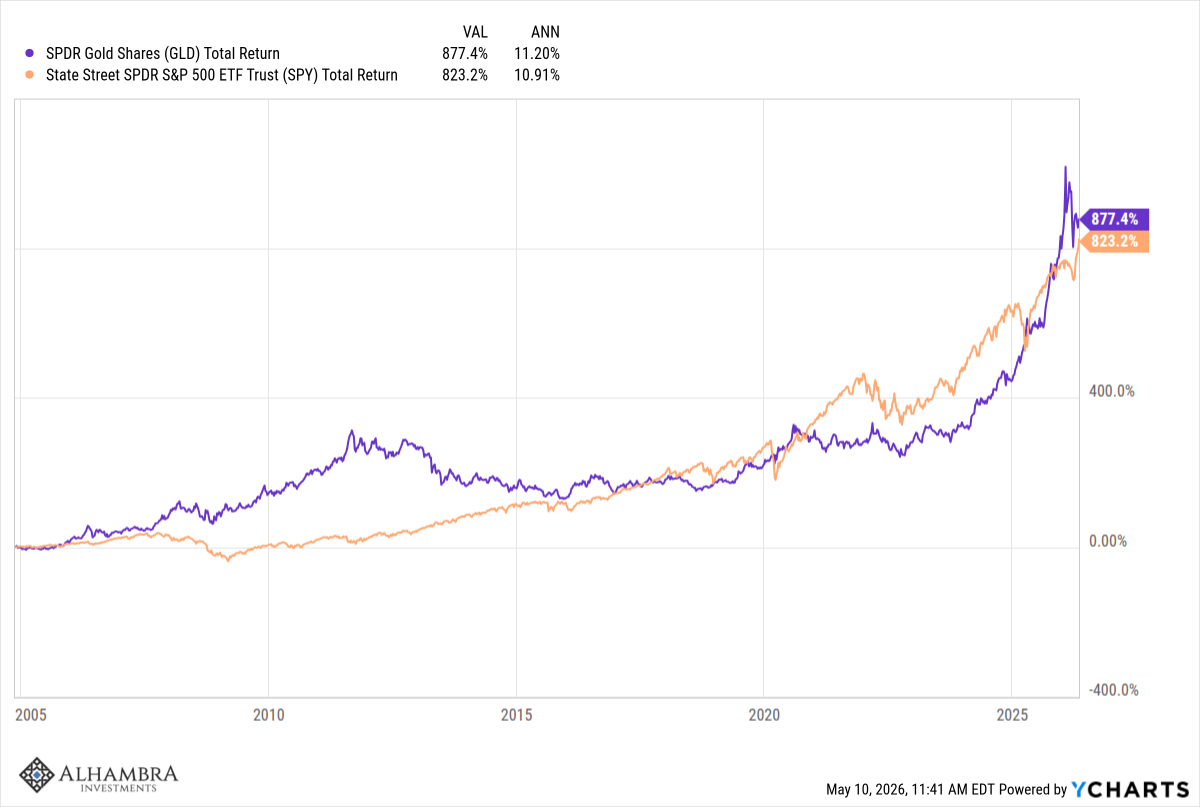
For the bulls out there who think this is all about fundamentals, that all these tech moguls know what they’re doing spending all their free cash flow on the AI buildout, I would suggest pondering this for a while. Since the beginning of 2016, the annual return from gold is almost exactly the same as the S&P 500. Ask yourself, if the run in stocks over that ten years is about technological change – bitcoin, AI – why haven’t stocks done better than an inert metal with few practical uses? If that still doesn’t convince you, consider that gold has outperformed stocks over the last 25 years. This is not a short-term phenomenon.
Here’s one more thing to ponder. Read that quote from Greenspan at the beginning. Everyone who reads it focuses on “how do we know when irrational exuberance has unduly escalated asset values” but the important information is found in this part:
Clearly, sustained low inflation implies less uncertainty about the future, and lower risk premiums imply higher prices of stocks and other earning assets. We can see that in the inverse relationship exhibited by price/earnings ratios and the rate of inflation in the past.
Everyone on Wall Street will tell you that you need to own stocks because they beat inflation over the long term. What they don’t tell you is that the outperformance comes during the periods when inflation is quiescent. In the high inflation 70s, the nominal return of the S&P 500 was 5.9%/year but the real return was -1.2%/year; stocks did not beat inflation. And for those of you who keep pointing to earnings as a reason for stocks to keep rising, you should know that S&P 500 earnings grew 12.3% annually in the 70s. The contrast with the 80s is instructive. Earnings growth was worse than the 70s (6.5% annually) but the real return from stocks was 11.8%. Inflation – and interest rates – matter. A lot.
Are we in a bubble? I don’t know but I know stocks in the US are expensive. Very expensive. And I know that valuations like this have never been sustained for very long in the past. And I know that subsequent returns from high valuations – that were cheaper than today’s – were pretty abysmal. And I know that we are overrun today with charlatans, insider traders, scam artists, and grifters. And I know that most people don’t care about any of those things. And I know many people who read this will dismiss it because over the last 15 years anyone who doubted this bull market ended up looking like a fool. But I know this bull run will end as all the ones before it have and given today’s valuations – which are a bad timing tool but a great measure of risk – it probably won’t be a gradual, smooth decline. Invest accordingly.
Joe Calhoun
*I don’t like the term bubble because, as Greenspan said, you can’t know if current valuations are justified until the future arrives. If they aren’t – expectations are too high – we get a crash and call it a bubble. If we don’t, we get a boom and call it progress.
Stay In Touch