As we enter the final quarter of 2024, there are a lot of questions facing investors. There are, of course, always a lot of questions because investors are always dealing with the future, but today’s environment does seems to have more than usual. Some of these questions concern short-term considerations and while they are important, it is more important to remain focused on the long-term trends. Here’s what I’m thinking about lately:
- Let’s get the one everyone is thinking about out of the way first – the election. I have no idea who will win and I don’t think anyone else does either. But assuming neither party manages a sweep of the House, Senate, and White House, economic policy probably remains pretty much status quo. There will be minor changes, probably in the direction of the party that wins the Presidency, but the changes will be incremental. That’s what history says anyway and I don’t think this one will be any different. That might be less true if Trump is elected because tariffs are the one thing a President can do pretty much on his own, at least for a while, as he proved in his last term. I have been thinking about how the market might react the day after the election and I’m beginning to think the short-term response may be negative no matter who wins. I believe that some of the current rally is based on the institutional memory of Trump’s 2016 win. The consensus going into that election was that Trump was unlikely to win but if he did, it would be negative for the market due to his protectionist streak. When he won, investors chose to focus on his proposed tax cuts and the market rallied instead. Now, I suspect there has been some buying in anticipation of a Trump win based on that experience. So, if Trump wins, it will have already been anticipated and the market may see some profit taking. If Harris wins, whoever bought, expecting a Trump win, will likely sell. If the market continues to rally into the election I might be inclined to seek a short-term hedge.
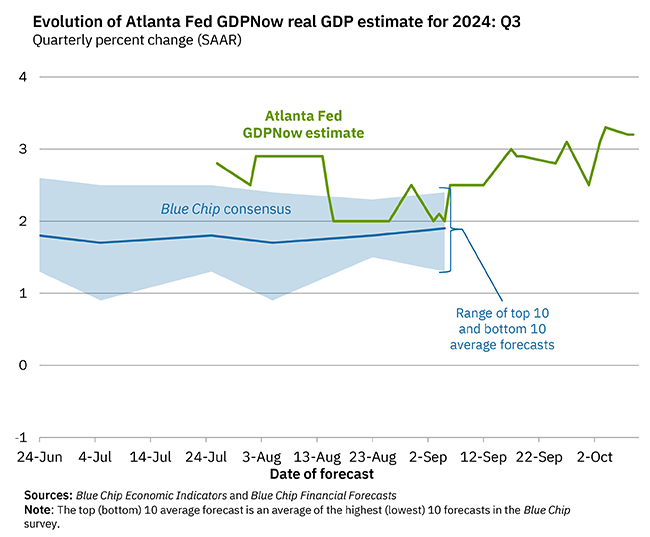
- Will the economy continue to grow at 3%? Since the beginning of 2022, the average year-over-year change in real GDP has averaged 2.8% which is great but probably not the most important data point for investors. Nominal GDP (Real GDP + inflation) is more important because it captures more information. The average year-over-year change in NGDP is 7.7% since the beginning of 2022, 6.2% since the beginning of 2023 and 5.7% in Q2 2024. That declining rate of change reflects a decline in the inflation rate with pretty steady real growth and stocks have obviously liked that disinflationary environment. Will it continue? Well, it certainly looks like it will through Q3 but Q4 may see a slowdown in the real growth part of the equation. We’ve already seen a rise in jobless claims due to Hurricane Helene and I expect another rise this week after Milton. Past hurricane effects have lasted about 6 months before returning to the previous trend. But these come at a tricky time as the Fed has just started an easing cycle. Could the slowing due to the hurricanes push the Fed into a more aggressive rate cutting mode? Or will they blame any slowing on the hurricanes and assume it will be temporary? If they do, what if they’re wrong and the slowing is from some other source? Could they unintentionally fall behind the curve? What if we get the temporary job losses from the hurricanes but real growth doesn’t slow appreciably? How will the long-term rates react to a slowing induced by hurricanes? Will long-term rates fall as they would if the slowing was from something else? If they do, will that create more activity in the housing market and short circuit any slowdown? There are a lot of possibilities for the economy right now which translates into lots of opportunities for the Fed to make a mistake.
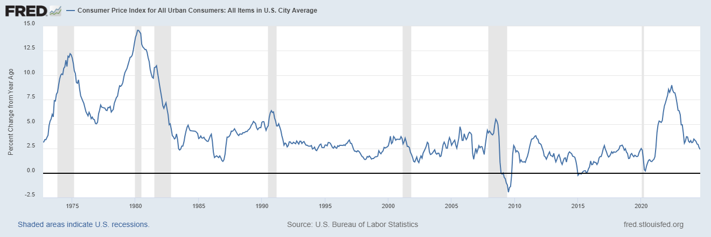
- Is the Fed in the process of making a mistake right now? I have often thought that this period could be similar to the mid 1960s to early 1970s when inflation last got out of control. During this period, the Fed would hike rates to tamp down inflation and then cut rates to head off weaker growth. Sound familiar? Back then, as soon as growth returned, so did inflation. Will that happen again? Today, inflation is continuing to fall and is now at the average since 1992 (2.6%). If they are targeting an average inflation rate of 2%, doesn’t that imply some periods where inflation is below the target? With the inflation rate still well above target, why are they cutting now? Will it prove too soon and reignite inflation?
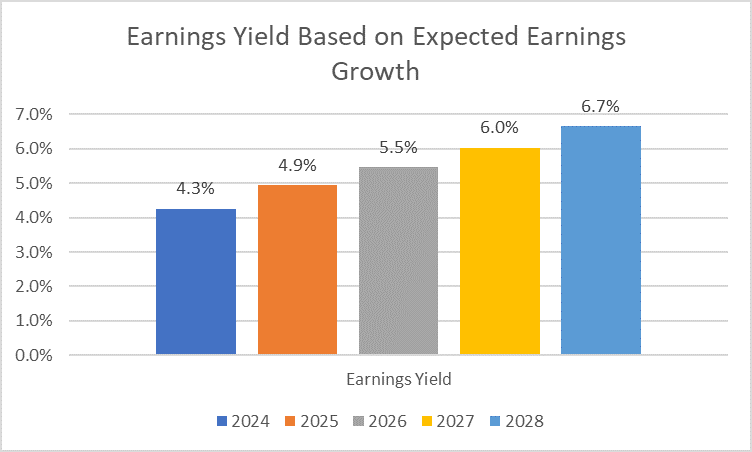
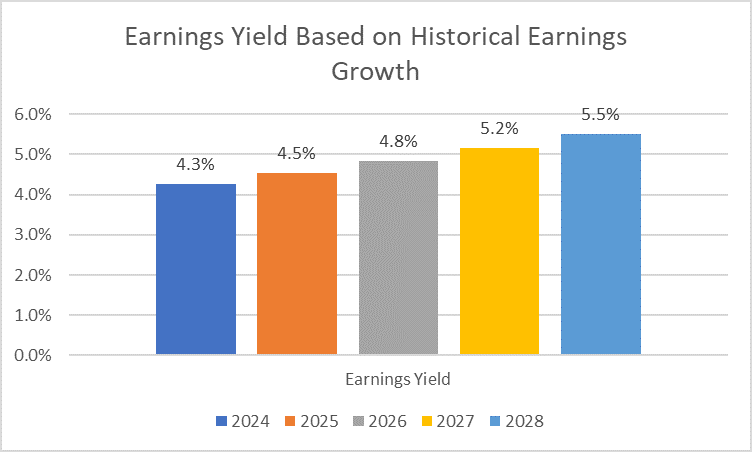
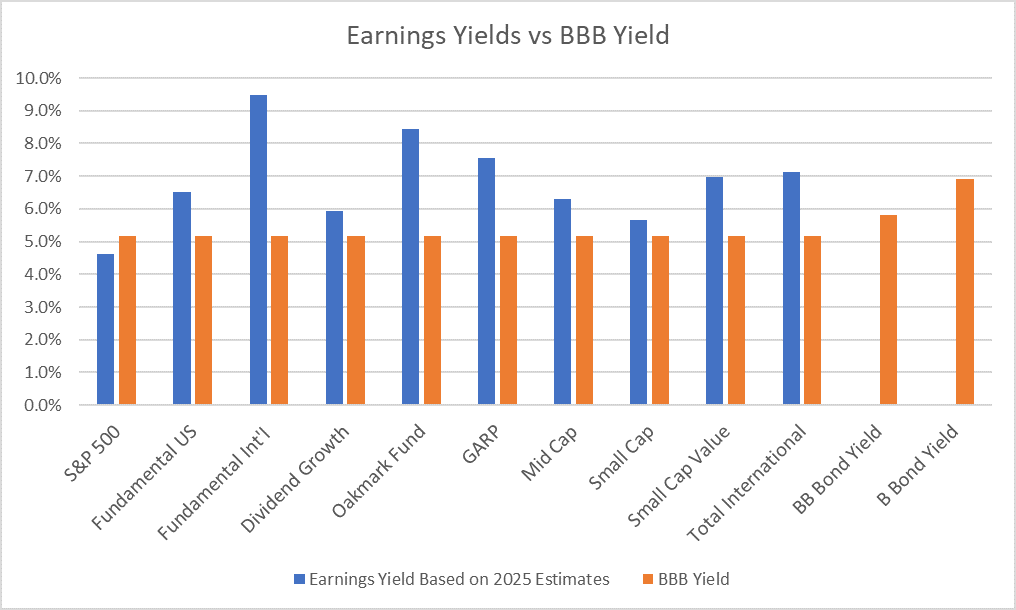
- Can the S&P 500 companies increase earnings fast enough to justify current valuations? Based on many measures, the S&P 500 remains dramatically overvalued. Our basic valuation check is to compare the earnings yield of the index to the BBB bond yield. By that measure the current market is 33% above fair value. That’s actually an improvement from last quarter when it was 43% over fair value, but the improvement was mostly a result of lower interest rates. With the spread between Investment Grade bonds and Treasuries at cycle lows, it seems unlikely that rates will be more help from here so earnings will have to take the lead to reduce the overvaluation. We have earnings estimates through 2025 and we have an estimate of long-term earnings growth (10.4% which is well above the long term average of 6.6%). Using those estimates, it would take until 2026 for the earnings yield of the S&P 500 to reach fair value at today’s rates. If we use the historical earnings growth rate (6.6%), it would take until 2028 to reach fair value, assuming no change in rates or spreads. There are alternatives. Value indexes – large, mid and small – all have earnings yields above the BBB bond yield as do international indexes (see below).
- Is it time to diversify more aggressively into non-U S stocks? The S&P 500 has outperformed the EAFE (non-US stocks) since 2010 by over 4x. This outperformance has pushed US stocks to a 64% allocation in the ACWI global index. The US economy, however, is only about 26% of total global GDP. US stocks have never been as over-represented in the global index relative to GDP. The last time US stocks exceeded 60% of global market cap in the 1960s/early 70s, the US economy was 40% of global GDP. From 1971 to 1980, international stocks outperformed US stocks more than 2 to 1. Non-US stocks are underrepresented in the global index and have a big valuation advantage over US stocks. All they really need to outperform is a weaker dollar, which we don’t have yet but is certainly on my list of things I’m pretty confident will happen.
- Can other parts of the market continue their Q3 outperformance? REITs, gold and small cap stocks all beat the S&P 500 during Q3 and all have much cheaper valuations. Value stocks also outperformed across all market caps (large, mid, small). REIT performance is inversely correlated with interest rates (rates down, REITs up) so if my expectation of an economic slowing in Q4 is correct, they should be able to continue performing well. Gold will depend on rates too but more real rates than nominal, but if real growth slows, real rates should fall too. Small caps and value stocks tend to be more economically sensitive so if the economy slows they may pull back. On a longer term basis, I think all of the outperformers in Q3 can continue to do well. Value – international value in particular – continues to look very attractive and I think any slowdown will be short-lived like past hurricane effects.
- Is the economic data being produced by the government accurate? Is it useful for analyzing the economy in real time? The recent GDP revisions should give us all pause about the accuracy of economic data when it is first released. The BEA does annual revisions to its data and they often provide surprises but two things in this recent revision really stood out to me. The Q1 GDP data revisions included a change to Disposable Personal Income that more than doubled the previous estimate from $224.9 billion to $465.1 billion. A quarter trillion bucks seems like a lot to find underneath the nation’s sofa cushions. Savings were also revised higher and the savings rate (savings as a % of Disposable Personal Income) was revised from 3.3% to 5.4%. All the worry about a low savings rate turned out to be based on faulty data. This is why we have to use common sense when assessing the economy. Did it make sense, with interest rates as high as they’ve been, with even short-term rates offering a positive real return (above inflation), that the savings rate would be so low? The answer was an obvious no and the data finally caught up.
- Will the current large and rapid investment in AI pay off? I don’t know if the full tab can be justified but there are already companies using AI to increase efficiency. See this article about how Flexport is using AI to reduce costs. Flexport is a supply chain tech company that is using AI to parse shipping documents and reducing administrative costs:
“Parsing the document is about five cents on OpenAI with vision and then a couple of prompts,” Nederlof said. “So you go from a document parsing being anywhere between five and ten dollars to spending five cents, maybe 10 cents, worst case, on the automation. Then a human looking at it at one dollar if they can go fast through the documents.”
It’s just one example in one industry but there are certainly others; AI is making a quantifiable difference. The promise of AI is unique to some degree because, if it works as advertised, there are applications in just about every industry. Such a widely dispersed improvement in productivity could have a profound impact on the economy. Or it could be a marginal improvement that is hard to measure. The early results seem promising but I don’t think we really know the learning curve for AI yet. Is there a Moore’s Law for AI? Improvements from generation to generation seem to be slowing already. What if this doesn’t get us to the “singularity”? And what about the dangers, which we have no way of even assessing at present? If the thought of Elon Musk, X and an algorithm that has no moral compass gives you chills, welcome to the club. The possibilities for mischief are large with AI, as are the potential rewards, so expect some form of regulation – which established players will embrace to try and limit their competition. I’m not sure whether I should hope AI is all it’s cracked up to be or pray to God it isn’t.
- Is China turning Japanese? Maybe. It’s a heavily indebted economy with a demographic problem and hostile trading partners. I’m not sure I could give a better description of Japan in the late 80s. Another similarity is that Japan enacted fiscal stimulus after fiscal stimulus in the 90s, all too no economic effect. Each time the stock market would rally only to fall back to a lower low when the package failed. If that sounds familiar, it should. China’s announcement of a stimulus package to come sent stocks soaring but disappointment with the actual plan has already started to bring them back to earth. And don’t be surprised if they get hit again this week as announcements about the package over the weekend also disappointed.
There are always a myriad of questions faced by investors. Yes, there does seem to be a lot of uncertainty right now but in reality it’s probably no more than usual with the exception of the election. Long-term investors should be expecting mid to high single digit long-term returns – depending on risk tolerance – from their diversified accounts over the long term. There will be periods below that and periods above that but the goal is to limit the range of outcomes around a return that allows you to reach your goals. Diversification provides consistency but it can be frustrating when one asset class or another is putting up big returns. I was told a long time ago, by a very smart man, that I would never own enough of the things that are going up and would always own too much of the things that are going down. He also said that trying to guess the next big winner or loser was a fool’s errand that would lead to even more disappointment. Truer words were never spoken.
Joe Calhoun
Environment
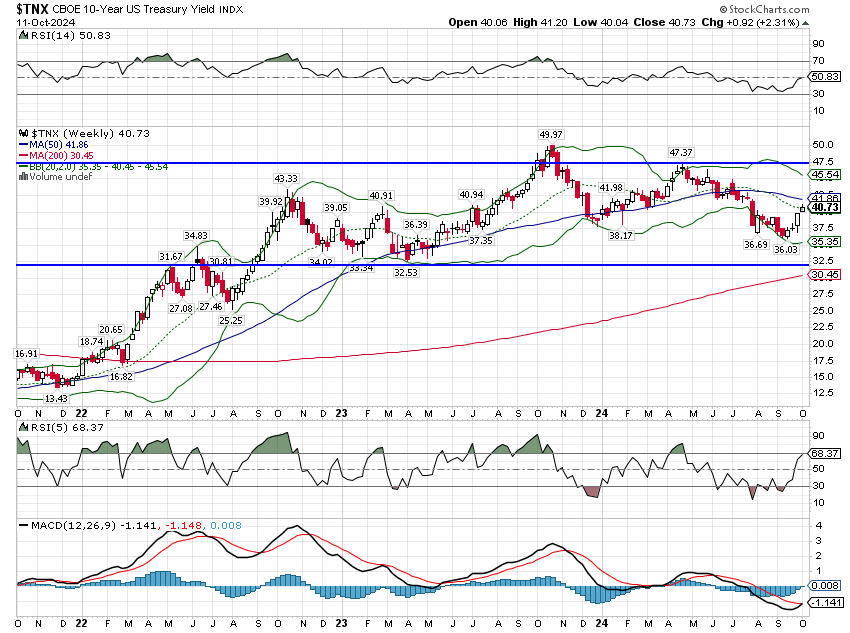
10-year Treasury yields rose 9 basis points on the week to continue the recent short-term trend. The intermediate-term trend remains neutral with rates remaining in the trading range that has persisted now for 2 years:
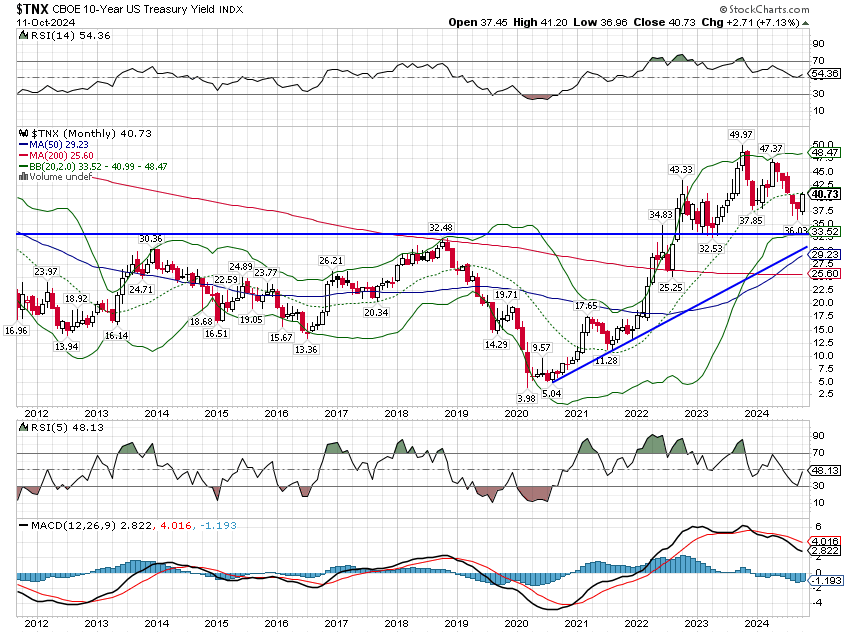
Long-term interest rates have been in a rising trend since the summer of 2020 and for now we see no reason to expect that to change.
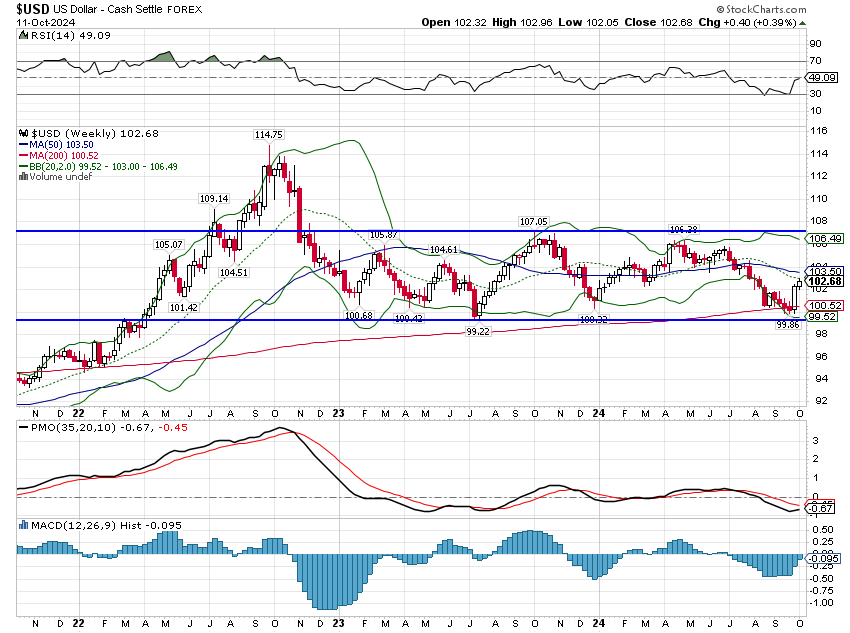
The dollar was also up on the week by 0.4% and like the 10-year rate, remains in a trading range that has persisted for two years. The intermediate-term trend is neutral:
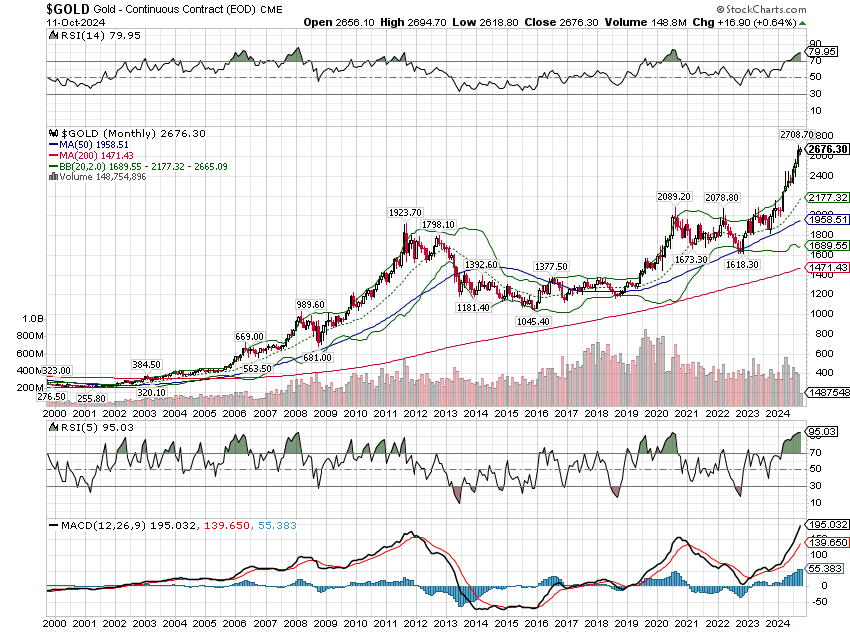
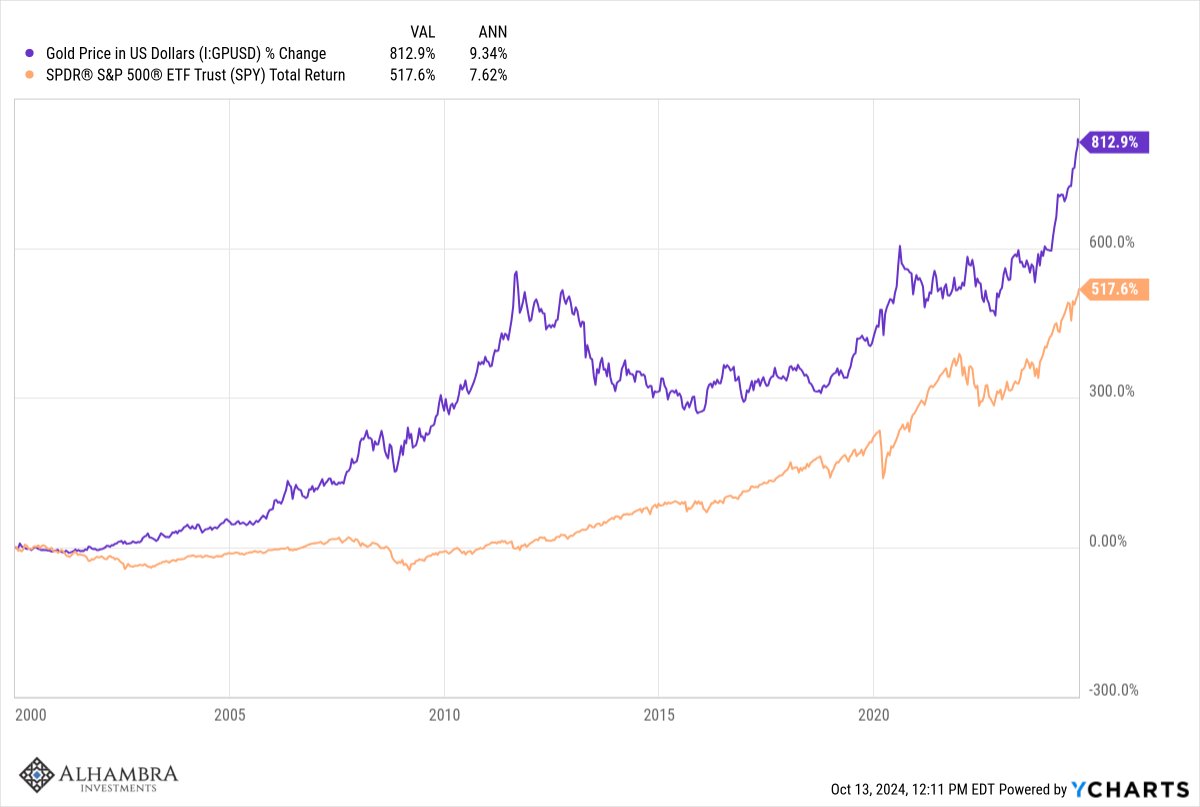
The dollar has largely been strong and stable since 2015 but I would emphasize that the dollar index is a relative value; it only tells us how the US economy is doing relative to the rest of the world. Maybe the more relevant price is gold and on that score the dollar has been in a downtrend (gold rising) since the turn of the century:
Since 2000, the price of gold has risen 813% while the S&P 500 is up 518%. Gold’s rate of change accelerated in late 2022 and has outperformed stocks since November of that year. Can it maintain this rate of change? Probably not but the trend here is obvious.
Markets
There wasn’t much movement in markets last week although large cap growth stocks did have a pretty good week. However, as I’ve noted before, value stocks continue to lead over the last three years and I think that is the beginning of a long-term trend.
While small caps have underperformed their larger counterparts over the last year, the longer term gap continues to narrow especially among mid and small cap value relative to large cap. Not that I’m saying we’re in for a repeat but it should be noted that small caps outperformed during the inflationary 1970s by a pretty good margin (10% per year vs 5.6%).
Commodities were up for the week and have had a decent year but they’ve gone nowhere over the last year. With economic weakness expected in Q4 and China stimulus disappointing, I find it hard to generate much enthusiasm.
Sectors
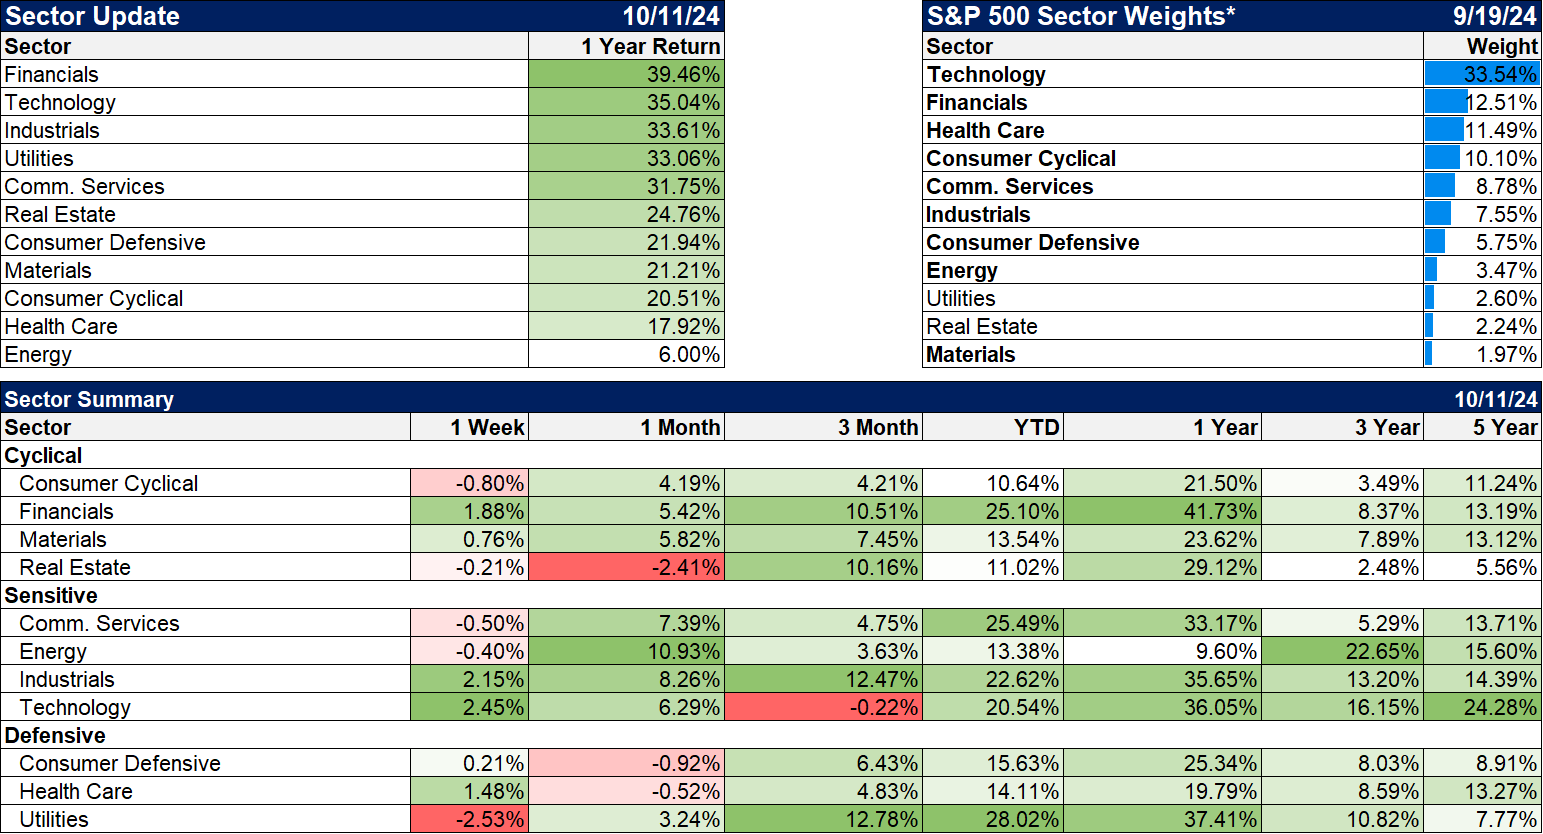
Sector performance over the next few weeks will be driven by earnings. Last week the earnings season was kicked off by some of the big banks and so far they look pretty good. Earnings growth has been accelerating in recent quarters and this one is expected to continue that trend.
| Q3 24 vs Q2 24 | Q3 24 vs Q3 23 | Trailing 12 months |
| +2.76% | +14.78% | +8.0% |
Based on operating earnings, bottom up estimates.
Financials have now taken the lead over the last year, partially attributable to a steepening yield curve.
Market/Economic Indicators






Stay In Touch