The stock market surged last Friday after the employment report showed a gain of over 300k jobs while the year-over-year change in average hourly earnings fell to 4.3%. That was the popular explanation and it makes sense; continued economic growth and fading inflation pressures would certainly seem a big positive (although wages have little to do with the recent bout of rising prices). Regardless of the reason, the surge in stocks was, for once this year, across the board.
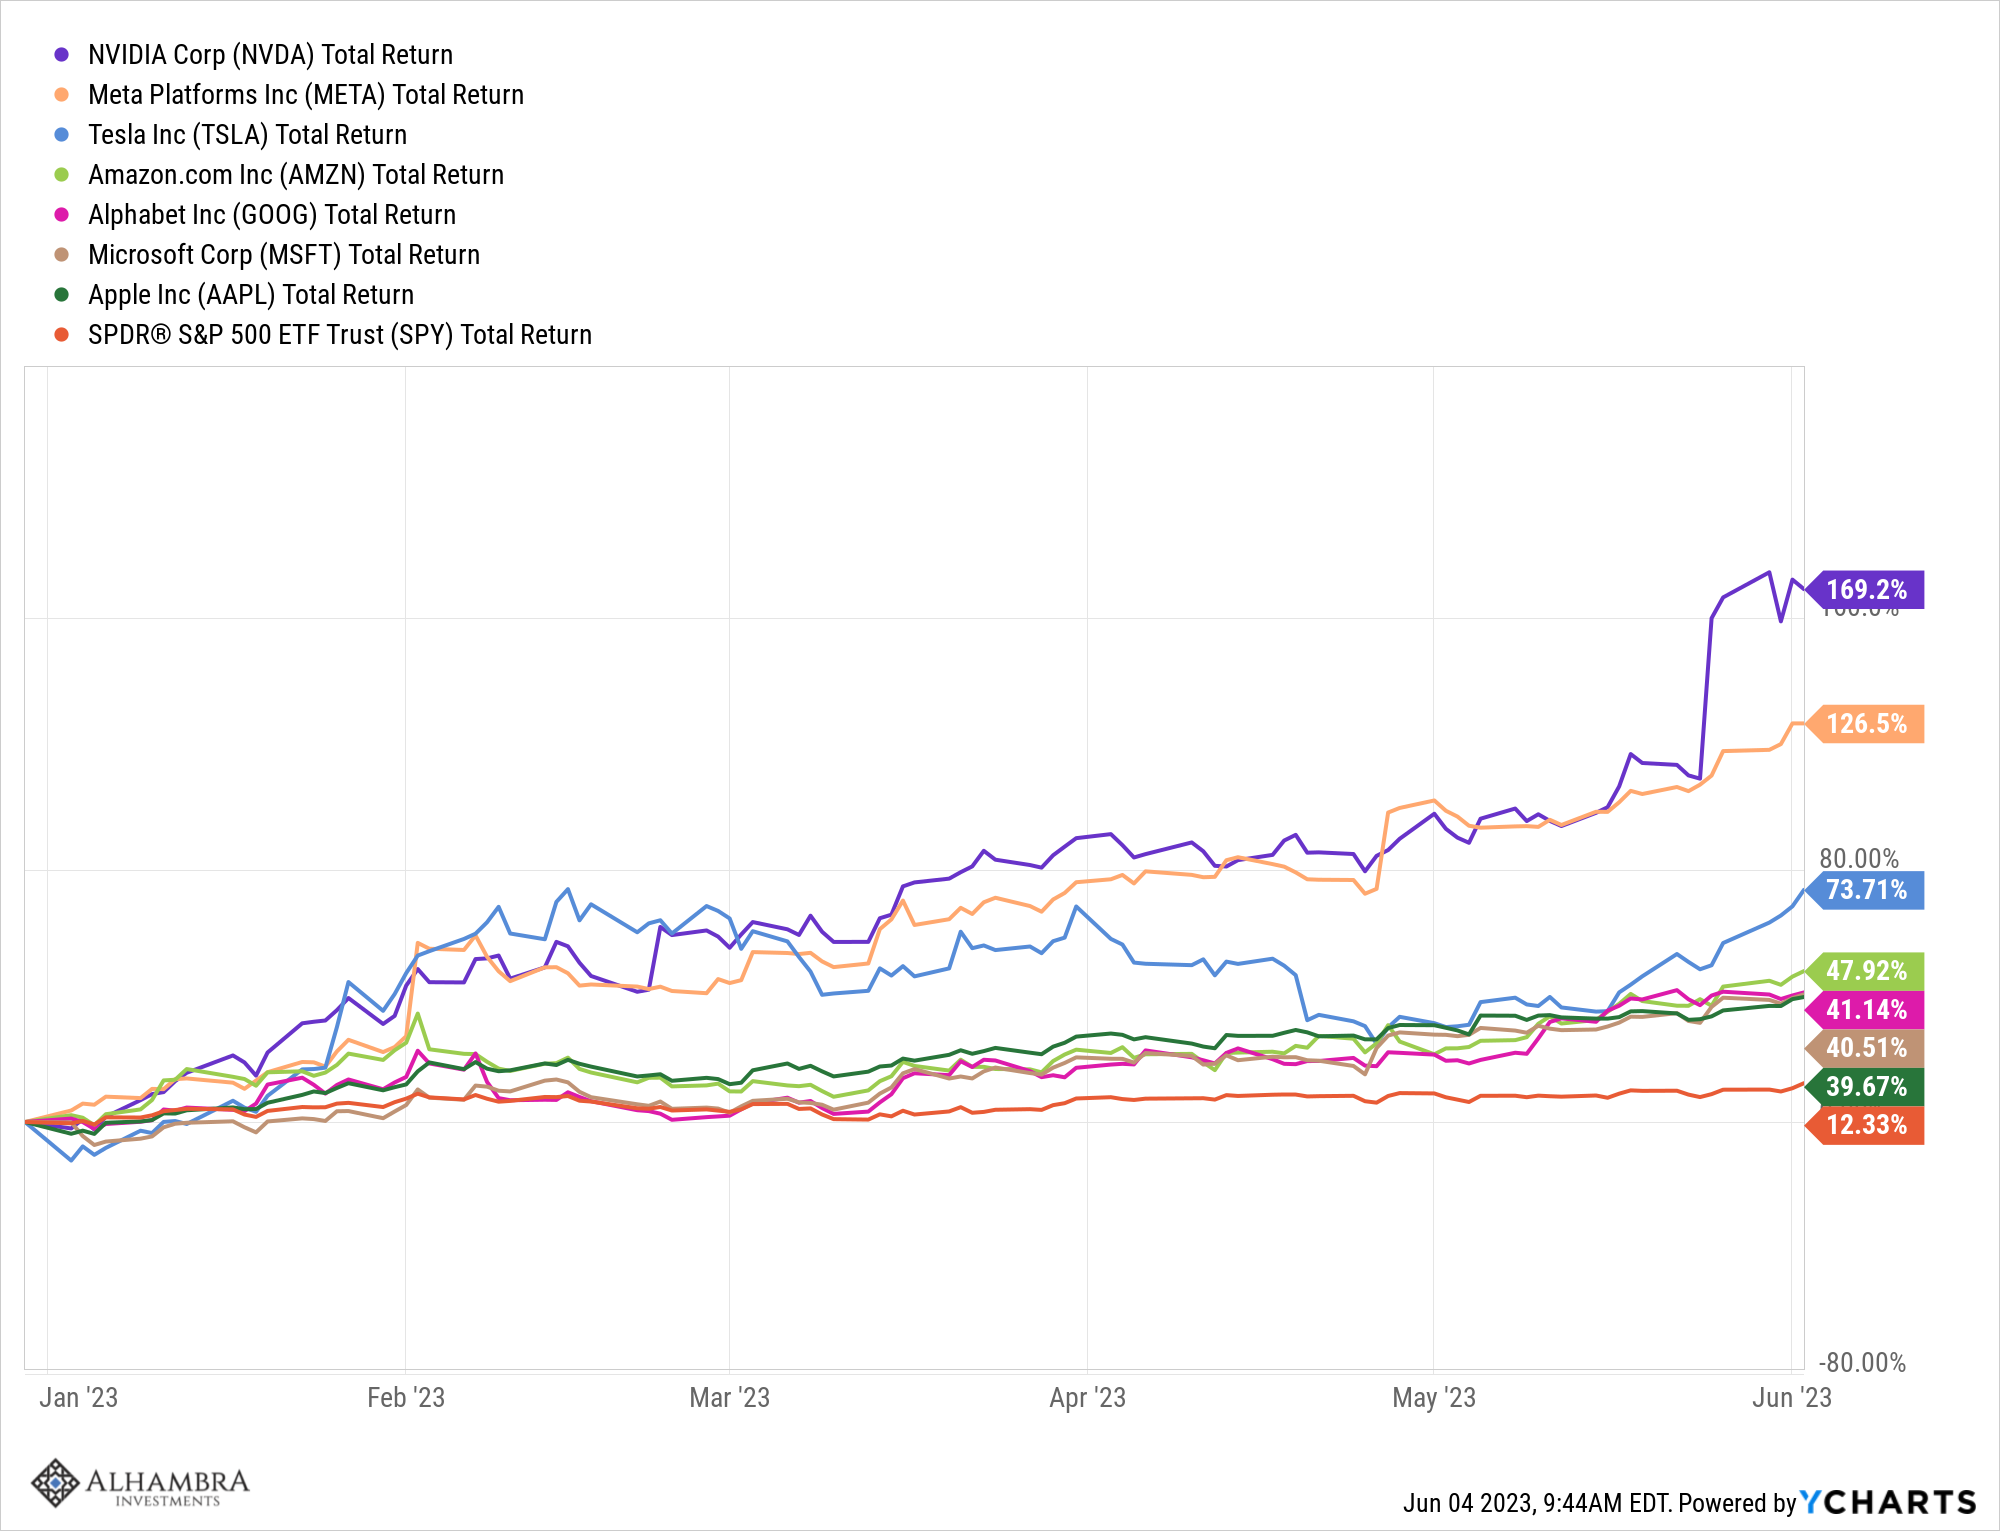
Analyzing markets and the economy during and since the pandemic has been extraordinarily difficult and this year has brought no relief. It has been the narrowest of markets with just 7 large-cap growth stocks accounting for all the gains in the S&P 500. An index of the other 493 stocks in the S&P 500 is down for the year.
These are all in the top 10 holdings of the S&P 500 and so have an outsized weight in the index. As a group, they aren’t cheap at an average forward P/E of 41. Some of the individual names aren’t that outrageously expensive but as a group, the multiple is hard to justify. Of course, with artificial intelligence, you can put any multiple you like on any company that has any tangential connection to it since no one has any idea yet what the impact of AI will be. And that is certainly the case with NVDA at 40 times sales, 200 times trailing earnings, 52 times forward estimates, and 140 times cash flow. By those measures, META and GOOG, at 6 times sales and roughly 23 times expected earnings, seem positively reasonable. Growth in revenue and EPS are basically flat year-over-year but if you ignore that you can probably make a case for them.
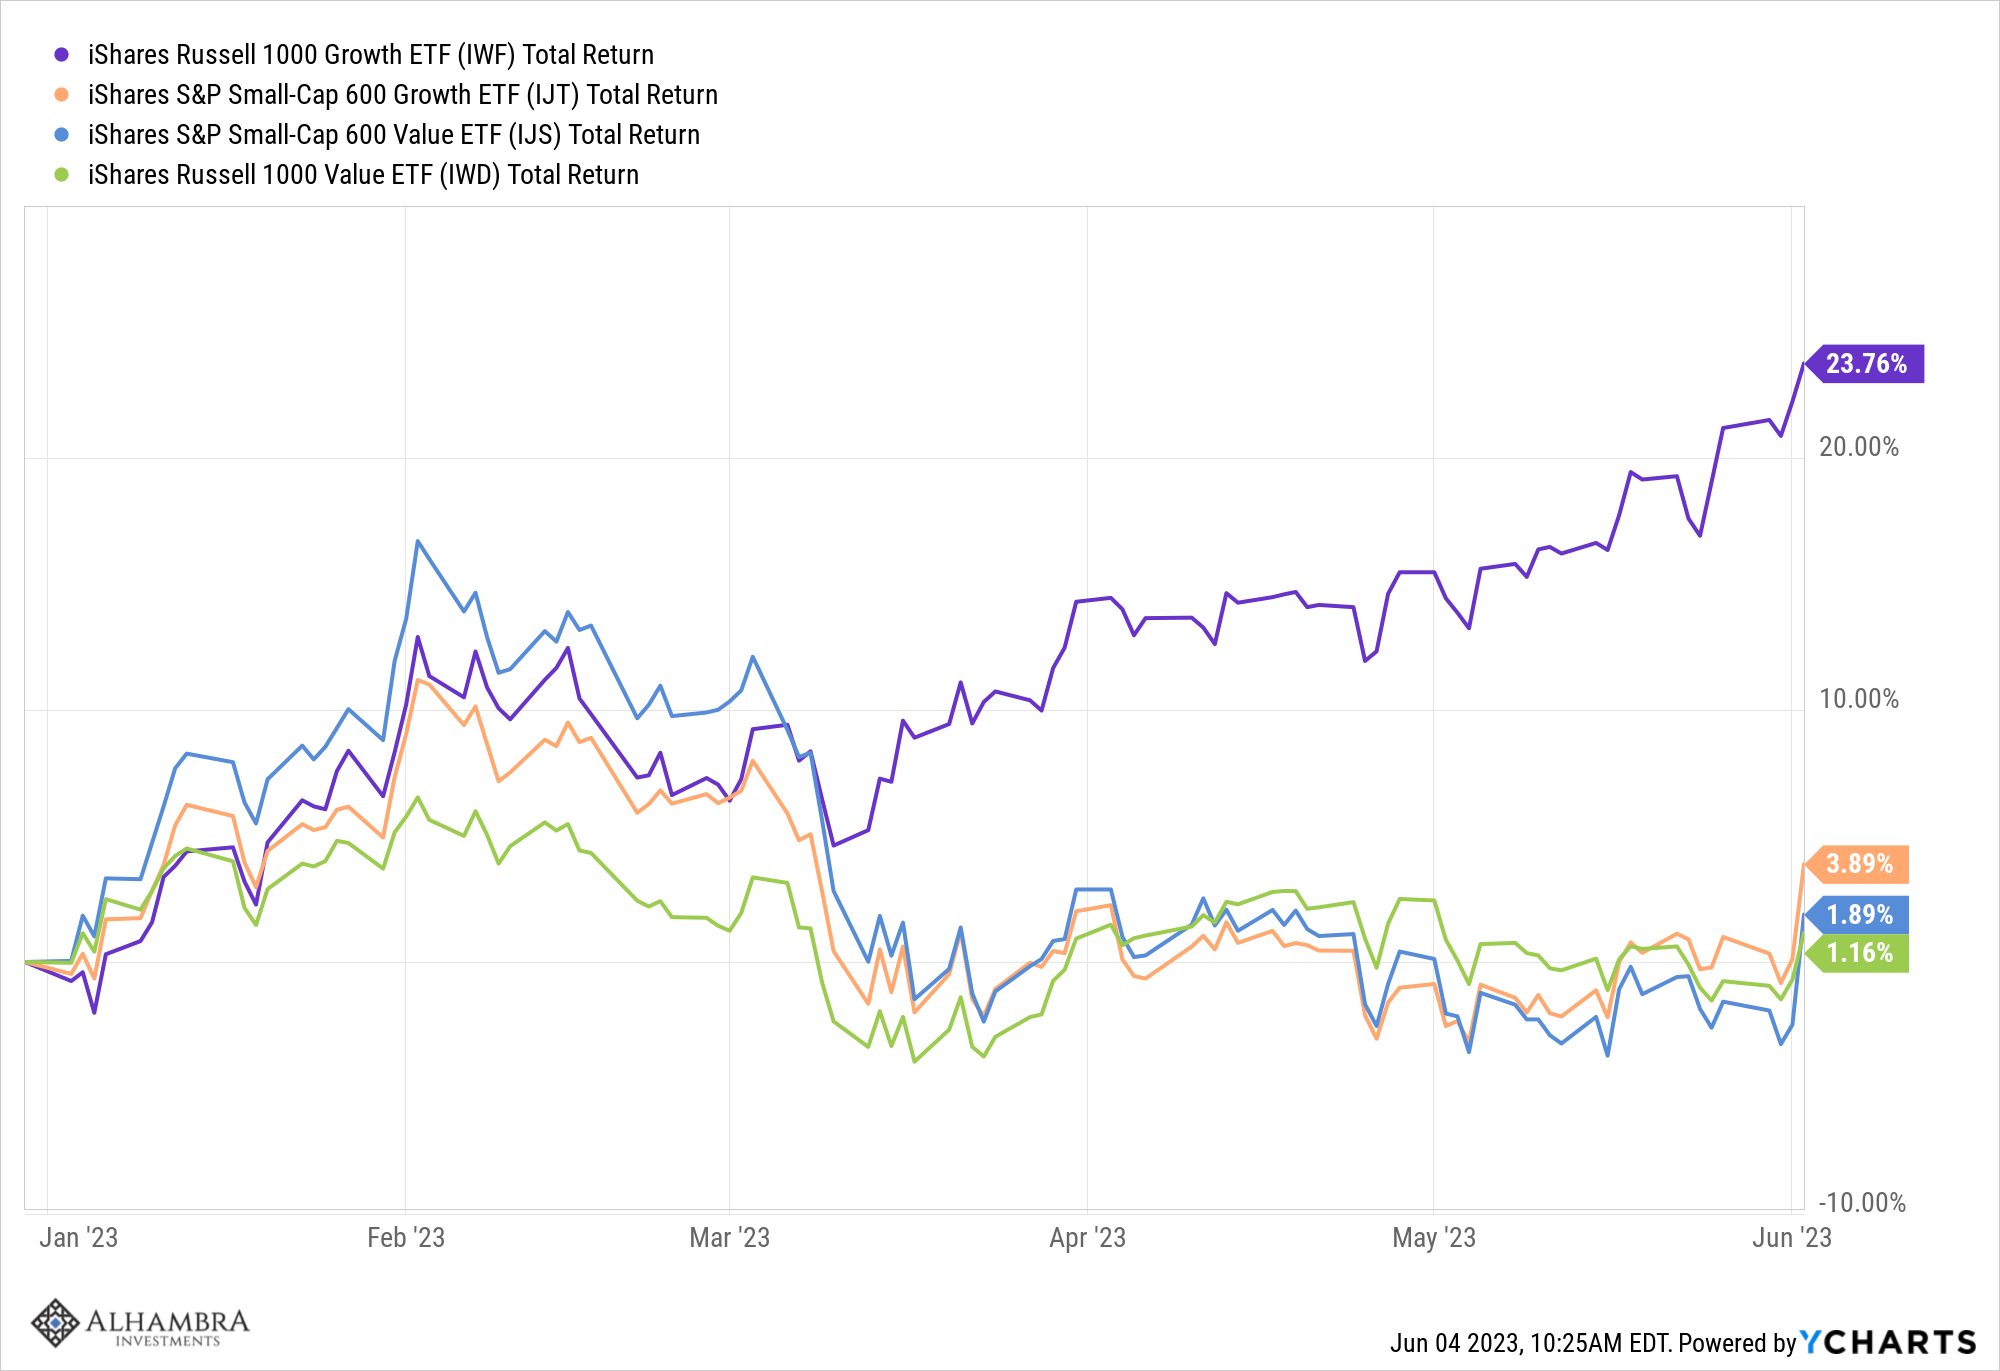
But the gap in performance this year isn’t just about those 7 stocks. It is actually two dimensional with growth outperforming value and large company stocks outperforming small company stocks. The Russell 1000 (large cap) growth index has outperformed the Russell 1000 value index by 22.6% just since the beginning of the year. It has also outperformed the S&P 600 (small cap) growth index by 19.9%.
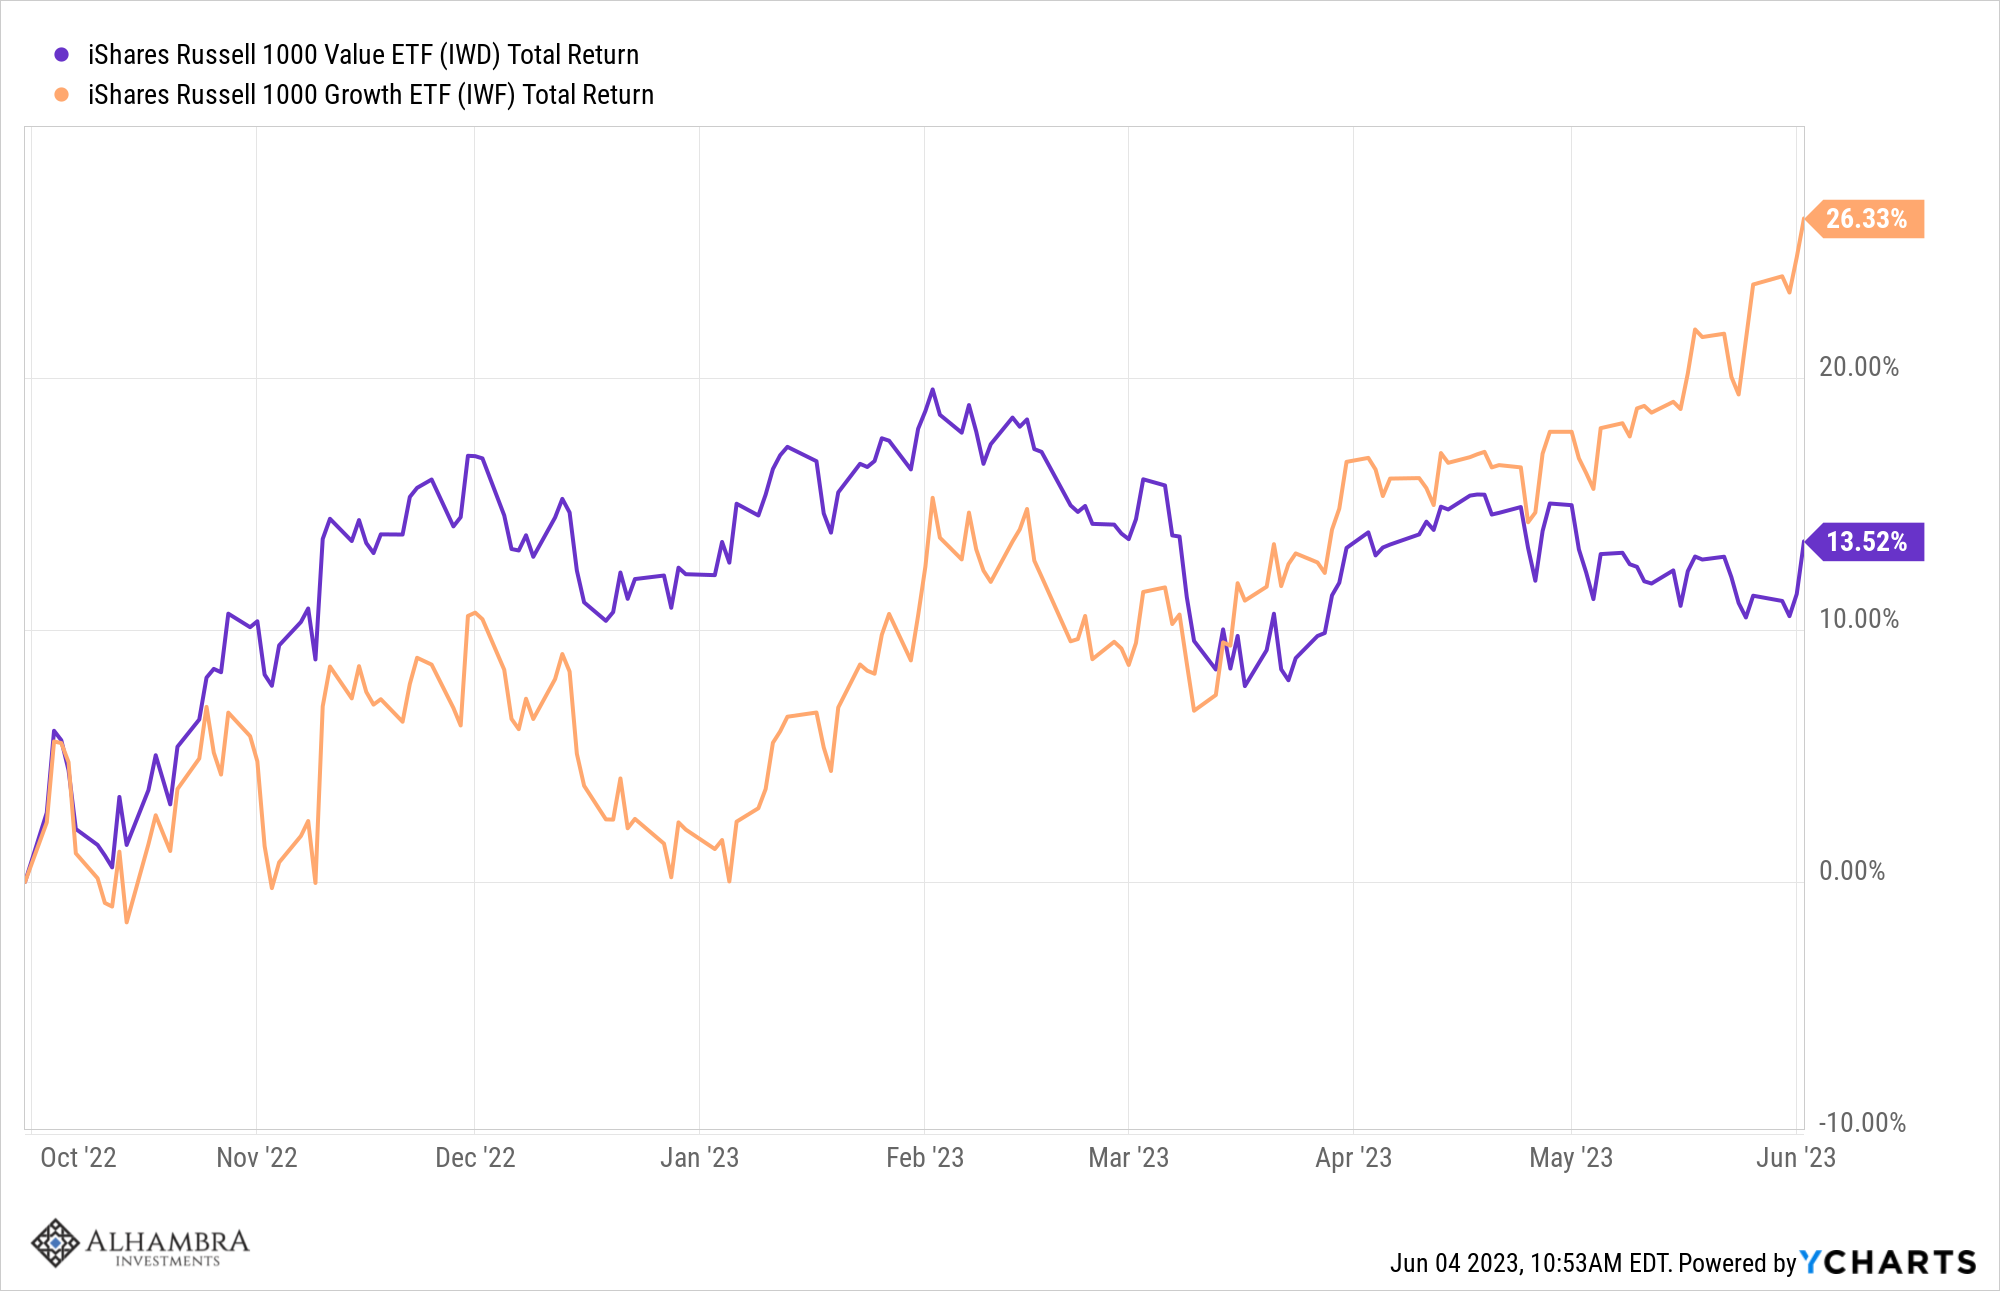
Stocks were hit hard last year because of fears about inflation and higher interest rates. Higher rates, all else equal, mean lower valuations for stocks so it isn’t coincidence that stocks made their lows last year when interest rates made their highs (neither is it coincidence that stocks have been great things to own since interest rates peaked in the early 80s). Since the lows, value and growth performed about the same until May when the AI mania started to take hold. The gap between growth and value in May alone was 8.5%.
What this means, at least to me, is that the conversation around markets has shifted in the last two months from fears about inflation and interest rates to fears about economic growth – recession. Starting in April after several bank failures, the market started to price in Fed rate cuts before the end of the year. At the peak of growth concerns, about two weeks ago, the market put the highest probability on 3 rate cuts by December. In other words, the Fed Funds market was, at least partially, pricing in an imminent recession.
In the course of the last two weeks and especially late last week, those rate cuts were mostly priced out of the markets. As of Friday, the highest probability for the Fed funds rate in December was for 5-5.25%, exactly where it is today. These probabilities shift all the time so that could change soon, but for now, recession fears have faded considerably.
The big news from Friday is that the rally wasn’t led by growth stocks. Value stocks and small company stocks led the way along with REITs. All of those are more economically sensitive than growth so the good news in the employment report Friday was sufficient to move them higher. The size of the move was probably driven more by positioning; large spec accounts have been short the S&P in size for several months and also short the Russell 2000 (small caps).
So, what about the economic growth outlook? I have said before that investors’ emphasis on the employment report as a measure of economic growth is misplaced. The initial report for any given month is basically nothing more than an educated guess and educated is used loosely in that sentence. The monthly job totals are subject to such large revisions that even the sign (+ or -) is often revised. But last week’s report did show upward revisions to recent months which is of some comfort and some confirmation that the jobs market is still trending in a positive direction. (See below for some commentary on the difference between the household and establishment surveys.)
The global economy is still suffering from a post-COVID hangover, a mixture of a slowing goods economy (ISM manufacturing new orders 42.6) and a services economy still in recovery mode (most of the new jobs in Friday’s report were in service industries). The result is an economy growing at the long-term trend of about 2%. The question is what happens next, a services slowdown or a manufacturing recovery, or both at the same time? Or do services just join goods in an economywide slowdown, a recession? The latter would certainly be the more traditional and expected outcome but this economy hasn’t done anything traditional and expected in quite a while. It is next to impossible to predict the future course of the economy in the best of circumstances and COVID has made it harder still.
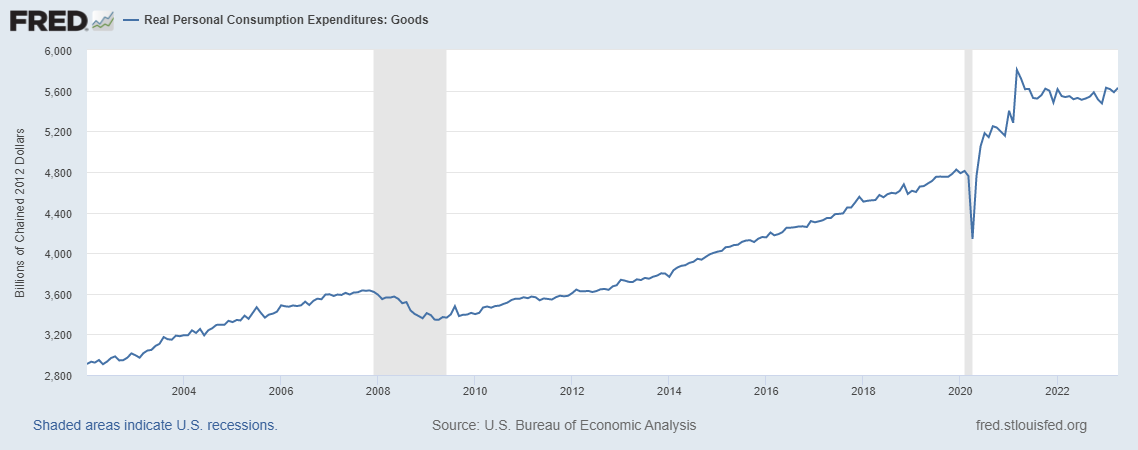
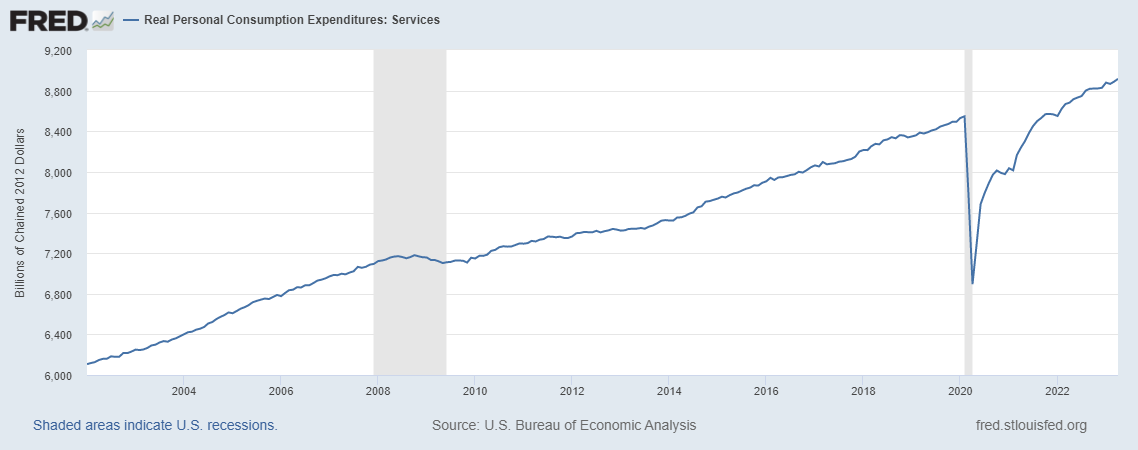
While we don’t know the future, we can observe the present. With the economic outlook right now dependent on the path of goods and services consumption (which also affects investment) we can look at that in a variety of ways. Real goods consumption, contrary to the popular narrative, is not falling. Production, which is what the ISM and regional Fed surveys are about, is slowing but goods consumption, while down a little over 3% from the March 2021 peak, is unchanged over the last two years and is essentially, now, right on trend:
Real services consumption over the same two-year period is up 7.4% but is still slightly below the pre-COVID trend.
Where do things go from here? I can’t predict the future but, again, we can make some observations about the present that might be helpful. Production has stalled because COVID and its supply chain issues produced an inventory glut that had to be worked off. Inventories reduced Q1 GDP growth by 2.1 percentage points but with total inventories nearly flat over the last six months (which means real inventories are down) that drag is likely set to ease and maybe reverse. That will, of course, depend, to some degree, on future consumption but with real disposable personal income up 3.4% over the last year (which is a tad over the long-term annual average) and savings still well above the pre-COVID level, there is room for some optimism on consumption.
The economy has its issues as it always does but the basics seem to be in good shape. If that remains true, there is reason to believe that value stocks and small-cap stocks, which are more cyclical than large growth stocks, will recover some – or all and then some – of their relative performance deficit of this year.
Environment
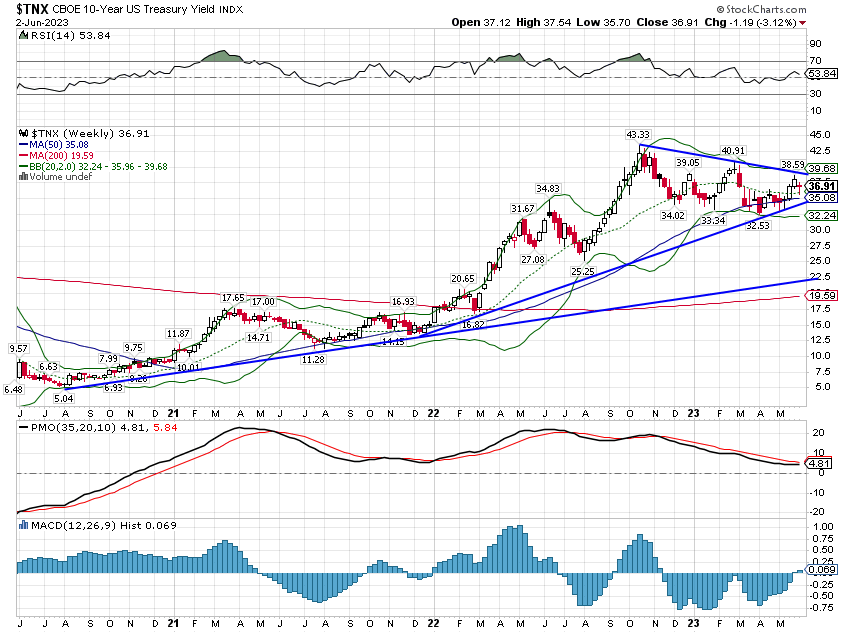
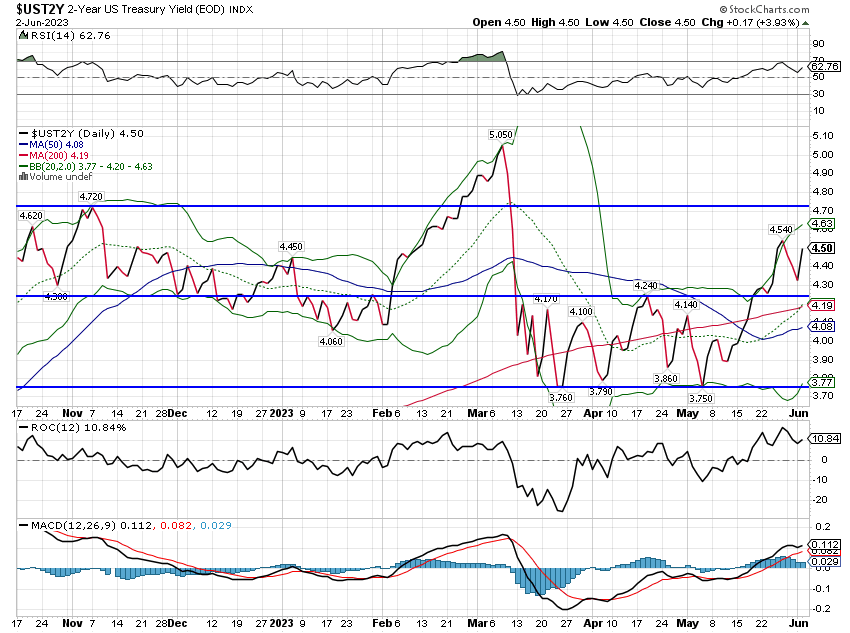
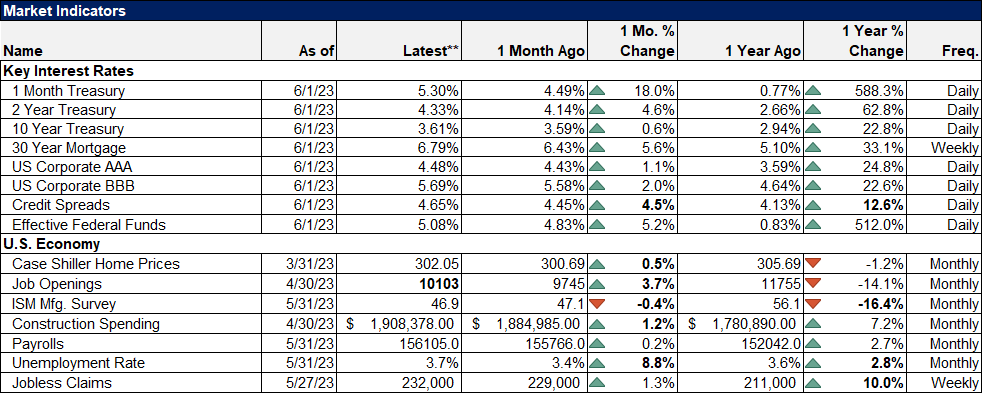
10-year Treasury yields were down some last week as the debt ceiling issue was resolved, but the economic data was generally confusing and somewhat contradictory. The Chicago PMI, the Dallas Fed manufacturing survey, and the ISM manufacturing survey were weaker than expected with ISM new orders particularly weak. That also fed through to prices though which fell to 44.2 from 53.2, taking some pressure off on the inflation front.
On the other hand, the JOLTs report saw a rise in job openings and the employment reports (ADP and official) were both pretty strong while average hourly earnings moderated some. Construction spending rose and is now up over 7% year-over-year. Case-Shiller reported a rise in house prices of 1.5%, much stronger than expected and an indication that house inflation, of all things, isn’t dead yet.
All of that added up to a slight fall in longer-term Treasury yields, a flat 2-year, and a continued rise in the 3-month T-Bill rate. As expected, the 1-month bill rate did fall some after the debt ceiling bill passed but the rate is still in an uptrend. The probability of a rate hike at the June FOMC meeting is now down to about 25% but the odds of a hike in July have risen to a bit over a coin flip. Longer term, the market has about a 40% chance that the Fed Funds rate is unchanged by the end of the year.
So, to recap, the 10-year and 2-year Treasury yields are in short-term downtrends (which could just as easily be called neutral or no trend) while shorter-term rates are in short-term and intermediate-term uptrends. Put all that together and what you get is…not much. The yield curve is still inverted (and has gotten more inverted recently) but there is little sign of recession right now. In other words, about the same as it has been for the last year.
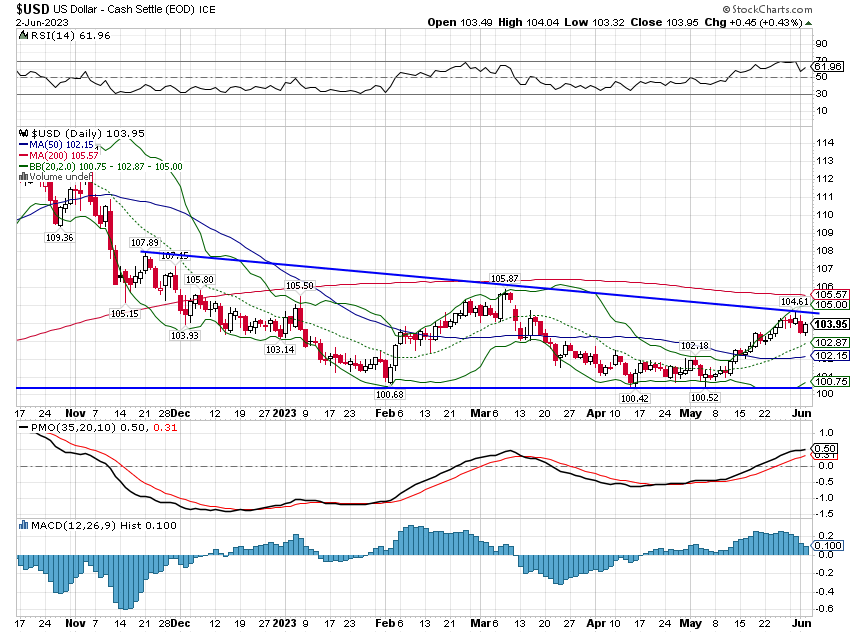
The short-term US dollar trend also remains neutral as the Fed last week seemed to indicate it would skip a hike at the June meeting while Lagarde said the ECB will persist. The economic data in Europe hasn’t been that bad outside of Germany but the accepted narrative is that the EU is weaker than the US. Inflation does seem to be coming down fairly rapidly though so Lagarde may just be talking tough.
Markets
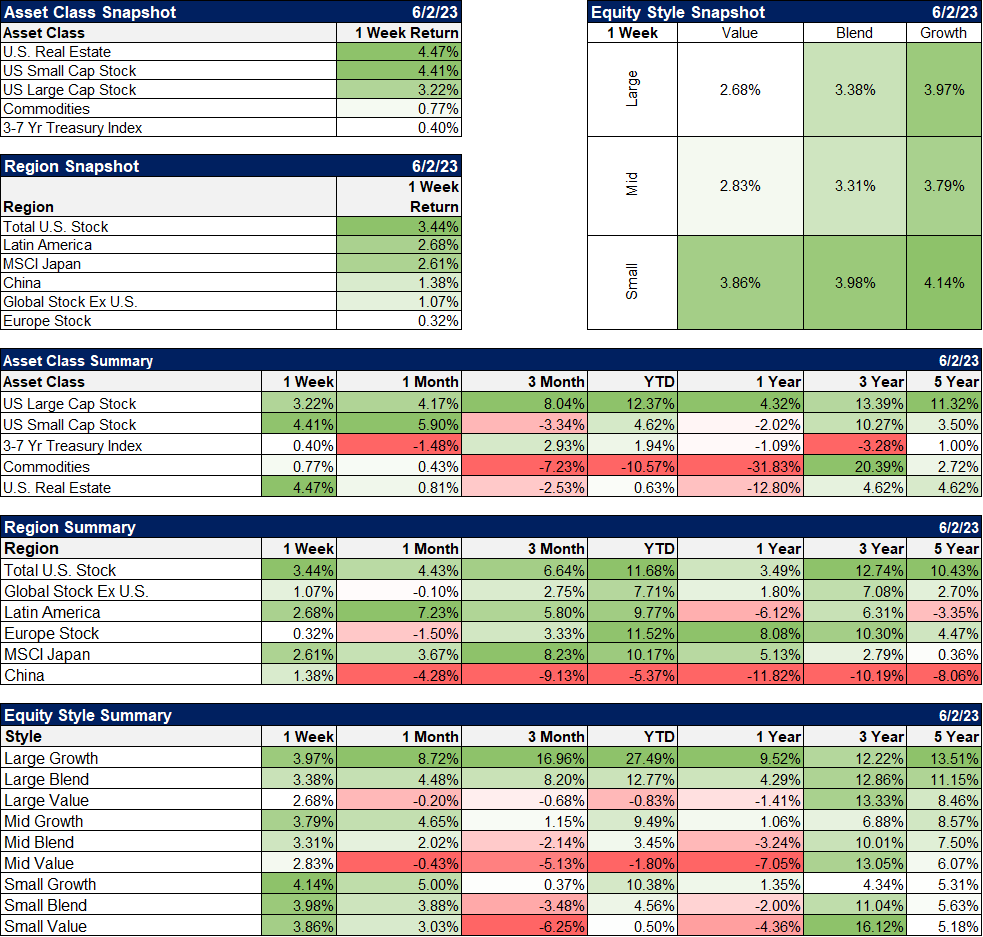
The major asset classes were all higher last week with most – in some cases more than all – of the gains in risk assets coming on Friday. Previous laggards played some catch-up Friday with REITs, small caps, and value stocks all outperforming. Non-US stocks were also generally higher for the week with Latin America and Japan leading.
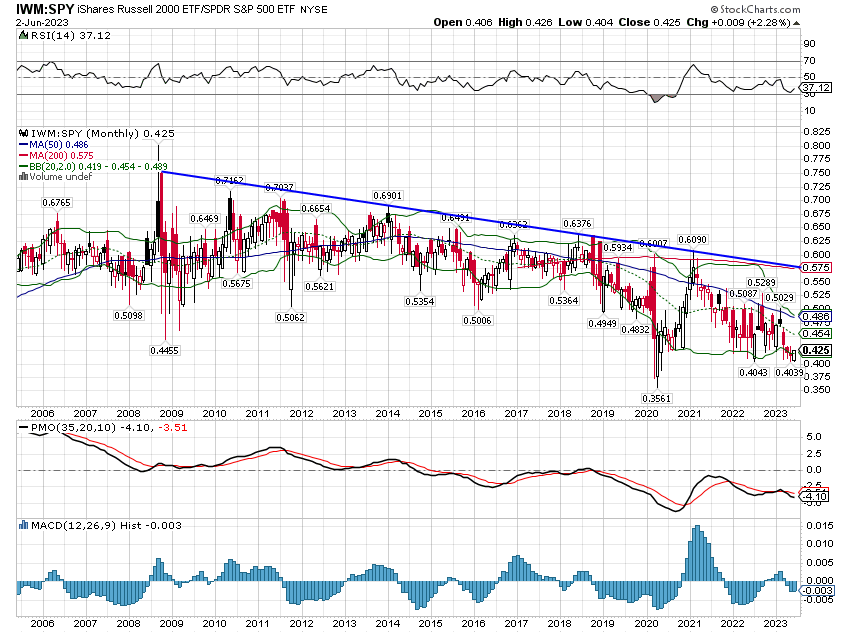
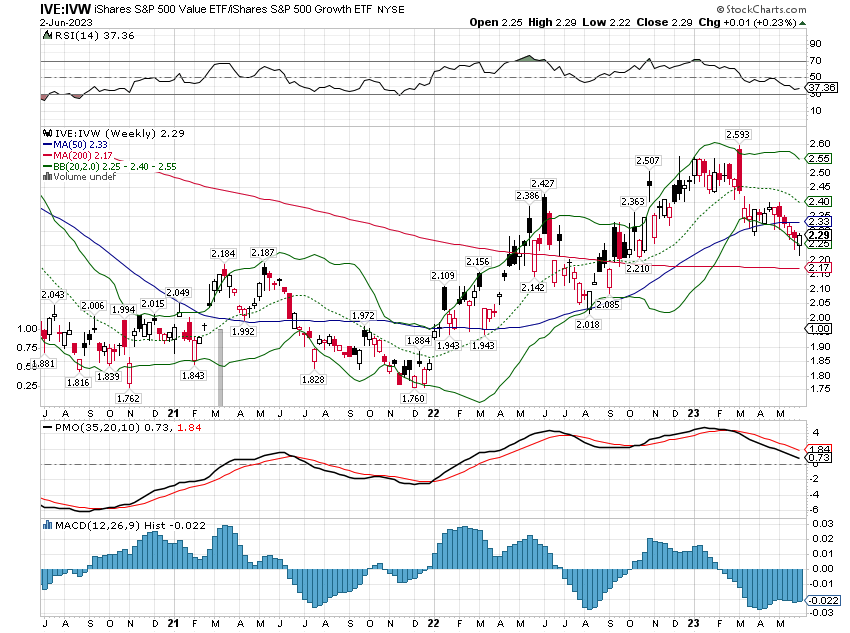
The outperformance of growth, and specifically large-cap growth, this year has been extreme and we should expect to see some reversion to the trend. Small caps and real estate are particularly unloved right now and both did well in the Friday rally. Small-cap value stocks were up over 4% on Friday alone and still have a long way to go just to get back to the previous downtrend. This setup is very similar to one we saw after the initial COVID selloff:
The correction in the value trade has been getting a lot of attention but the small/large divergence is more extreme. The value correction looks like exactly that to me – a correction.
The rally on Friday was nice but the S&P 500 is just back to its highs of last August and I think we can all agree that sentiment in large growth stocks is a bit frothy. The rally in REITs and small-cap value may be more important because sentiment is already so poor. The gloom and doom around REITs and real estate more generally is palpable. It is unusual to see sentiment so deeply negative for an index that is actually up on the year but that is the situation. Some of the big office REITs are trying to bottom too with SL Green up over 9% last week while Vornado and Boston Properties were both up over 6%. There are still a lot of problems in the real estate space so this may just be the proverbial dead cat bounce but it bears watching for sure.
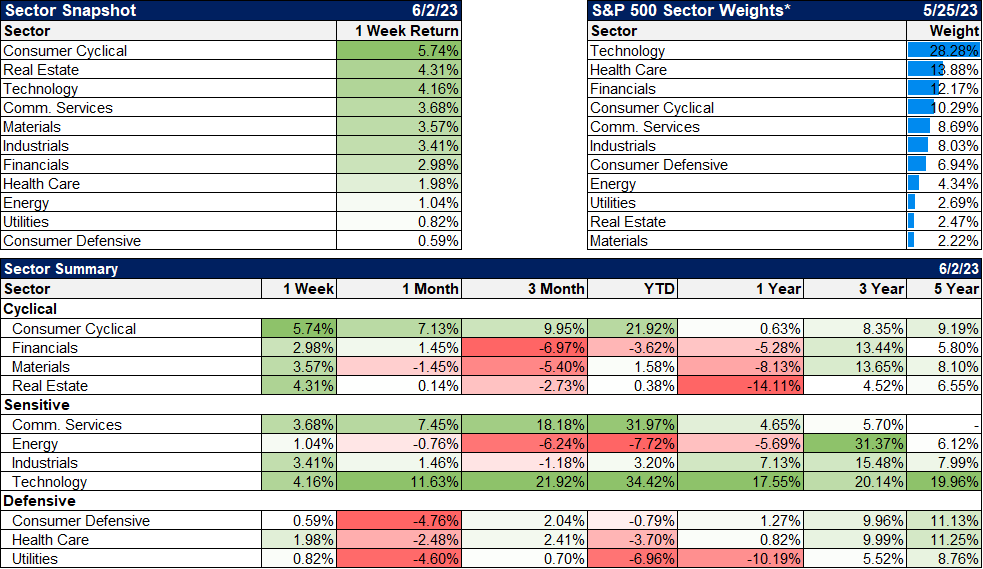
Cyclicals were the leaders last week as recession fears eased with the employment report Friday and the Fed’s loud whispers about skipping a rate hike next week. Laggards were the defensives and energy. Crude oil is holding above the March and May lows but is still in a downtrend. I don’t see a sufficient change in the supply/demand picture to make much difference either way but I suppose OPEC could change that. Will they? They are meeting as I type this so we’ll find out soon. The Saudi energy minister did warn last week that speculators should expect more pain like they felt after the surprise April production cut but that rally faded to a new low so I’m not sure that’s the boot-shaking comment he thinks it is.
Economic/Market Indicators
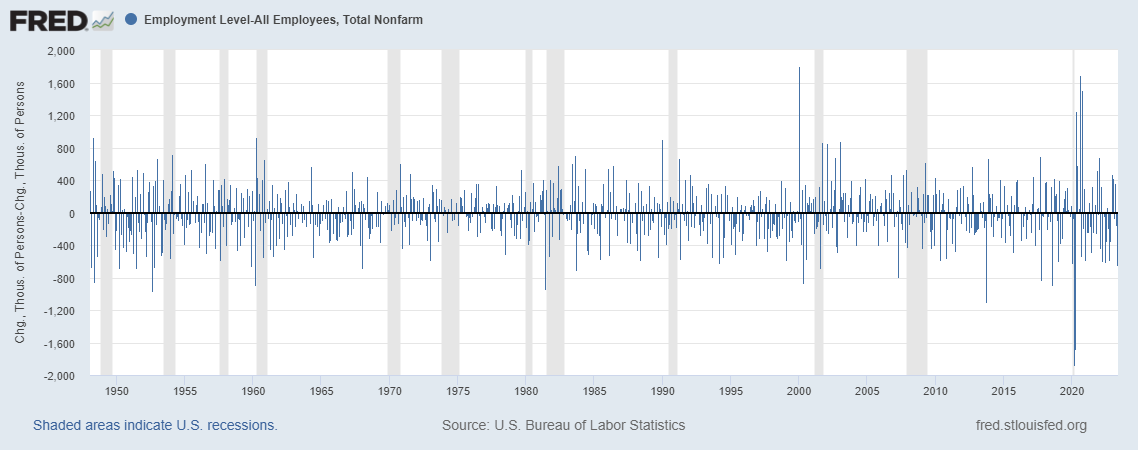
The unemployment rate ticked higher last month to 3.7%, a result of the job losses reported in the household survey. Everyone who is bearish on the economy is pointing to the difference between the establishment survey job gains and the household survey job losses. (For those who don’t know, the reported monthly job gains/losses come from the establishment survey while the unemployment rate is calculated from the household survey. No, I have no idea why there are two surveys.) If it was the other way around everyone who is bullish would be pointing to the household survey. That’s called confirmation bias and we’re all guilty of it to some degree.
So, let’s put this to rest once and for all. Here’s a chart of the difference between the change in the household survey and the change in the establishment survey on a monthly basis. If you see any pattern here it’s because you want to. This is all noise and no signal.
The advance in the S&P 500 this year has been very narrow with just a few stocks leading the market. There has been a lot of commentary about how negative this is, how it will all fall apart soon when investors finally wake up to reality and the AI stocks crash, but frankly, there isn’t much evidence to support that. Bull markets, especially at the beginning, are often led by a small group of stocks before they broaden out and more stocks join the rally. I’m sure there are exceptions and someone will waste their time this week making sure I know all about them.
The rally isn’t really as narrow as it seems anyway. Yes, if you take out those 7 stocks, the S&P 500 would be down but there are plenty of stocks that are up this year that aren’t tech or AI stocks. 125 stocks in the S&P 500 are up more than the average this year so it isn’t just 7 stocks. Cruise lines, industrials, homebuilders, restaurants, healthcare, materials, real estate, and even financial service companies are all represented in those 125 stocks.
The divergence between growth and value so far this year is extreme but extreme is the new normal. All trends these days seem to get taken to an extreme, a function, I think, of the ready availability of information. All new data is incorporated into investors’ views, acted upon immediately and simultaneously. The result is that new information is overvalued, everything extrapolated to its extreme. Good news becomes great news; bad news becomes disastrous.
There is more information available today to the average investor than ever but the signal-to-noise ratio is the lowest ever too. More information is not the same thing as more useful information. The best investment an investor can make today is a good set of earplugs.
Joe Calhoun


Stay In Touch