
The 2nd quarter is officially over and it was one of the strangest I’ve experienced in my 33 year career. To jump straight to the punchline, if you owned large cap growth stocks, you had a great quarter. If you owned almost anything else, you didn’t and you likely lost money. I don’t know when the bear market in doing the right thing will end but it wasn’t this quarter.
What do I mean by “the right thing”? Well, there are certain things all the research and decades of history says are the prudent things to do with your investments but the only way to perform well over the last decade or so has been to ignore them. Diversify your investments? Nah, just buy the S&P 500 (which isn’t very diversified despite owning 502 stocks) or the NASDAQ. Diversify internationally? Loser. Diversify into mid or small caps? Loser. Buy stocks based on fundamental measures like Price/Sales? Loser. Own assets with low or negative correlation to stocks? Loser. My generation of investors was brought up on Graham and Dodd’s Security Analysis and Graham’s layman guide, The Intelligent Investor. Today’s investors turn to Roaring Kitty.
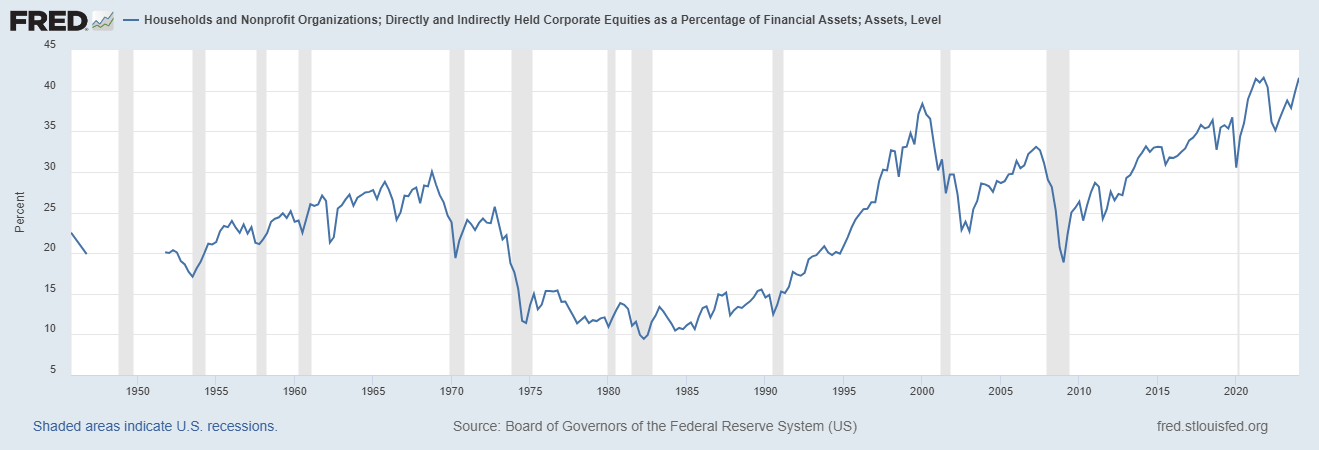
Morningstar tracks 370 asset allocation funds and out of those, only 1 has managed to beat the S&P 500 on a risk-adjusted basis since 2009. According to Cambria funds, broadly diversified portfolios have underperformed the S&P 500 in 13 of the last 15 years, a feat only matched once in the last century. It is a period so long, I fear it has taught an entire generation the wrong lessons about investing which one can see in the household allocation to equities. As a percent of household financial assets, equities now represent 41.6% of the total. That’s higher than the 38.4% at the top of the dot com boom in Q1 2000 and matches the all-time high set in Q4 2021. You might remember that as being a mere two days before the top that preceded the 2022 bear market.
Another disturbing sign of complacency: I recently read an academic paper that stated, with considerable confidence, that one doesn’t need bonds. Their conclusion was pretty profound:
As long as the equity investors are able to stick it out, they end up being better off with very high probability than somebody who’s trying to smooth out those short-term movements by diversifying into bonds.
-Scott Cedarburg, Co-Author of Beyond the Status Quo: A Critical Assessment of Lifecycle Investment Advice
Yes, fellow investors, what they discovered is that stocks return more than bonds, as long as you “stick it out” which is, of course, the entire point of diversification into bonds and other asset classes, to make sure you don’t have to “stick it out”. Or, God forbid, discover the meaning of “sequence of returns risk” the hard way. I don’t think these guys are going to need reservations for Stockholm anytime soon.
Of course, diversified portfolios aren’t supposed to outperform the S&P 500 every year and when they do, it often isn’t for a good reason. But, over the long term, diversified portfolios have provided a better risk-adjusted return than just owning “stocks”. Except for the last decade.
From 1972 to 2023, a basic 60/40 portfolio of Total US Stock and Total US Bond, returned 9.3% per year with a Sharpe ratio of 0.46. Sharpe ratio is a measure of return per unit of risk. The S&P 500 over that time provided a higher return – as would be expected – but with more risk. The market returned 10.6% per year but with a Sharpe Ratio of 0.43. The difference doesn’t seem that great but in the worst year (2008), the diversified portfolio was down 40% less than stocks alone. The biggest benefit of owning a diversified portfolio is that it reduces downside volatility so you can “stick it out” and stay invested.
If you diversified internationally and across more asset classes, the results were even better. Over that same time frame, a portfolio with global stocks, some small value stocks, intermediate term Treasuries, REITs, gold and commodities returned 10.3% with a Sharpe ratio of 0.51. That’s what diversification done right over the long term looks like. It has a return almost exactly the same as equity alone but with lower volatility and drawdown. A moderate risk version of that diversified portfolio beat the S&P 500 on a risk-adjusted basis over 60% of all rolling 10-year periods going back over 50 years. And many of the periods when it didn’t, the difference was only obvious past two decimal places.
You can probably guess the last time diversification didn’t work – the late 1990s during the dot com boom. That craze peaked in 1998/1999 when the S&P 500 growth index returned over 35%/year with a standard deviation so low the Sharpe ratio rose to 3.3 while the diversified portfolio’s was great at 2.55 but with returns that were roughly a third of the growth stocks. But over the next 8 years, diversification paid its benefits, returning 7.9%/year with a Sharpe ratio of 0.41 while the S&P 500 growth index lost 1.2% per year with a Sharpe of -0.17.
More recently, diversified strategies and the S&P 500 really started to diverge around 2016 but the acceleration over the last 5 years is stunning. The S&P 500 has had a 50% higher return than the diversified portfolio with a standard deviation (volatility measure) that is only 17% higher. That yields a Sharpe ratio of 0.72 for the S&P 500 vs 0.55 for the diversified portfolio. Like I said, it’s a bear market in doing the “right” thing.
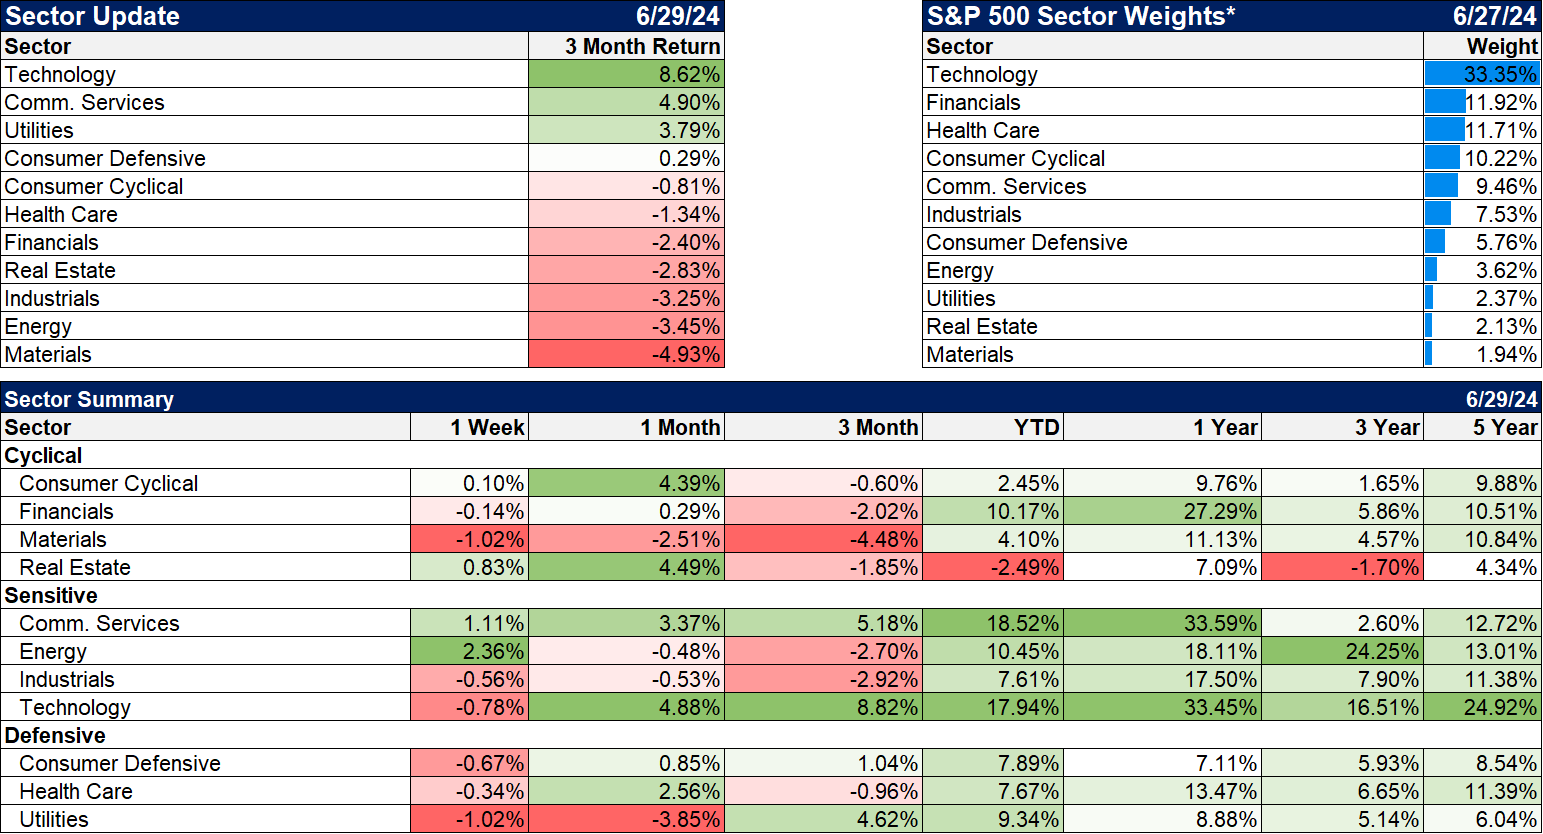
For the 2nd quarter, the divide between the top stocks in the index and everything else was stark. On a sector basis only three sectors beat the index this quarter and all of them are AI-related in some way. The total falls to two for the year-to-date period; both are technology related. Only 4 of the 11 sectors had a positive return for the quarter although only one has a negative return YTD (real estate).
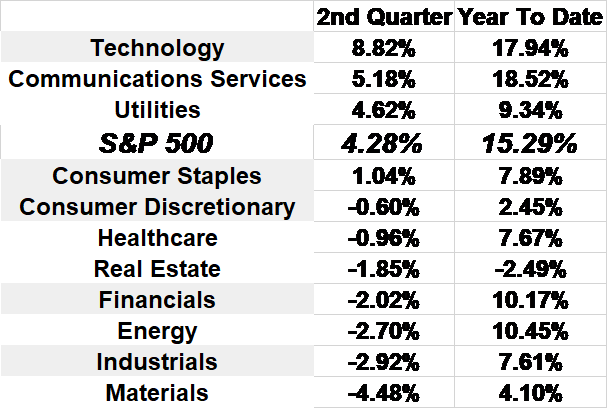
Looking at returns of the constituents of the S&P 500 shows that the key to success in the quarter was to buy large stocks with high prices and high valuations. Not exactly what you find in the textbook:

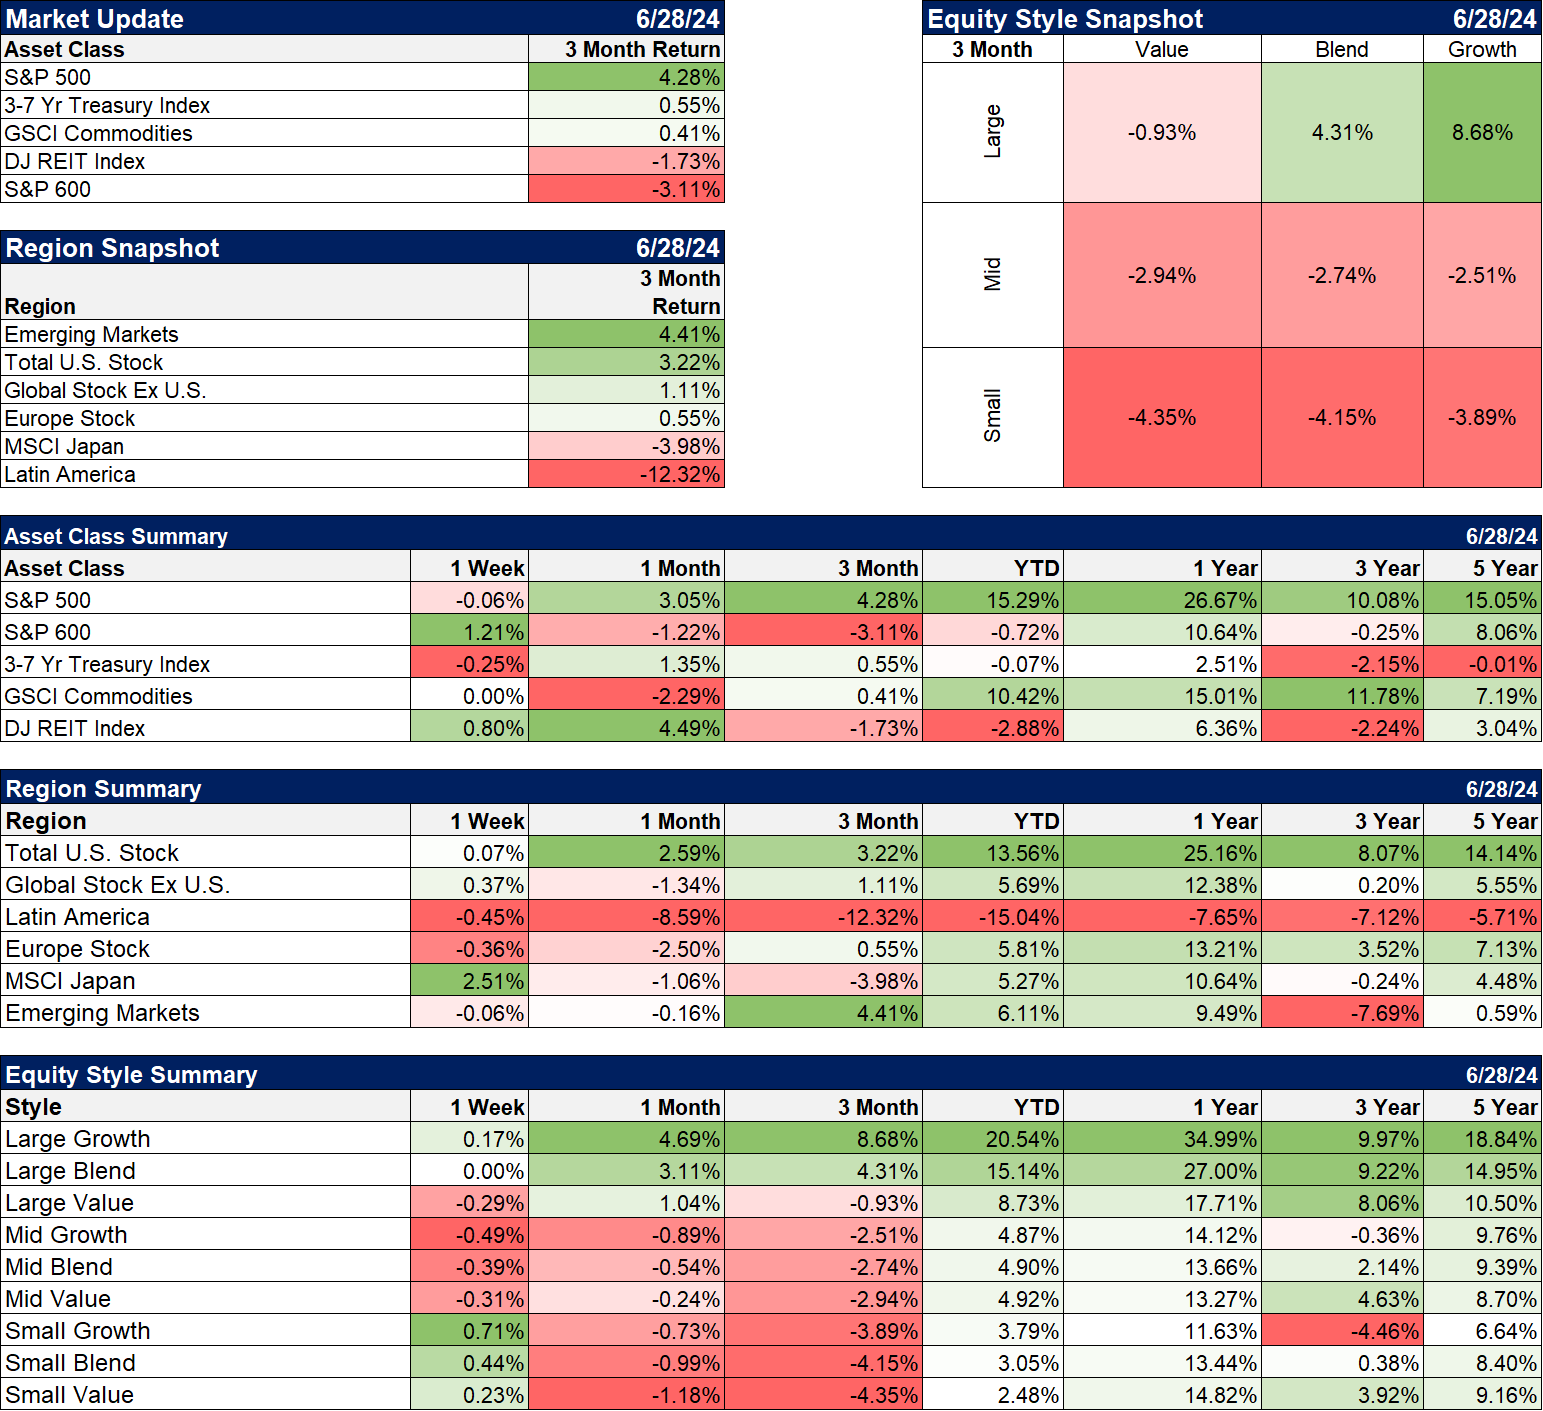
The index returned 4.3% for the quarter but the average stock was down 2.5% and the median stock lost 3.0%. Value stocks in the index lost 2.1% and even dividend growth fell, down 0.3% for the quarter.

The other asset classes included in diversified portfolios did nothing to help returns this quarter. Intermediate-term Treasuries managed a small return (0.55%) as did general commodities (0.41%). REITs were down 1.7% and small cap stocks were down 3.1%. Internationally, Latin American stocks were down 12.3%, Japan down 4% and Europe flat (+0.6%). One standout was gold which managed to beat the S&P 500 in the quarter (4.6%).
What’s driving this large dispersion in returns? It is tempting to blame it on indexing but that surely can’t explain one quarter even if it may have something to do with the longer-term underperformance of diversification. I think most of it is being driven by the AI frenzy and if so, I think it will fade with time. If you assume the hype around AI is true, then its benefits should start to spread beyond the few companies like Nvidia who are providing the hardware. If AI isn’t Ozempic for the economy, then the companies that have benefitted most from this little investment boom will have a short shelf life at the top. Either way, I expect the index and the stocks in it will return to more normal behavior at some point and probably fairly soon. Indeed, given the current sector earnings outlook, the rest of the market may well spend the second half of this year playing catch up.
I don’t know when diversification will start to pay off again but it always has in the past and I see no reason to think it won’t in the future. In the meantime, as fiduciaries we have certain responsibilities we can’t ignore. In a sense, we have to diversify because there is no way a “prudent person” would construct a portfolio with over 20% of the assets in just 3 stocks or over 40% in one sector which is what you get with the S&P 500 today.
As I said at the top, this was a strange quarter but for old timers like me it does have a familiar feel, that “this is going to change the world” feel like we had in the late 1990s. The only problem is that I’m not sure if this is 1998 or 1999.
Environment

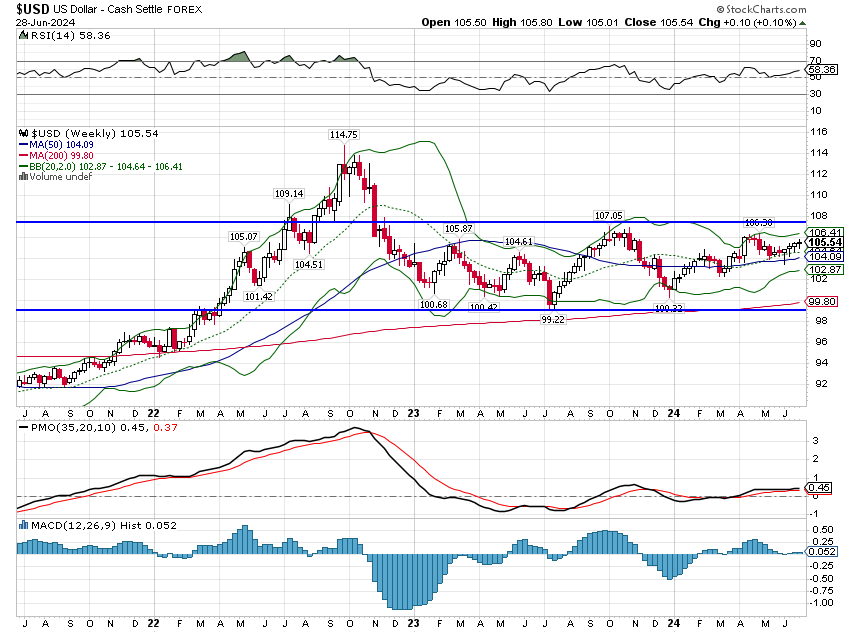
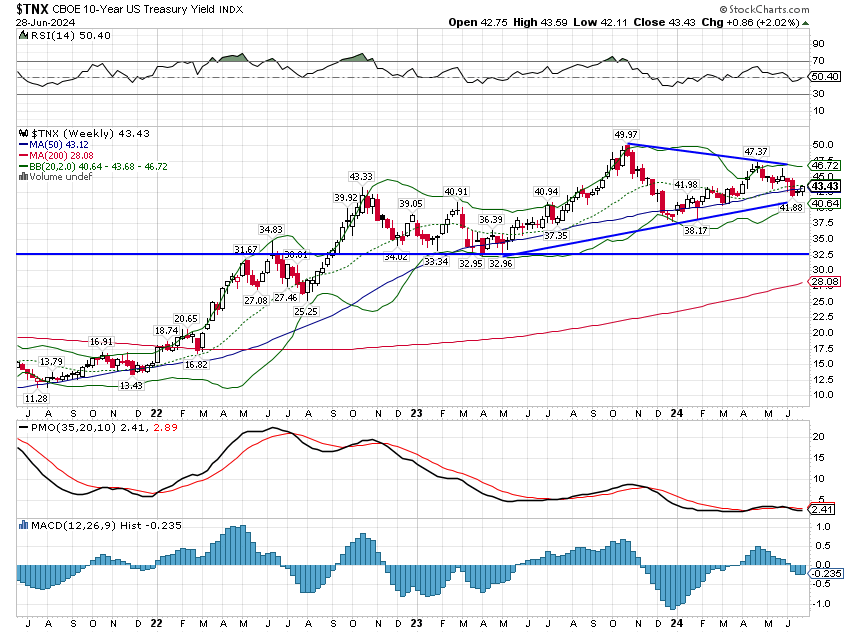
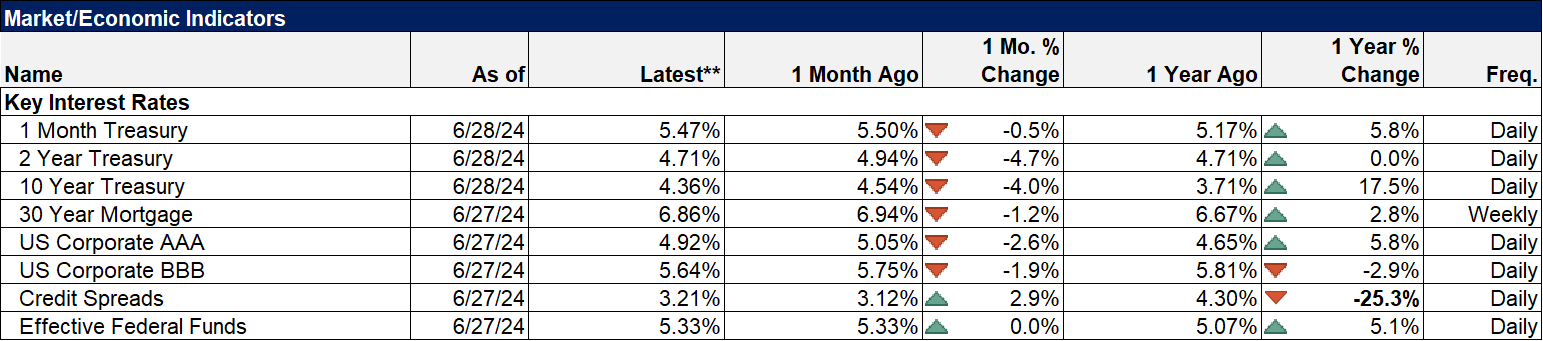
There was no change in the environment last week as the dollar rose a mere 0.1% and the 10-year Treasury yield rose 8 basis points. Both continue their march sideways that started over 18 months ago.
Markets
Last week was actually almost the opposite of the last quarter. Small cap stocks were up on the week along with REITs while the S&P 500 was flat. International stocks were also higher although by only a fraction.
Sectors
Energy stocks were the best performer of the week, up 2.4% as crude oil rose 1%.
Market/Economic Indicators
Last week’s economic reports of note:
- Chicago Fed National Activity Index – the index rose to 0.18 and the 3-month average fell to -0.09. That shows the economy growing just slightly below trend (a zero reading is trend growth).
- Case Shiller Home price index – +7.2% yoy, down from the last reading of 7.5% but above estimates of 6.9%. Housing inflation isn’t falling fast enough
- New home sales – -11.3% and a lot less than expected
- Durable goods orders – +0.1%, about as expected but ex-transportation was -0.1% less than the expected +0.2%. Even worse were core capital goods order down 0.6%. This has been an investment led expansion so that is most definitely not good news.
- Personal income – +0.5%, better than expected. Real disposable personal income (after inflation and taxes) was +0.5%
- Personal consumption – +0.2% and a little less than expected
- PCE price index – the Fed’s preferred measure of inflation was flat on the month and up 2.6% year over year, exactly as expected. Core was up 0.1% for the month and also 2.6% yoy.
One last report to note is the Chicago PMI which I have been purposely ignoring because it has been such an outlier among these purchasing manager’s surveys for quite a while and last month it fell to 35.4, a level that is on par with the COVID low of 32.9. That just doesn’t make any sense; the economy isn’t great but it’s a heck of a lot better than May of 2020. The June reading, reported last Friday, suddenly put the index at 47.4. The last time we saw a similar sized one month gain was from June to July 2020 when it rose from 37.3 to 53. The jump from May to June this year makes no more sense than its previous plunge from 55.6 last November. I will continue to monitor it because it has been useful in the past but something is haywire with this report.
Stay In Touch