By John L. Chapman, Ph.D. July 6, 2012 Washington, D.C.
The new data on the economy this week suggest continued growth – in the 1.4-2.2% per annum range. Events in Europe will continue to have an outsized effect on investor psychology in the U.S., capping the upside to growth and valuations both. And, 2nd quarter corporate profits will be telling. But the U.S. consumer and intrepid entrepreneurial class continue to amaze: there is, after all, a big difference between an economy growing at 1.5-2% and one that is contracting.
On January 12, 1969, when the American Football League champion New York Jets took the field for Super Bowl III in Miami, they were two touchdown underdogs to the 15-1 National Football League champion Baltimore Colts, who were coming off a 34-0 thrashing of the Cleveland Browns in the NFL title game. Baltimore had reeled off ten straight wins on the backs of two Hall of Fame quarterbacks, and looked invincible. To make matters more interesting, Jets quarterback Joe Namath took to the podium at a luncheon in Miami three days before the game and brashly guaranteed a win for the AFL upstart Jets, enraging Baltimore fans and loyalists of the senior league. Baltimore’s players intended to flatten Namath and the Jets, and most of the football world were certain they would.
But someone forgot to tell the Jets this, and they did not follow the script. Led by former Baltimore coach Weeb Ewbank, New York shocked the experts and won Super Bowl 16-7 in one of the NFL’s greatest upsets in its history.
We are reminded of this story in analyzing the U.S. economy at the moment. The “experts” continue to call for a double-dip recession in the U.S., based on Eurozone and China warnings, Federal Reserve pronouncements and body language, and the performance data itself, from jobs and income growth to housing to various activity indicators, all of which are mediocre at best. In spite of all the news, someone keeps forgetting to tell U.S. consumers and producers; they refuse to roll over and act according to the negative script. This week’s key economic reports were further proof of their resilience, in an economy that is not robust, and not even particularly healthy, but hardly the disaster it is portrayed as being:
(1) Institute for Supply Management (ISM) Services Index declined to 52.1 in June. The non-manufacturing sector of the U.S. economy has now grown for 30 consecutive months, with the key sub-indexes registering as follows for June: Business Activity Index at 51.7% (down from 55.6 in May), New Orders Index at 53.3% (down from 55.5), and Employment Index at 52.3% (up from 50.8 in May). The Prices Paid Index declined for the second straight month, to 48.9.
According to the ISM’s Anthony Nieves, growth was choppy in June and generally decelerated from May, although 12 of the 17 service sectors reported growth:
The 12 non-manufacturing industries reporting growth in June — listed in order — are: Educational Services; Arts, Entertainment & Recreation; Management of Companies & Support Services; Retail Trade; Utilities; Transportation & Warehousing; Accommodation & Food Services; Public Administration; Construction; Information; Finance & Insurance; and Wholesale Trade. The five industries reporting contraction in June are: Mining; Agriculture, Forestry, Fishing & Hunting; Health Care & Social Assistance; Real Estate, Rental & Leasing; and Professional, Scientific & Technical Services.
The reading for the NMI (52.1), the composite index for services, was the lowest in 2 ½ years since turning positive early in the recovery, and while the trend is not good, this data series can exhibit volatility. But again, resilient growth continues in services, with seeming “pockets” of good news in almost every report even where the headline is not strong (e.g., here, declining prices paid positively impacts service sector profits).
(2) ISM Manufacturing Index declined to 49.7% last month. The general contraction in manufacturing activity breaks down, however, in mixed fashion: “New Orders and Inventories Contracting, Production and Employment Growing, and Supplier Deliveries Faster.” The PMI was down 3.8 percentage points from May’s reading of 53.5%, indicating contraction in the manufacturing sector for the first time since July 2009; the New Orders Index was particularly hard hit, as it dropped 12.3 percentage points in June, contracting for the first time since April 2009, and more ominously, plunged by its widest margins since the September 11, 2001 terrorist attacks crippled demand dramatically.
The Employment Index was still solid, however, at 56.6%, and the Prices Index for raw materials decreased for the second month in a row, significantly this time, to 37% (down from 47.5%), good for manufacturing profits if indeed indicative of softness in materials demand (particularly in energy and commodities). Respondents to the ISM survey blamed the downtrends on “uncertainties in the economies in Europe and China.”
The ISM reported that of its 18 manufacturing industries, seven are reporting growth in June and nine are contracting. In order, from high to low growth/contraction:
Growth sectors: Furniture & Related Products; Printing & Related Support Activities; Fabricated Metal Products; Miscellaneous Manufacturing; Electrical Equipment, Appliances & Components; Machinery; and Primary Metals. The nine industries reporting contraction in June — listed in order — are: Nonmetallic Mineral Products; Apparel, Leather & Allied Products; Paper Products; Plastics & Rubber Products; Chemical Products; Computer & Electronic Products; Petroleum & Coal Products; Food, Beverage & Tobacco Products; and Transportation Equipment.
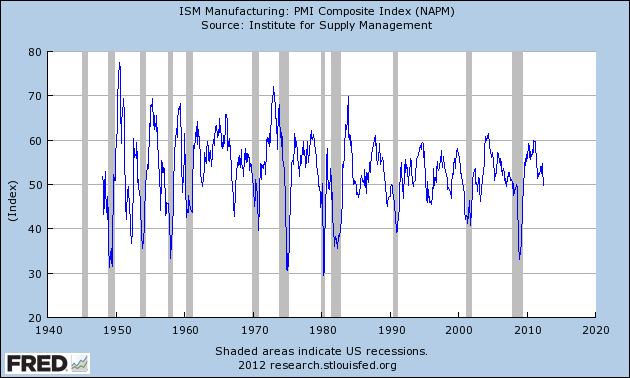
While the data surrounding the activity indices here were disappointing, and even alarming to some, it must not be forgotten how truly volatile manufacturing is. The chart below shows the ISM Manufacturing Index going back to 1948:
Chart I. ISM Manufacturing Index (1948-Present),+50 = Expansion
As is clearly seen, drops below 50% do not necessarily signal imminent recession, and even long periods of expansion can suffer sudden significant drops. We do concede however that given the general prevailing climate for the global economy as well as current policy mix, the last few months’ decline in manufacturing – and especially the fall-off in new orders – should be regarded as a warning, and watched closely. The resilience of the hypersensitive employment data for manufacturing do give us ultimate faith that growth can and will still ensue for the foreseeable future, but we will look for activity indices in positive territory again in the immediate months ahead, or grow more concerned.
(3) May 2012 Construction spending was up by +0.9%. This was a very positive sign and well ahead of consensus expectations. The May figure is up more than 7% year on year, and the first five months’ construction data for this year show growth of +9.4% over the same period in 2011. Private construction, both residential (+3.0%) and non-residential (+0.4%), led the gains in May, while government construction declined.
(4) June auto sales were up +22% year over year, to 14.1 million light-vehicle units. Auto sales rebounded sharply in June from May’s 13.7M print, and re-attained annual production throughput north of a healthy 14M vehicles. GM (+16%), Chrysler (+20%), and Ford (+7.1%) all experienced healthy sales gains in June, and the U.S. auto market is still on track to have its best full year since 2007.
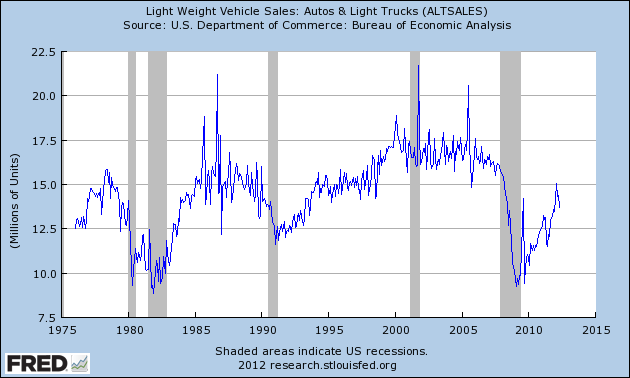
Auto production and sales, like manufacturing in general as shown above, exhibit high volatility month to month, as the following chart displays:
Chart II. U.S. Light Vehicle Auto Sales, 1976-May 2012 (June figures not included)
Since 1976, auto sales have ebbed and flowed, with good runs of several years in the 15-17M range. While volatile over short term ranges, what this data series shows is that, ex post, big drops between 1979-82, ’89-’91, and 2007-09 are associated with the onset of recession in the U.S. Our surmise is that we would need to see sustained drops back toward the 11-12M range, after having broached 15M units again in complement with demographically-driven demand that should mean sustained output in that range, to confirm a double-dip recession. The next six months will be telling on this score, but news in June was good across the sector and surprised to the upside.
(5) June Nonfarm Employment increased by +80,000, with the unemployment rate remaining unchanged at 8.2%. This is not welcome news, some 15,000 below consensus expectations, and more importantly, concludes a quarter wherein job growth averaged +75,000 new hires per month (after minor revisions), versus +226,000 per month in the first quarter.
Professional services added +47,000 jobs in June, and healthcare (+13,000) and wholesale trades (+9,000) were leading gainers. Meanwhile, manufacturing added +11,000, a weak report but the ninth month in a row of gains. The Labor Force Participation Rate remained unchanged at 63.8%, as most other industries (e.g., transportation, mining, construction, retail trades, financial, government) showed little to no change from May. Hours worked edged up 0.1 hours to 34.5 hours, and average hourly earnings for all employees on private nonfarm payrolls increased by 6 cents, to $23.50. Year on year, average hourly earnings have increased +2.0%.
Summary
These data are consistent with a slowly-growing economy, and given the rough correlation between monthly/quarterly economic data and quarterly GDP growth, it is likely that the 2nd quarter for 2012 will not greatly surpass, if at all, the first quarter’s 1.9% growth rate. The effect of this news on U.S. equities, taken in its totality, should not cause a major downdraft in and of itself – and we do not concur with the many economic prognosticators already calling for a U.S. recession as a certainty. While it is true that historically the U.S. economy oftentimes (70%) does fall into recession after multiple quarters of sub-2% growth, the experience of Europe also proves that an advanced economy can grow at a sub-2% rate for many years consecutively.
But it is hard to fathom where a great leap forward for U.S. and global equities would originate at the moment, given what is now almost-pervasive nervousness, if not outright bearishness. In our nearly 40 years of following the markets and the economy actively, we have not seen a time to compare to this “post-Bear Stearns” era of the last four years when the slightest “obscure” news from some corner of the globe moves markets in almost hair-trigger fashion (e.g., witness today’s market moves after an inference out of Helsinki that the Finnish government does not have unlimited patience for Eurozone can-kicking and meaningless reform). Not even during the hard era of stagflation (1974-82), with its 2% GDP growth, falling equities and unemployment that averaged 7.5% (after topping out at 10.8%), were investor emotions so raw.
Mr. Bernanke is watching all this closely, and like all denizens of high officialdom in Washington, D.C., he certainly has a predisposition to do something. Indeed, investor clamoring for the Fed to act may in fact precipitate policy moves after the August or September meetings. But tight money is not our problem at this point, and in any case, more quantitative easing has diminishing marginal returns attached to it, as the Fed Chairman ought to appreciate better than most. What would be helpful, in terms of moving markets and invigorating animal spirits, would be the Chairman’s channeling of one of his great heroes in the profession, Milton Friedman. Born 100 years ago this month, Mr. Friedman would have very firm opinions about needed policies to engender sustainable growth again, here and around the world. The best thing Mr. Bernanke could do at the moment – for all of us – would be to use his considerable bully pulpit to recall and even advocate for the Friedman formula, a radically different policy mix from that currently prevailing, and of which we trust our readers are well aware.
For information on Alhambra Investment Partners’ money management services and global portfolio approach to capital preservation, John Chapman can be reached at john.chapman@4kb.d43.myftpupload.com. The views expressed here are solely those of the author, and do not necessarily reflect that of colleagues at Alhambra Partners or any of its affiliates.
Click here to sign up for our free weekly e-newsletter.


Stay In Touch