The headline in the Establishment survey was quite a bit better than expected, but once again it was at odds with most of the rest of the employment report. The Household survey fell by 122,000 reported jobs, while 350,000 people left the labor force. The number of estimated persons not in the labor force rose to an all-time high of 88.8 million.
So which survey is correct and where is employment trending?
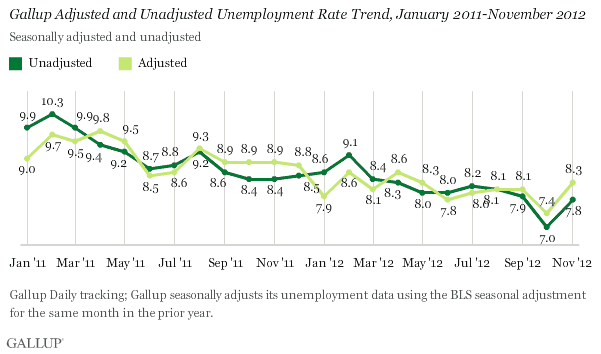
Looking at other data series, the Gallup survey of household employment seems to be in close agreement with the Household series, particularly in the past three months. The Household series saw large gains in September in October, only to be partially reversed in November (along with a lot of workers leaving the labor force). That is pretty well captured by Gallup below.
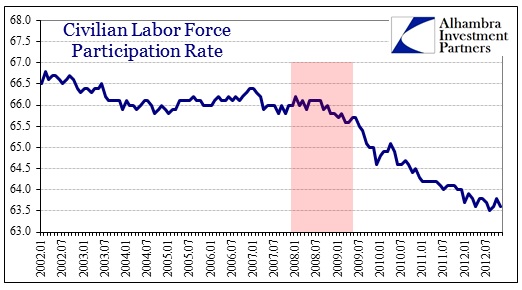
According to the Gallup poll, unemployment in November is not much different than most points during 2012. In fact, that observation closely matches the civilian labor force participation rate for all of 2012 – not much real change. November is only 0.1% off the low of the year, meaning that for all the “surge” in employment in September and October, it has largely dissipated through November.
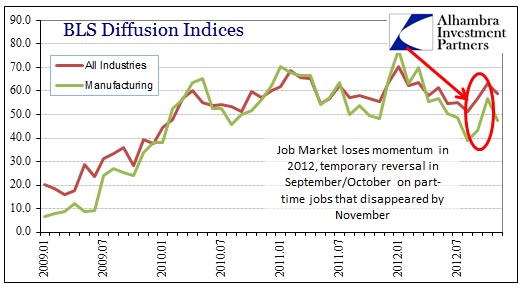
We also know from the last few employment reports that there was a dramatic increase in part-time employment (according to the adjusted figures), particularly September. From 8.031 million part-timers in August to 8.631 million in September, part-time employment has returned to 8.176 million in November.
Perhaps this explains the large decline in consumer confidence from the University of Michigan survey. There was, again, a surge in September and October, as the overall index reached a multi-year high of 82.7. The latest result has come all the way down to 74.5, the second largest one-month decline in the survey’s history. The expectations index fell from 77 to 64.6. The pattern in this data closely resemble both the Household survey from the BLS (and labor force participation), as well as the Gallup survey on employment, and makes intuitive sense in that consumer sentiment is a mostly a coincident indicator at best.
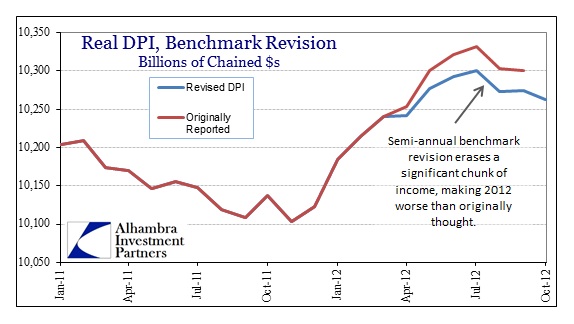
This brings us back to the Establishment survey and the amount of attention paid to the headline. Given these coincident and somewhat conflicting indications, I fully expect more downward revisions in the next report (both September and October were revised lower for the Establishment survey). The annual benchmark revision will come out with December’s report in January 2013. We have already seen downward revisions in Personal Income for the semi-annual period in a separate survey from the BEA, but a survey that uses the same ARIMA-X seasonal and cyclical adjusting factors as well as common benchmarking.
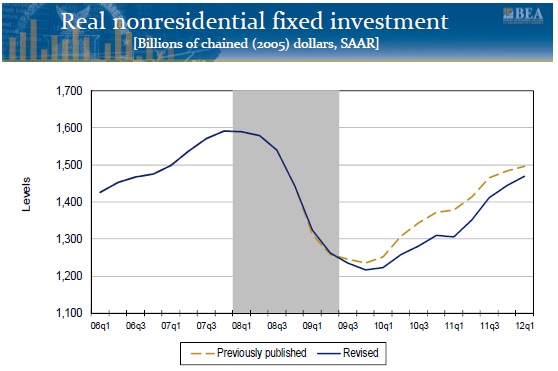
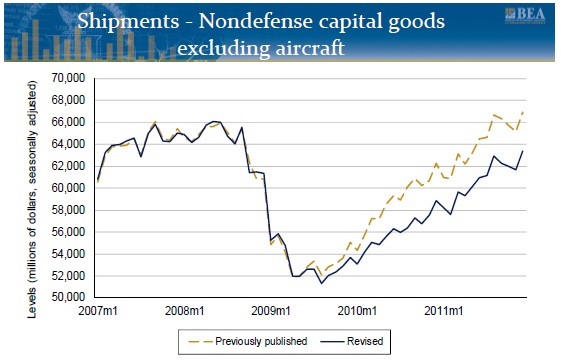
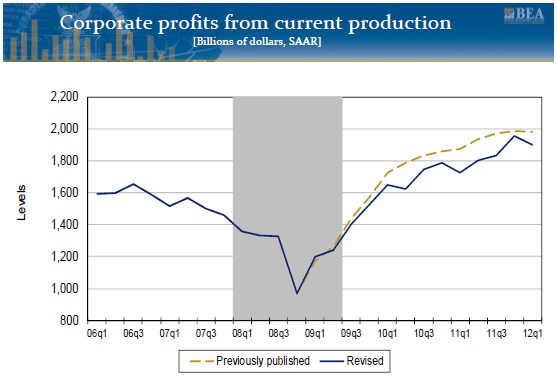
We also know that revisions, for the most part, since 2008 have had a significant negative bias meaning that statistical agencies have forecast variations in adjusted data using overly optimistic benchmarks and trends. That these revisions, particularly in business investment and profits, have all exhibited the same negative bias suggests a non-random linkage, such as misdiagnosis or forecast of a cyclical recovery. That would also suggest further revisions in like data adjustment series will continue as long as the economic trajectory underperforms – which seems to be the case in employment, regardless of the series used for analysis (146,000 headline employment growth, in the context of a more “normal” recovery trend that is expected, would be classified as underperforming, not cheered as a measure of recovery growth).
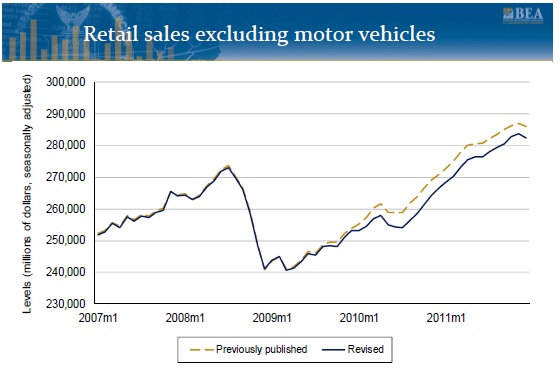
Though business investment saw the largest downward revisions, particularly capital goods, even retail sales (surprise!) were revised lower.
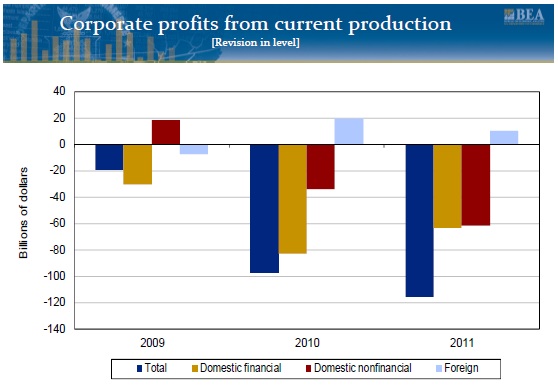
Perhaps the most meaningful revisions, particularly with regard to our understanding of the employment estimates and adjustments, corporate profits for the past three years have been overstated to quite a degree.

Stay In Touch