More data from various sources on primary economic parameters seemingly at odds. First, unemployment claims dropped to a five-year low according to the adjusted BLS data series. At the opposite end, Gallup’s measure of employment fell, suggesting to Gallup that employment has gotten worse in January 2013. Since Gallup’s numbers are not adjusted, it, rightfully, compares results with January 2012 to find reduced full-time employment. The scale of the decline is not insignificant.
These two series do not necessarily contradict each other, but together might form a more representative picture of the employment situation than each would have on their own. The Gallup series measures “full-time” employment while the BLS is counting essentially new layoffs. There should be an overlap between those two numbers – when someone is laid off that would also count as one less full-time job. However, in this new dysfunctional economy we might be seeing fewer layoffs but also fewer full-time positions. Companies might, at the exact same time, be cutting back not through reduced head count, but through transitioning their labor marginally down to part-time.
Such a process would produce these sets of disparate results where the number of full-time employees falls, but does not impact initial jobless claims. There is corroborative evidence for this in the BLS Household survey of employment and the lack of disposable personal income growth.
One other note: there is something increasingly askew when organizations are using their lack of seasonal adjustments as justification for higher quality data. In its press release for the above, Gallup notes that:
“Gallup’s P2P rate has an advantage over the government’s unemployment measure in that it is not affected by estimates of the size of the labor force or various seasonal adjustments.” [emphasis added]
The potential lack of statistical integrity in the seasonally adjusted data is gaining traction as an economic measurement problem. Part of the reason, as we have noted on previous occasions for some time, is that seasonal adjustments are not simply “seasonal”. These adjustments include all manner of statistical assumptions, including something called “trend cycle analysis”. For a fuller explanation, see my post here.
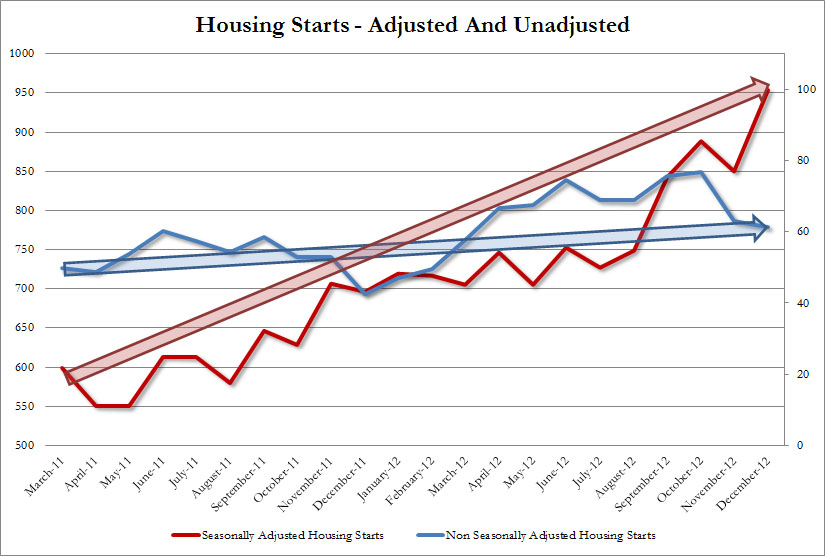
A further example of the growing tension between adjusted and non-adjusted data, look no further than housing starts:
The trend is clearly higher as housing activity has rebounded somewhat from the nearly five year slump, but the degree is significantly exaggerated in the adjusted series. Without access to the raw data, it is impossible to pull apart exactly where and why such a difference not only exists, but persists.


Stay In Touch