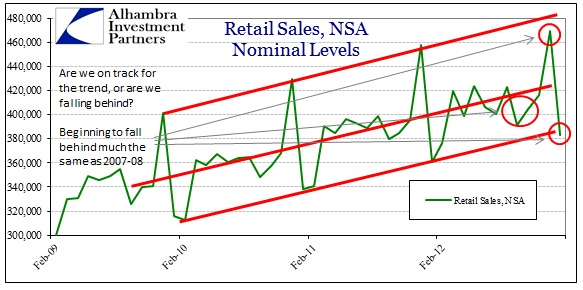
Year over year retail sales in January were the best in a few months, but on an adjusted basis were rather lackluster. Again, I don’t find the pursuit of month-to-month precision illuminating and it has clearly caused disconnects between adjusted and unadjusted data (I know, a recurring theme). The adjustment factor (the divisor) for January 2013 was 0.92, while the factor for January 2012 was 0.902. That may seem like a small difference, but in the course of the overall retail sales adjustments it means the Census Bureau is attributing about $10 billion, or almost 3%, to calendar and other factors in favor of January 2013.
Rather than get caught up again in the appropriateness of adjustment factors we should stick to the trends. We now have the full unadjusted estimates for December (the set released in January for December 2012 was the advance estimate) so we can put December in the full context of the 2012 trend.
In the unadjusted data, January 2013 was an improvement, but not really inconsistent with the overall trend established in early 2012.
We can see the same January effect in 2008 and 2007 (less pronounced).
What we can see clearly is that the full year 2012 broke away from the trend established in 2009, running through 2011. Disregarding the seasonal and other adjustments, it is pretty clear that the first half of 2012 was mildly out of trend, but the second half fell further behind.
In the all-important back-to-school and Christmas shopping seasons, the growth in retails sales was by far the weakest in the “recovery” period.
Because the trend was “broken” in 2012, meaning the overall series fell further behind cumulatively, even the positive January 2013 year-over-year is not enough to get back into the previous established trend. That means, on the whole, retail sales are moving in the wrong direction. This was something we saw in 2000 & 2007 as well.
What is most concerning is the December figure, the apex of the calendar year.
That reduced result extends into the full holiday shopping season, as November/December combined in 2012 was only 3.7% y/y, compared to 7.0% and 7.5% for November/December 2011 and 2010, respectively.
With the full range of segment data for December now included, we can get a better sense as to where and why 2012 was different than 2010/2011. The picture that emerges is really the same that we have been seeing for a year or so – the bifurcated economy. Clearly, there are segments that are doing well, even as far as appearing quite healthy. This includes automobiles, sporting and hobby goods, and outside and full service eating establishments. That tells me that those that are doing well are acting accordingly.
The flipside is everyone else. General merchandise, clothing, building materials, food and beverage stores, and appliance and electronics. The lower end of the retails sales spectrum is not just in a declining trend, in many cases there is contraction. Since these figures do not include inflation estimations, we can reasonably assume that the contraction in real terms extends to nearly all of these segments.
This analysis is consistent with the latest wage data included in the last employment report from the BLS and the GDP figures from the BEA. The inflection into 2012 is consistent with wage and savings rate data from those other series. That makes it harder to decipher exactly which way the whole mess is headed (yes, any economy that can be so positioned as to feature such stark contrasts is a mess).
The operative theory from the monetary policymaking perspective is to try to get the “good” part moving so that the “bad” part is pulled up with it. That is the essence of the “wealth effect” – those with “wealth” spend and bring the full economy along. The problem here, as we have seen in the European bifurcation (along regional lines), is that the opposite actually occurs. The “bad” part of the economy ends up sinking the “good”.
I believe that is what 2012 is showing. Income weakness and inflation pressures (commodity price, not wages) finally caught up to the “wealth effect” and are now far more imbalanced. For example, general merchandise stores have been shrinking for some time, due in part to their place in the retail/income spectrum. But they are also increasingly competing with nonstore retailers. However, if we put those two segments together, we get a more complete picture of the overall pace of consumer spending across innovation and income boundaries.
There was some harmony in the growth up until the beginning of 2012. Now, at the outset of 2013, even the fast pace of nonstore spending cannot keep up with shrinking fortunes in general merchandise. Even if merchandise stores are simply losing market share to nonstore retailers, it is not enough of an innovation change in the aggregate to indicate anything other than an exhausting consumer from the bottom up.
Without a massive change in the labor/income markets, there is no reason to expect an inflection back toward the 2010-2011 recovery channel. In fact, now that QE’s and global competition for energy, are moving energy prices back to the forefront of commodity inflation, real incomes are likely to be challenged further. Maybe the seasonal adjustments were right this time, but regardless the downward trends remain. An economy that is split in such a manner will not remain so for too long.


Stay In Touch