
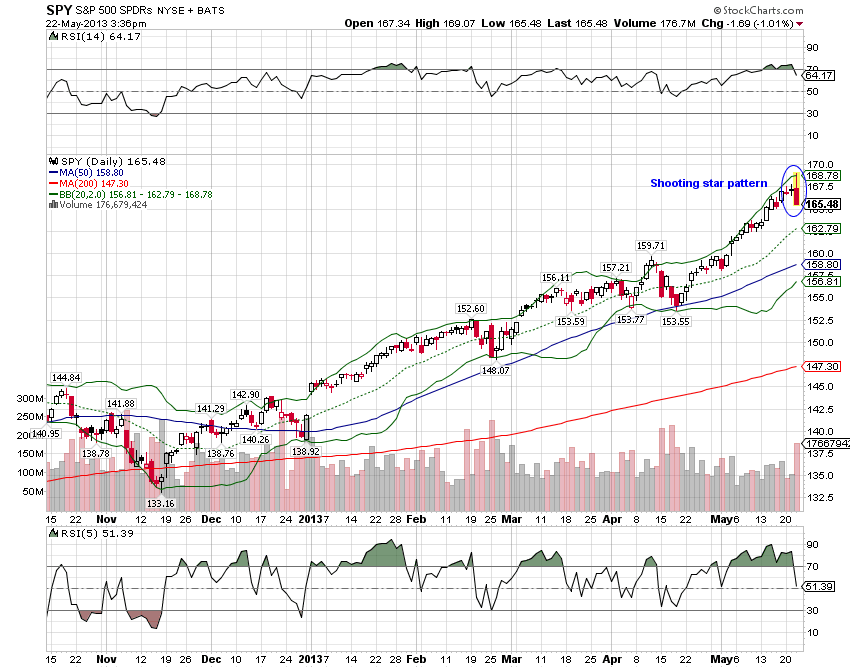
If we close on or near the low today, we will have printed what is known in candlestick charting as shooting star. I don’t put a lot of faith in technical analysis but this pattern and its reverse, called a hammer, are the most predictive technical patterns I’ve seen in my long career. The shooting stars and hammers are indications of the exhaustion of an existing trend (bull in the case of a shooting star and bear in the case of the hammer). The basic pattern for the shooting star is an intraday spike higher followed by a close on or near the low. A close below the open (where we are right now) is considered even more bearish. The hammer is the reverse; a spike lower followed by a close at the high of the day. In short a shooting star is an indication the buyer’s urgency has been sated and a hammer is the reverse. These patterns are often followed by a test of the intraday high (shooting star) or low (hammer) that fails.
Two other bearish articles I read today. First is a report from Morgan Stanley that their long/short hedge fund clients have been on a 20 day short covering spree (see here). Second is a report that hedge funds have been loading up on OTC SPX calls (see here). That report prompted me to take a look at mirror image puts and calls in SPY today. With the ETF exactly at 166, puts and calls equally out of the money showed the calls more expensive than the puts. That is a very unusual situation as puts are generally in greater demand for hedging purposes. Note: I don’t have the original source material for either of these articles so I don’t take them as gospel. But if they are true they both confirm my feeling that sentiment is overwhelmingly bullish right now.
I don’t know if this will mark the top of this incredible move, but we are getting numerous warning signs and now we have one of the most bearish technical indicators flashing red. We’ll be watching for confirmation over the next few days.
Stay In Touch