
The best ISM Manufacturing PMI since the middle of 2011 seems to indicate better economic conditions in the middle of 2013, particularly when compared to the first few months. However, the ISM has been in the up and down pattern since the middle of last year, notably rising to 54.2 in February 2013 before collapsing again.

The February number caused the same kind of optimism that we see with today’s release, including the nascent relationship of these kinds of numbers with monetary tapering. While the August figure is somewhat above February, both of these peaks in the volatile movement of the series represent the mini-cycle in supply chain inventories. There is a rather close relationship (inverse) between production and customer inventories.

In terms of production, manufacturers only care about selling to the next link in the supply chain, and only are indirectly influenced by that next link’s ability to move goods along. Viewing the entire supply chain in this manner, using the Census Bureau data, shows the rough outlines of the inventory mini-cycles that are being picked up by coincident indications like the ISM.


After the massive inventory declines in 2009 (one of the most direct channels of the panic-driven credit problems flowing into the real economy) manufacturers have been reluctant to hold much inventory. That means changes in marginal demand are being driven by the propensity of wholesalers and retailers to hold inventory.
Since April-May 2012, the inventory-sales mixture inverted in both wholesale and retail, meaning those upper levels of the supply chain were unable to sell goods at the same rate they were ordering new goods from below. This was most obvious in the retail channel, where inventories continued to accumulate until the end of 2012 despite a rather stark decline in sales activity.
Since that time, businesses throughout have been trying to address inventory mismatches by adjusting production levels commensurate with actual sales levels.

The result is an up and down in production levels as changes in supply chain inventory flows through in this adjustment process. So what gets picked up as a peak in the ISM is not a robust period in economic activity, but rather the production/manufacturing level of the supply chain recognizing relative changes in inventory perceptions from up the supply chain. Where the ISM shows an upward bias, relative inventory levels are falling.
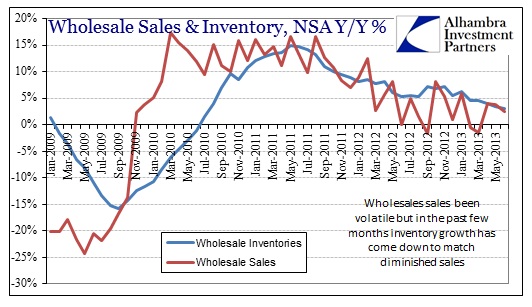
This is particularly clear in the most recent move in the ISM to above 55. In the chart directly above we see a significant downward move in the inventory-sales ratio at the wholesale level, meaning wholesalers have been marginally successful at reducing inventory (rather than increasing sales, as seen in the sales charts further up the post), and thus need/want to increase purchases of goods from manufacturers relative to this new inventory situation.
The real problem in interpreting the 55+ from the ISM as anything other than the inventory mini-cycle is the sales levels shown above. There has been a clear slowdown across the economic supply system in the wider economy beyond these narrowly construed sentiment reports. In other words, all the ISM has captured is the relative changes in short-term perceptions of producers related to positive growth in a composite of indications, containing no further information about absolute levels of supply. The ISM figure only tells about the short-term volatility in the month-to-month changes and nothing about the trend on which the volatility pivots.
Unfortunately, absolute levels, as we see from the sales charts, are still moving in the wrong direction. That broader trend is being driven by income distributions which look even worse.
Click here to sign up for our free weekly e-newsletter.
“Wealth preservation and accumulation through thoughtful investing.”
For information on Alhambra Investment Partners’ money management services and global portfolio approach to capital preservation, contact us at: jhudak@4kb.d43.myftpupload.com
Stay In Touch