
The JOLTS survey this week showed pretty much the same bleak employment environment as we have seen throughout 2013. On a seasonally adjusted basis, the rate of new job openings declined significantly from July (-180k), and now stands at a level first reached in March 2012. If job openings are at all indicative of corporate labor appetite, then there really hasn’t been much growth in the past eighteen months. That would be consistent with other indications of economic activity.
The same is true for the rate of new hires: August’s number of 4.49 million was first reached in February 2012. So by any reasonable standard, there has been little increase in employment activity since early last year.
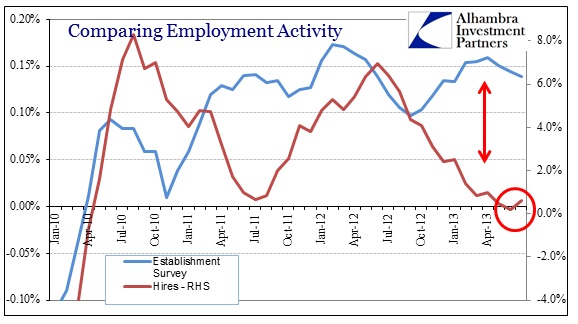
Here again we have an employment indication at odds with the preferred mainstream measure. While it may be tempting to temper any negative analysis by pointing out that at least the rate is not contracting, that misses the larger issue at work here. Not only is the population advancing, we are still an order of magnitude below the previous “cycle” peak in terms of employment activity.
From time to time you will hear an economist allude to the 3.6 million job openings or the 4.5 million people hired in a particular month as “evidence” of economic sufficiency, but the context in which these numbers belong argues the exact opposite.

There should be, given the rate seen in the middle of the last decade, more like 6 million new hires each month. If we actually had a minimally functioning economy (pre-bubbles and monetary interference) the rate of hire activity would likely be closer to 7 million and producing actual labor shortages.
This is a structural deficiency not just in the labor market, but on the demand side of the labor market. That is an important distinction because the demand for labor is the primary driver of economic transmission. This ongoing weakness is really a testament to the business outlook on economic progress. Just like the Japanese refuse to see “improvement” in the official figures, American businesses have largely abstained from this “recovery”, meaning they view it as anything other than a recovery.
The lack of true recovery has been the primary factor in transforming the labor force, which skews not only the orthodox view of the economy, including how we measure the recovery, but also the actual labor supply.
Competing viewpoints have attempted to explain the labor supply issue in either cyclical or “trend” terms, where trend refers to non-economic factors such as the first waves of retiring Baby Boomers. A study from the Federal Reserve Bank of Boston purports to do just that. They note that the BLS, the keepers of the Establishment Survey’s adjustments, now view the labor force participation issue as almost exclusively a “trend” factor. That was actually a change from their 2007 estimations, meaning that somewhere in the past five years their models have imputed trend factors where they did not previously exist (after badly estimating cyclical and behavior factors).
The Boston Fed study reaches largely the same conclusion in different terms. The authors believe that any structural or trend changes have been fully accounted for and thus any improvement in the labor force in 2013 is entirely cyclical (and likely due to monetary policy). They write, “going forward the unemployment rate should convey an accurate signal of labor market conditions from a cyclical perspective.”
The basis for that statement is given by their Figure 5.

We know that the labor force participation rate has fallen further in 2013, but according to their results that is due entirely to trend – meaning the denominator-driven improvement in the unemployment is believed to be actual improvement. But that cannot account for the simple lack of labor demand. If we take labor demand in 2013 as being cyclical, then the lack of progress on the demand side would be leading to at least a partially cyclical explanation of the decline in labor force participation. That would be true even using the Establishment Survey as a measure of labor demand, since 175,000 – 200,000 per month growth is consistent with only tepid economic movement. Lackluster economic growth would lead to a higher incidence of cyclically-driven labor force dropout. By their own terms, labor force participation in the rest of 2013 has to be at least partially cyclical, and thus a negative commentary on the employment market.
While it is somewhat humorous to turn their own study against their position, the fact still remains there is no explanation for labor force trends that ends up with a positive labor market. In reading through the study it becomes increasingly clear it was designed to yield a positive result, as the authors acknowledge as much in their concluding remarks.
“These conclusions, however, need to be tempered by the fact that our analysis represents just one possible approach to estimating trend and cycle for the labor force participation rate. In addition, our empirical exercise is reduced-form and statistical in nature and therefore lacks the structure to frame the economic decision of whether to participate (or not) in the labor force. As such, the results of our analysis should be taken with caution.”
I have no doubt that the Boomer retirement trend is playing a role here, but that does not explain data such as the structural changes in labor demand, nor does it explain why workers in their prime earning years have suddenly become especially susceptible to “trend” factors.

The participation rate among the 25-54 age cohort is clearly a function of “cyclical” factors (at least as orthodox economics would understand it). Outside of an outlier in September 2012, there has been absolutely no improvement, just continued deterioration dating back precisely to the worst of the Great Recession. Even if we are to assign the Boomer retirement explanation as a cause (and it is possible younger Boomers are taking early retirement) the fact that it coincides with the onset of collapse and the lack of true recovery that followed points to that “trend” factor having “cyclical” origins.
Further, the declining incidence of long-term unemployed is significant. Since reaching a peak of 6.7 million in April 2010, a number far above any precedent, the level has dropped by 2.4 million (through August). But that is not a cyclical improvement at all, as, by definition, any of these workers who persist in unemployment beyond 52 weeks simply falls out of the official labor force (and thus they are no longer technically “unemployed”). Over the same period, the number of potential workers “not in the labor force” has grown by an astounding 7.7 million, meaning that the long-term unemployed are still long-term unemployed in the real world.
Lack of growth does not equate with recovery or economic health. Given that the inability to find work is driving so many out of the official labor force, a factor that demands to be accounted for somewhere, and that labor demand is the primary causal factor in labor supply, I think we would be in a much safer and more robust position by claiming a clear lack of economic progress – meaning monetary policy has been either impotent or itself destructive. I would even go further and make the assertion that any minimal progress has already begun to reverse, even under terms most favorable to the opposite position.
Click here to sign up for our free weekly e-newsletter.
“Wealth preservation and accumulation through thoughtful investing.”
For information on Alhambra Investment Partners’ money management services and global portfolio approach to capital preservation, contact us at: jhudak@4kb.d43.myftpupload.com
Stay In Touch