
I have not yet commented on the huge revisions in corporate debt to this point (the revisions were released on September 18 with the regular update to the Z1 Financial Accounts of the United States, formerly Flow of Funds) because there was so very little information surrounding the changes. I had hoped by now somebody somewhere with a better perspective would have commented and clarified, even if only partially, why $2.4 trillion in corporate debt disappeared.
Before describing the nature of the latest revisions, it should be emphasized that this kind of rethinking is not unique and does happen from time to time. In 2011, for example, the Flow of Funds calculations changed the manner in which they tracked municipal debt, suddenly “finding” $740 billion that was previously uncounted. In that instance, however, they offered a reasonable justification:
The instrument tables on municipal securities and loans (tables F.211 and L.211) have been revised from 2004:Q1 forward to reflect a change in data sources. Data on debt outstanding and net issuance for state and local governments, nonprofit organizations, and nonfinancial corporate business (industrial revenue bonds) are now based on data from Mergent, a private data vendor. The new data indicate that municipal securities and loans outstanding in 2004:Q1 is $740 billion greater than previously estimated in the flow of funds accounts. The estimate of household holdings of municipal securities and loans is revised up by about $840 billion, on average, from 2004 forward.
With the way the Z1 is calculated, the Household Sector takes on a sort of plug variable to absorb any changes that cannot otherwise be classified elsewhere (including the myriad “other” and “miscellaneous” line items). That makes some sense given that households don’t report their “balance sheet” in any fashion, so it is where the most mystery, and thus most flexibility, resides. The net result was a discontinuity starting in 2004 where Households were believed to own three quarters of a trillion more in muni bonds, as the other side indicated that municipal and state governments owed roughly the same amount in increase.

That being said, the change in nonfinancial business debt (almost all of it at the corporate level) is of a different variety – which raises some separate issues. First of all, the differing calculations purportedly arise out of a mechanical change (which immediately draws to mind how the CPI has been whittled down), rather than solely the logical course of shifting data providers. All the Federal Reserve, the providers and statisticians taking care of Z1, has to say on the topic is:
Net issuance of corporate bonds (tables F.102, F.212, L.102, L.212, and B.102) by the nonfinancial corporate business sector has been revised from 1995:Q2 forward to reflect new methodology and data sources. The amounts outstanding are calculated using a perpetual inventory method.
Two and a half trillion dollars disappears because of the “perpetual inventory method?” They do not, unlike the muni shift only three years prior, mention the nature of the new data sources or at what juncture the changes became so apparently needed. All that is indicated are revisions have been made going back to the middle of 1995.

As you can see, however, the vast majority of the effects of the revised “methodology” don’t take place until the “recovery” period more recently.
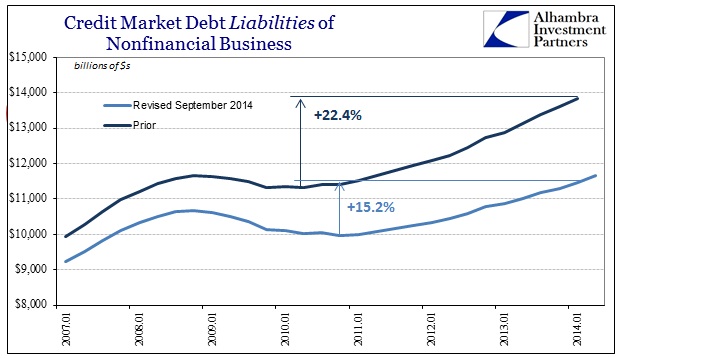
Nearly all of it is tied to corporate debt, meaning, most likely, corporate bonds. That makes sense at least in that smaller businesses have largely been absent from the debt euphoria (which may now only be exuberance).


From that point you start to look backward into the double posting system. For every liability there is an asset, meaning if US corporations have issued $2.4 trillion fewer bonds than previously thought, somebody somewhere owns $2.4 trillion less too. So on the asset side, the revisions come out in two places:


About $1.6 trillion was reduced in household holdings, with the balance coming away from Funding Corporations (these are non-bank financial firms like GE Capital and Ford Finance). In terms of households, as we know from the muni episode, that is as much a reduction via plugline. In other words, the Fed could not really classify on the asset side who might own fewer corporate bonds that supposedly no longer exist, so they simply subtracted from the end – households.
But what is really interesting is that not all of the revision came out of the household line; if it had the household sector would have been left with nearly zero in corporate debt holdings which would have made very little sense. As it is, they took the level down below $1 trillion, but the full weight of the revision there would have meant going from $2.6 trillion down to just $200 billion. Instead, some of that was “shifted” to what looks like another plug factor that really shouldn’t be one.
That intuition is made all the more confounding since the Fed’s statisticians did much the same process on a smaller scale within the Funding Corporation classification too. Total assets were revised in Q1 from just over $2 trillion down to just $1.3 trillion. Because assets were written lower, liabilities had to be adjusted too, so they used the classification “Miscellaneous liabilities” and the line item “other (net)” to jump lower from +$746 billion to -$125.5 billion. In other words, they shifted an item that nobody knows anything about from a positive liability to a negative liability so that they could fit about $820 billion in the corporate bond borrowing revision.
This is, again, curious in that the change to Funding Corps was huge and it isn’t like there is very little information on them. Most of them have well-established financial reporting which flows into this very Z1 accumulation, so I doubt that somebody just now noticed that they had been overstating Funding Companies assets and liabilities by just shy of $1 trillion. But it is the “other” liability classification within Miscellaneous liabilities that fully indicates this backward approach (top-down rather than bottom-up).
For Households, the change is not neutral either. There is a reduction in net worth of about $1.7 trillion: total credit market assets decline from $5.3 trillion to $3.6 trillion, reducing total financial assets from $67.2 trillion to $65.7 trillion, and thus net worth goes from $81.8 trillion to $80.1 trillion. Since it is a drop in the bucket, nobody really misses it (apparently).
You can start to see why some people slip so easily into the conspiratorial, as “they” offer so little information about what is a huge change in at least perception; especially as corporate debt is one of the primary places whereby QE-financialism has been most evident. There might be a vested interest in “making” the corporate sector appear much less imbalanced toward impoverishment of this type, especially since junk debt is encompassed in this very calculation (though the former Flow of Funds does not give us a breakout of which is high-yield and which is investment grade).
However, I think the reality is much simpler and less nefarious. The clue is provided by the revised position of the “recovery” in corporate borrowing, shifting the trough from the end of 2009 to the end of 2010 (from under QE1 to under QE2).
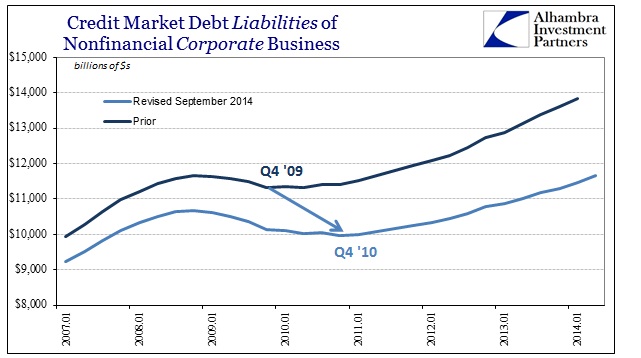
If you recall July’s massive revisions to GDP and its subcomponents, much the same happened there. The “recovery” was vastly overstated according to the new revisions, and so it appears the same in corporate debt (assuming the methodology in both revisions is sound, of which I am unconvinced). So what we are looking at is probably not an attempt to readjust the direct impact of QE on corporate debt expansion, but rather another indication, and a good one, that these economic and financial estimates are poorly suited to the reality of the post-2007 economy.
The fact that the systems that govern these calculations were created and “validated” prior to the Great Recession only means they are mis-calibrated to the current circumstances. In that situation it is not at all unexpected to see such wild and massive swings in what we thought we knew. GDP “disappeared” largely from 2010 and 2011, which suggests backing that into corporate debt allocations around the same time. Therefore the problem in all of these accounts is, for me until I see a compelling explanation for all of this, universal.
As of now, the economy and debt we thought existed then never did, and so it might be true of a lot of other indications that we see right now (especially since these revisions all go in the same “wrong” direction). Corroboration in accounts outside of these statistical regressions is much more necessary now than ever, which further calls into question anything that stays as an outlier.
Stay In Touch