
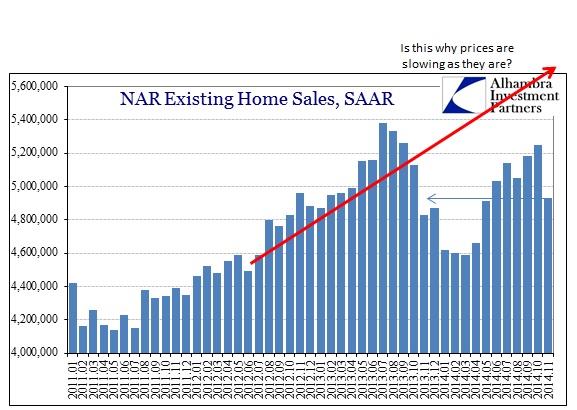
The S&P/Case-Shiller 20-city home price index declined for the second month in a row in October, matching indications elsewhere that the slight rebound from the depths of last winter may be over. The Y/Y growth rate was the lowest since October 2012 as clearly price momentum has been lost.

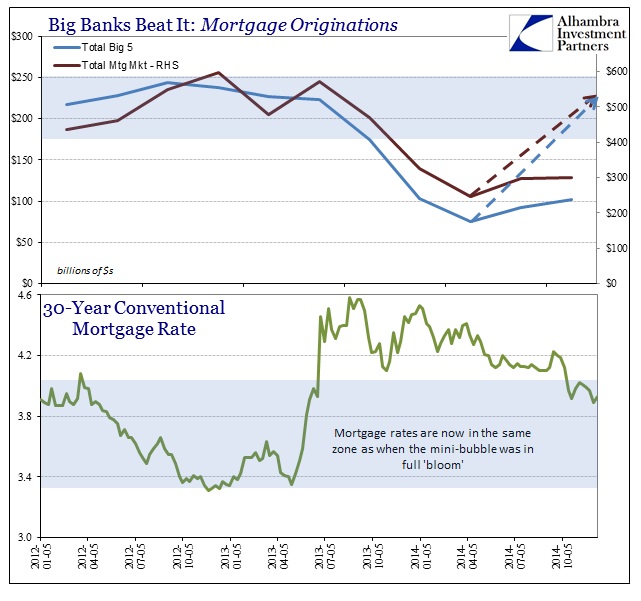
The upward movement in the index this year is by far the smallest of the irregular trends that have been apparent throughout this mini-bubble restoration project. That would be consistent with the indications from bank credit, as clearly there has been a complete shift in financial allocations to mortgage and housing credit at the same time 2012-13 price appreciation made the institutional trend untenable in terms of profitability. That doesn’t give the housing market much to regain support.

That should not have been the case if the dominant economic narrative was broadly valid, as a booming economy with all sorts of new job growth would provide a much sturdier and grounded base for housing to sustain itself. Couple that with mortgage rates still falling from last year’s reset, and the housing results across resales and construction are perplexing.
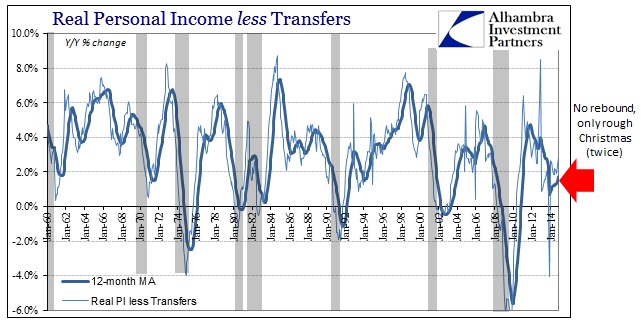
Unfortunately, this economic “boom” that were experiencing seems as hollow as everything else that has come before, which would be far more consistent with the dying vestiges of the housing mini-bubble. As usual with most true economic factors, this all gets back to income and the continued lack of it.
As Bob Shiller himself noted of October’s figures, the housing market appears highly unstable. Again, that is only coherent with an economy undergoing attrition and outside of credit bubbling rather than what is being talked about.
Stay In Touch