
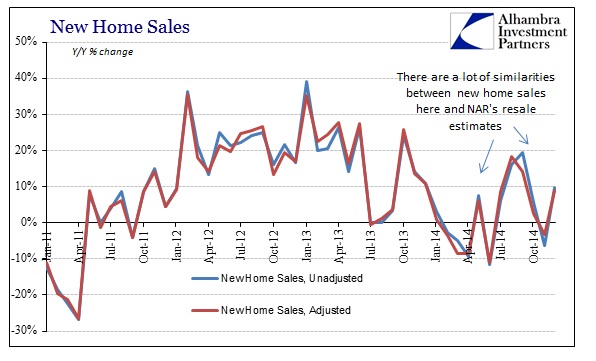
The level of new home sales seemed to take another run at the 500k seasonally-adjusted annual rate in December. This would be the third time in 2014 that the pace of sales reached a new high point for this cycle, but the prior two were subsequently revised much lower. In fact, revisions have made it very difficult to find much of interest in the data, eschewing wholly the monthly figures.

The original estimates for August and May were 504k SAAR, downgraded quite significantly to 448k and 458k, respectively. The month of October saw the preliminary estimate of 458k, revised downward to 445k only to be re-revised with the latest refiguring at about the same as where it started, 462k. The difficulty in coming up with a stable estimate is something that is itself suggestive of difficulties in the current real estate market (as is clear in the chart above, especially when compared to the very low volatility during the 2011-2013 mini-bubble).
In terms of yearly growth, there isn’t anything outrageous about December’s advance, whether or not it survives any further rethinking, as it is mainly in-line with the current volatile pattern.
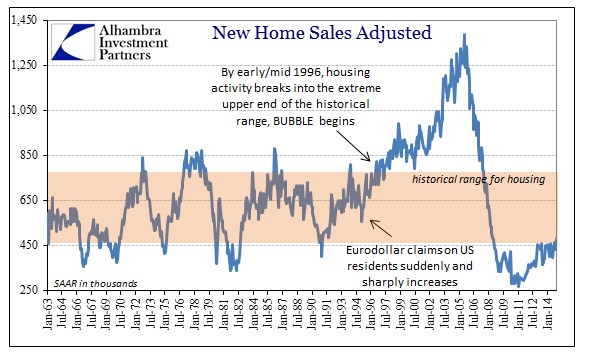
It is believed that there were 34k new homes sold (not-adjusted rate) in December 2014 compared to 31k the year before. So the growth rate looks impressive only in isolation. In fact, the overall context of new home sales makes all this nothing more than splitting hairs about a “market” that has clearly stalled after never coming close to regaining more consistent levels of activity. And it took a mini-bubble and a couple of QE’s just to do that!
The view of prices from the Census Bureau is a bit different from others (see below), as the calculated median price almost hit $300k on a continuous upward tendency. Since these are new builds and are running at a volume far below what occurred during the main bubble last decade (for context, December 2005’s pace of new home sales was almost three times the current figure at 87k) the potential for the price to be skewed by higher-end homes is evident. In other words, people without good income and good credit, which amounts to a vast majority in 2014 despite all protestations otherwise, are conspicuously absent from this part of the real estate market. That would offer a compelling explanation for not just prices but the distinctly low level of volume.
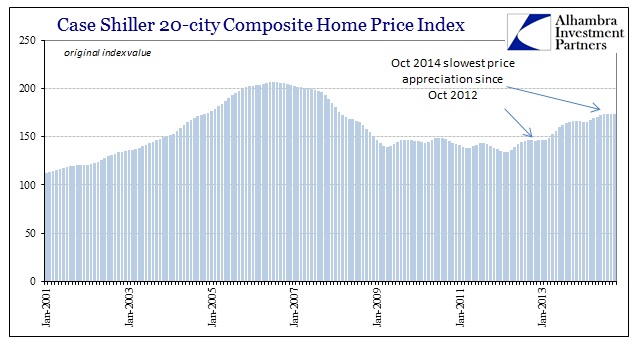
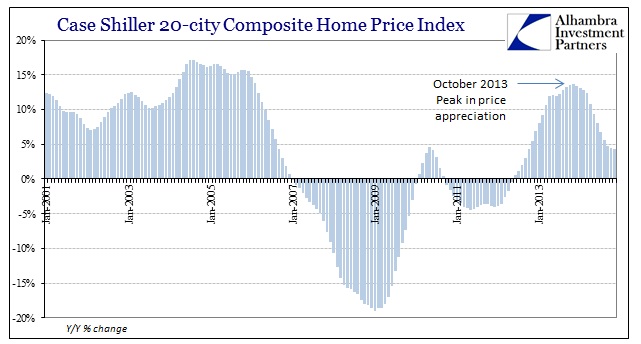
The broader view of home price advancement, including the Case-Shiller indices, continues to see a decline in the rate of growth (second derivative). November’s figure was the third consecutive month-over-month decline, and the slowest year-over-year advance since October 2012.
The inability of new home sales to even break into what used to be historically low levels suggests, like apartment construction, the same kind of inequality in the economy that has plagued it from the very start of the “recovery.” Without wages, none of this will go anywhere, and will be nothing like the economic “tailwind” that was forecast especially when QE3 was announced and implemented. The wider real estate “market” again confirms the dour view of the economy, and like the broader system is in a very precarious position. Should sentiment decline even among the upper tiers (in terms of income and paper wealth) there is nothing left to hold all this up.
In that respect, it’s almost amazing that it got this far, but that feeling is greatly surpassed by suspicions about how such another imbalance might again get resolved in era persistently absent of actual economic growth.
Stay In Touch