
The primary challenge of trying to unravel wholesale finance is the innumerable and often impenetrable layers. Making important distinctions is quite tricky, as you have to account for additional dimensions above and beyond what might pass for reasonable expectations. The repo market offers a good example of that, as you have supply and demand for cash “helping” set the repo rate, but that is only one rate (GC) and can be varied by actual securities and the degree to which they are rehypothecated. So you end up with demand and supply of cash balanced against demand and supply of collateral balanced altogether by at least volume – if not including some aspect of bank balance sheet risk absorption supply and demand.
And that is only one section of the “money supply” as it exists globally that we can see. It is rather nice when these layers “agree” or harmonize, but nothing really should be expected to be so straightforward. Part of that relates to yet another dimension that has to be factored: time. The layered effects mean not only immeasurable complexity of interrelation but also that it may take time for something that occurs in one layer to move out and significantly affect or alter the next (or next few). These ripples take time to align and amplify each other, or dis-align and cancel each other out.
My sense is that we are in one of these temporal distortion dimensions currently, as there is a decided heterogeneous take on the “dollar” of late. In that respect, it may be best to construct a partial catalogue of some of these “layers.”
A good place to start is closer to the end, or at least where the “dollar” is more visible in its ballistic alterations – oil prices in this case. The fundamental state of crude oil in America, as the world, hasn’t much changed, if at all, recently. If anything, physical supplies of crude have continued to build at a rate not within anyone’s actual experience. The weekly release from the US EIA about crude stocks now habitually contains the phrase, “highest level for this time of year in at least the last 80 years.”

The last update saw the largest single-week gain since March 2001 when the dot-com recession was just getting underway. And there have been at least four of such weeks crowded within this most recent build. The price of WTI has instead been very much more buoyant of late, which might suggest to some that this “market” is pricing better future growth prospects just as it anticipated months ahead of time this physical clearing disruption.
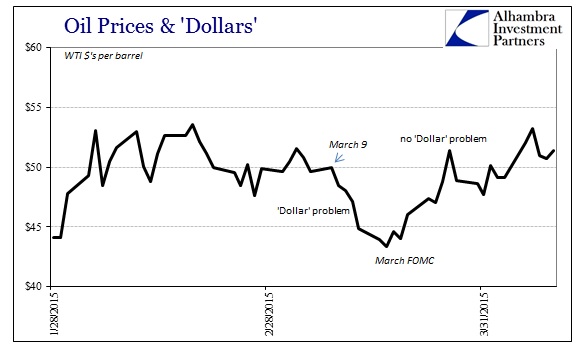
That is certainly possible, but I think any such interpretation ignores the sheer scale of the imbalance here. We have seen nothing like this in generations, to which the “clearing” price here might not be intended at all toward longer run clearing – at least not yet.
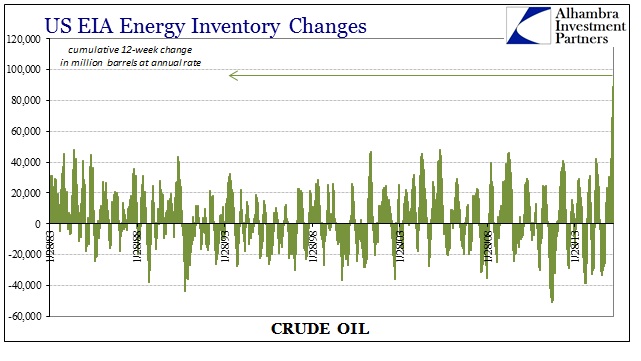
The cumulative 12-week total is more than double any of the closest comparable periods going back to the inception of the weekly series in the early 1980’s; that passes well-above the Great Recession, the dot-com recession, the Asian flu, etc. With no letup in the physical imbalance, it seems reasonable to interpret price changes as moving almost exclusively with the “dollar” (one-day trading with Wednesday’s release of the near-record build notwithstanding). I think that view is strengthened by what has happened along the futures curve for WTI.

The longer end has flattened significantly since that “low” point early in trading on March 18, just prior to the FOMC statement that apparently opened a domestic version of a relief valve. The front end floating with whatever the “dollar” is doing leaves the back end with the increasingly difficult task, so it would seem, of eventually disposing of all the black stuff. Especially in relation to early February, it is getting more difficult to sell futures to take eventual delivery even on what might get stored and contagoed – which offers not just a very weakened suggestion on the state of future economic perceptions but one that is still being written down as I write.
There seems to be a bit of a parallel trend in UST trading, especially as it relates to the 5-year “pivot.” The yield curve throughout had gone totally and conspicuously silent for just about three whole months before last week finally breaking that hardbound range – at least where the 5s were involved.
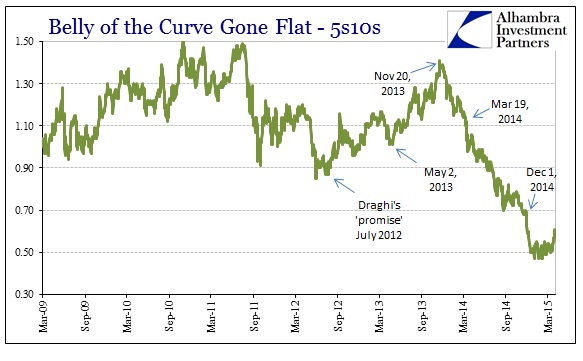
With the 5-year positioned pretty close to numerous financial benchmarks (particularly the “sweet spot” between 5-years and 7-years where a lot of “finance” gets done) this move stands out for largely the same interpretations as with the “flexing” WTI curve. This is particularly true when in comparison with the 10-year UST, which has been less prone to any “dollar” relenting so far – and more of an economic-type benchmark than the 5’s closer ties to finance (which includes monetary policy).
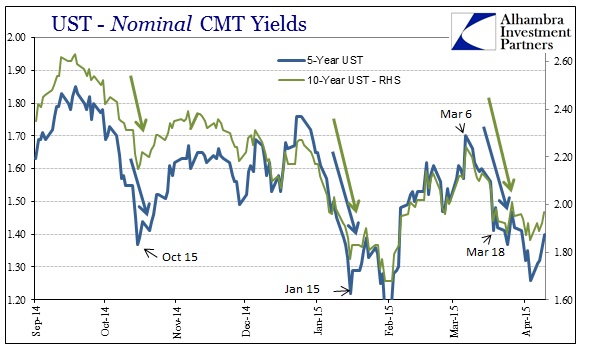
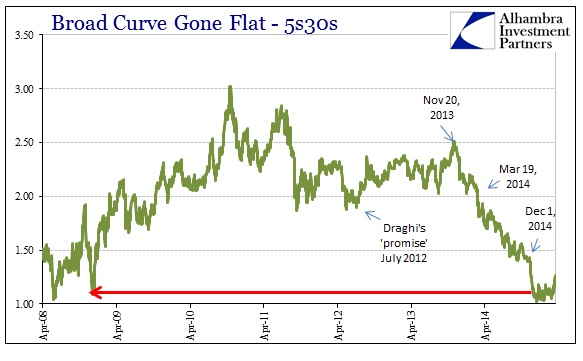
Of the curves away from the 5-year, their range largely continues on the flattening.
None of these moves suggesting the “dollar” being relented are all that much in scale, which further proposes that we aren’t witnessing a rebirth of positivity but rather a pause in whatever bearish pressures had been exerted, awkwardly and lumbering, up until March 18 and the FOMC. Again, however, if there is lessened state of negative “dollar” pressure, it might only be in the temporal dimension.
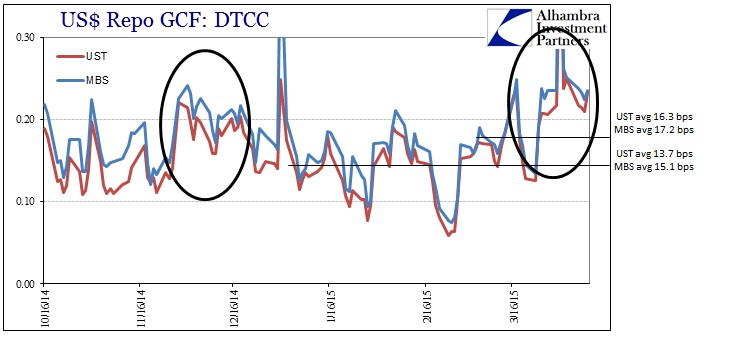
Balanced against the “dollar” view in the front of crude oil and around the 5s in UST, repo and swap markets still suggest non-conformity. Rather than continuing the expectations for post-quarter end denouement, repo rates actually ticked slightly higher yesterday.
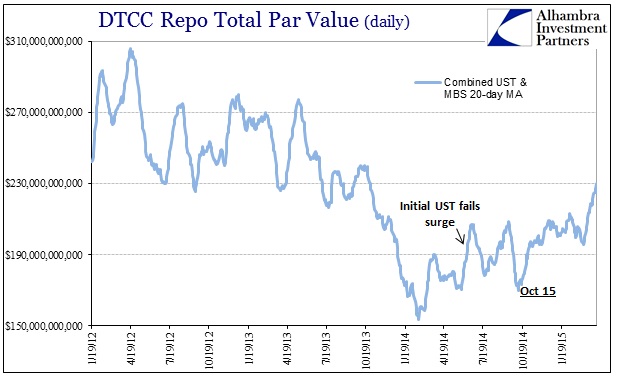
Volume continues to be relatively heavy, now engaged in both UST and MBS. It might actually be more helpful to see this trend in combined volume of both asset types.
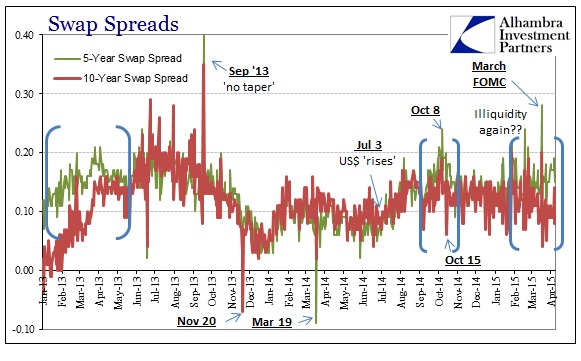
To that I would add the continued divergence between the 5-year and 10-year swap spread (spread of spreads, or a negative spread of spreads).
I think the net total here is what I suggested at the outset, a disharmony among vital indications in what to the “dollar” might be doing. I tend to think that as long as economic expectations remain depressed that any convergence will be toward the repo and swaps end, but that isn’t really much more than a guess given all that we know we don’t know.
Stay In Touch