
The Japanese have been encouraged today by the notion that their economy might actually be finding a recovery – as economists see it. As with so many other things in this QE period, the very definition of recovery seems to be up for debate in sharp contrast to accepted economic standards not all that long ago. The issue, really, is the size of the hole QQE left in Japan’s economy and how fast (or if at all) they are moving out of it. On the surface, a 2.4% (SAAR) gain in Q1 seems to be quite the right direction but that narrow focus loses sight of the utter impoverishment that went along with the monetarism.
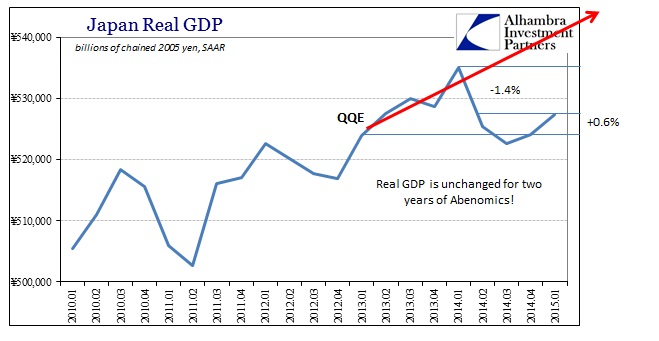
In reality, Japan’s GDP is barely back to the level it was when QQE began. By concentrating on the individual quarters instead of some more realistic benchmark the economy looks to be moving forward where it has instead fallen backward overall. Does it matter all that much if an economy gains 2.4% after dropping almost 15% just a few quarters back? In actuality it does, but narratives are not won with full context.
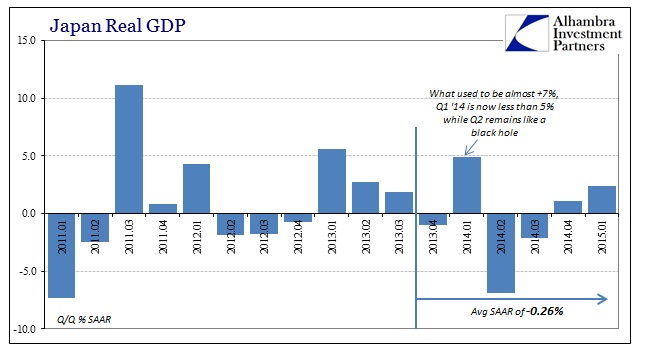
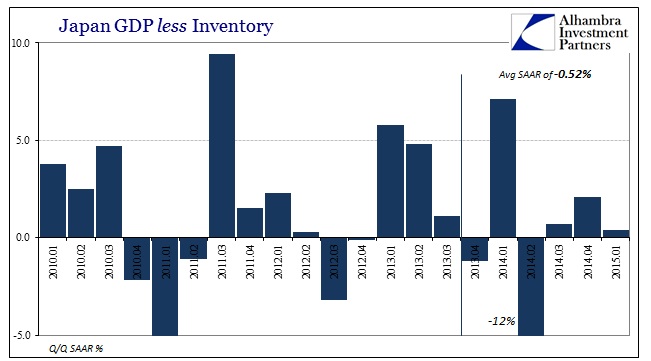
Going back to when the recession actually began in Japan, Q4 2013, a full two quarters before the tax increase, the average growth rate is still negative – meaning that outside of small changes to the calculated inflation rate the economy is still smaller now than it was. The closer you get toward the actual center of the economy (forgoing GDP’s most charitable constructions, in Japan’s case the yen devaluation upon exports) the worse it gets. Subtract inventory and GDP is further negative with a much, much smaller upside in Q1.
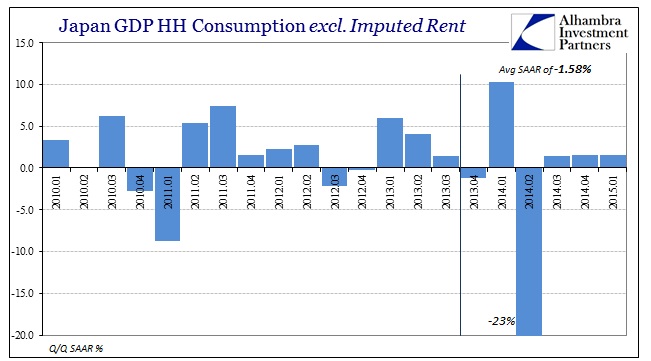
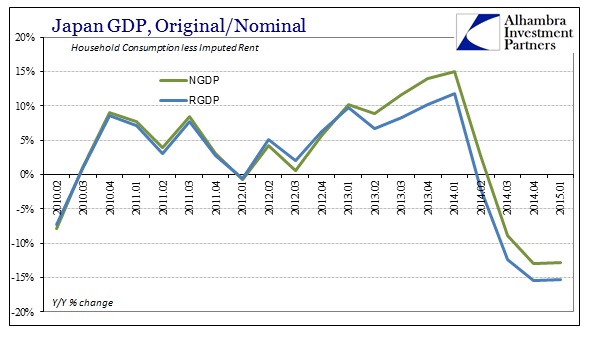
In view of just household consumption (leaving out the ridiculous rent imputation), the impoverishment brought about by QQE is openly revealed. Recovery is not a word that applies where consumption falls a still-unthinkable 23.1% one quarter and then “grows” by 1.4%, 1.6% and 1.5% the next three. That does not count as progress no matter how much you highlight the latest 1.5% gain.
When you step away from these quarterly constructions, the size of the economic hole is hard to grasp. It almost doesn’t matter how you measure it, year-over-year or the trend in SAAR’s, the damage that has been done in Japan is or at least should be unthinkable. As long as QQE remains, this isn’t going to change; all that will change is the pace at which this gets worse, and the stochastic means by which that might be measured somewhere outside of the Q/Q emphasis.
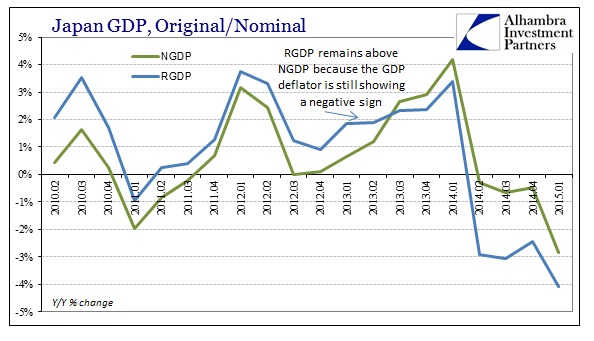
Japan’s GDP is no bigger in Q1 2015 than it was at the end of Q1 2013 when QQE was initiated. In terms of any real benchmark for monetary performance, GDP is way behind where it “should” be by the very standards the BoJ gave itself – in terms of economic advance and “inflation.”
This is, of course, overly familiar to anyone observing economic patterns wherever QE is absorbed. Its proponents and practitioners make grand claims about its efficacy and then not only does the economy fail to live up to them, it doesn’t even live up to finding its way out of the hole that QE creates in the first place. That leaves the monetarists to simply use the latest positive number as the reduced benchmark by which to hold on to the original narrative about it.
The deficiency is greater as you peel back economic accounts most amenable to monetary influence alone. For Japanese households, the economic decay has been ruinous without anything that could fairly be called an upward shift in the year now since the tax increase. If it were simply a matter of a tax change, surely households would be spending rapidly by now after only a short stumble, but they are clearly not in any position to suggest QQE is at all working positively (and, instead, provide evidence that QQE may in actuality be quite depressive overall).
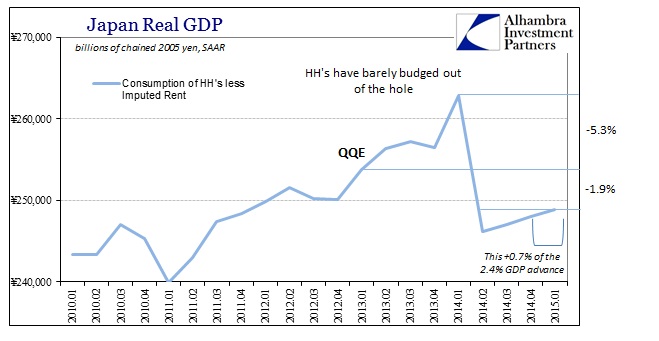
But in terms of quarterly GDP, that minor gain at the end, not even much of a positive slope, is enough to “contribute” +0.7% to the final 2.4% GDP number. That pretty well highlights this disparity in interpretation, the sometimes intentional simplicity that just assumes any positive number is both helpful and meaningful. To be two full years into QQE and to have household spending almost 2% lower in absolute terms is not just a recession but a total monetary failure. By the original standards of the BoJ, consumption, as a proxy for positive economic distribution and thus health, household spending is not just 2% lower it is somewhere around 9.4% too low!
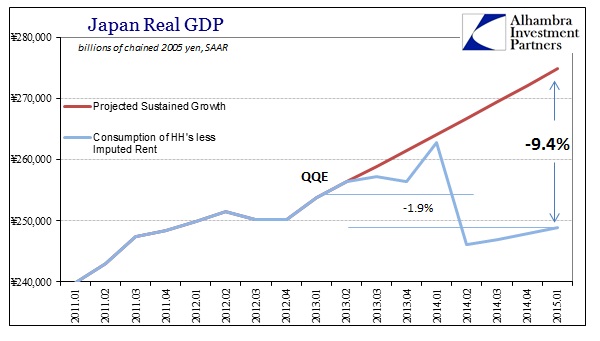
What stands out in that much more relevant comparison is not just the immense gap to promised function but that the track of HH consumption deviated only a few quarters into QQE; meaning the recession started long before the tax increase. What we have been reduced to is measuring the scale of the recession while economists and monetarists (redundant) would have you only notice the very tail end in isolation.
Much like the US housing and real estate data recently, if there is a recovery in here I am at a total loss to see it. What I see and what is most important is the scale of the disaster that does not appear to be abating. The longer this scraping along the bottom goes the more likely for renewed retrenchment. In other words, given these economic transgressions, very much like the US, GDP should not be growing at 2.4% it should be racing at 5% or 6% steady quarter after quarter. It would take something like that just to be consistent going forward with the monetary promises of April 2013, and even then would still be debatable about an actual recovery.
Stay In Touch