
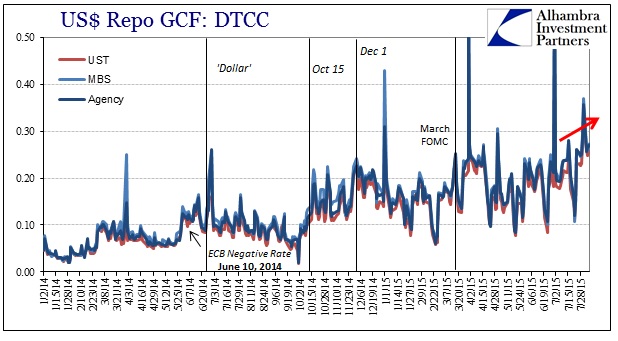
Given the outward expression of the “dollar” in various proxies, it is not surprising to see the inward development continue in the same pattern. Interbank rates and estimates are in many cases surging, particularly in the second half of July which matches the acceleration in the outward projections. This direction is nearly uniform, which confirms that the latest “dollar” problems are widespread and penetrating (more on that below).
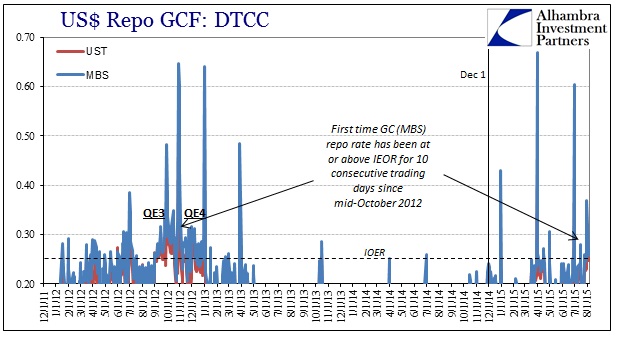
Repo rates have been especially interesting, and not just with the unnatural repetition across quarter-end periods. The GC repo rate for MBS and agency collateral has been at or above IOER for 10 consecutive trading days now for the first time since October 2012. The acceleration in rates is timed to this same period in question.
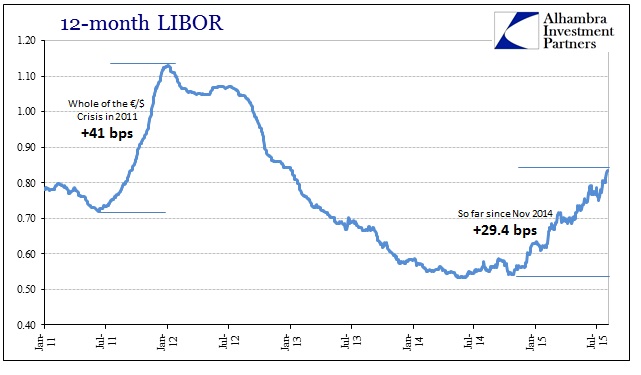
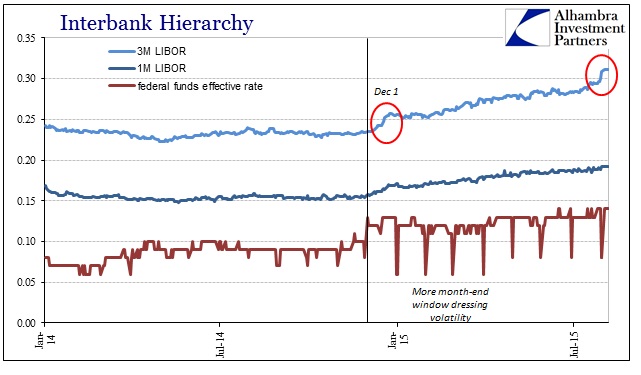
Repo rates have the “look” of an unstable market, which the repeating quarter-end, counterintuitively, suggested as all this roughness began. The jump in repo is matched by LIBOR, especially more recently at the end of July and into August. Three-month LIBOR soared nearly 2 bps after July 29, while 12-month LIBOR has surged almost 9 bps since July 8.
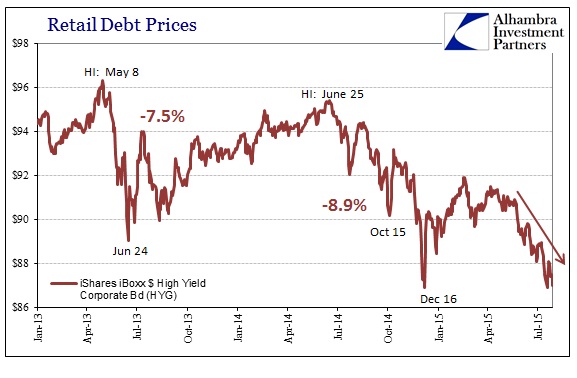
While this may simply be a continuation of the illiquidity that has plagued the system since either October 15 or December 1 last year, ruling out simple re-orientation to the will they/won’t they monetary policy, the effects are becoming quite visible in terms of shifting risk acuity. Junk versions of corporate credit have been selling in sustained fashion throughout July and into August. Leverage loans, as far as can be examined through the marketable proxy of the S&P index, are only a few index points above the mid-December lows.
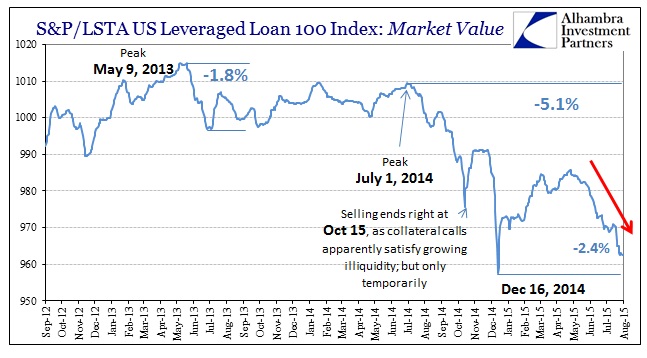
Where those price declines late last year were clear and more violent cascades, in some ways this drop is worse especially in terms of the overarching reading on the renewed “dollar” flare. In other words, those prior almost crashes could be explained by bad liquidity alone, meaning that fundamentally there wasn’t much of a radical alteration. A more orderly and sustained selling impulse following an attempted retracement, however, tends to be indicative of a more durable or even permanent impairment – liquidity plus fundamentals.
The trend across higher risk corporate is universal, and certainly transcends just the energy sector.
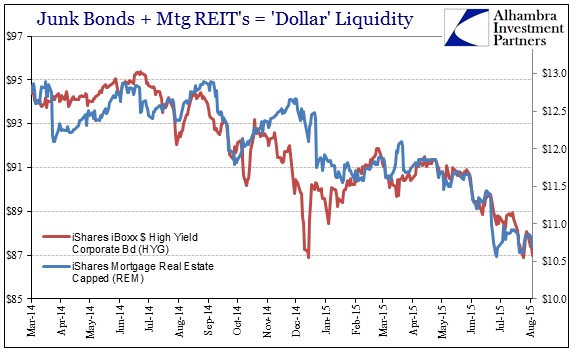
Combined with the mortgage REIT index, there are those two elements (REM = liquidity; HYG = fundamentals) in unison sinking toward those prior lows. That has had the effect, especially the accumulation of this negative pressure over more than half a year, of altering even the trading environment and suggesting potentially a more permanent reduction in “flow”; which could be an end to the default cycle.
Trading volume in junk had been clearly boosted by QE3, as there can be little doubt about the effect upon at least perceptions about how QE might hold up liquidity and thus prices for an extended (or even semi-permanent, as Bernanke first sold it) “reach for yield.” The growth in trading volume would seem to be just such an artificial support for that process.
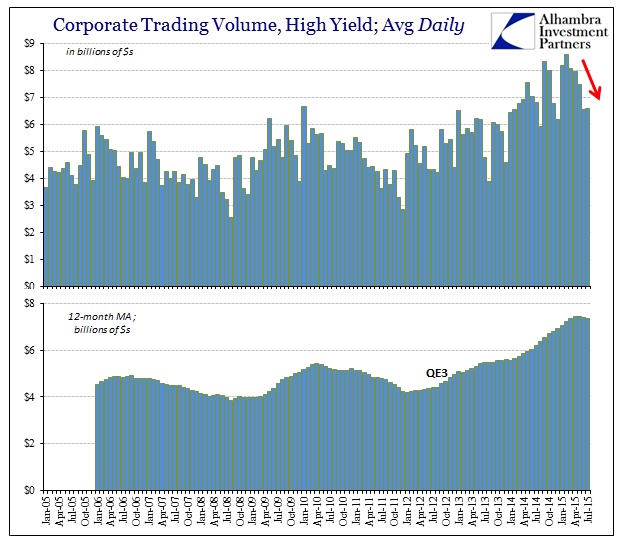
Since January, trading volume has fallen by more than $1 billion per day, which coincides with tailing off of issuance – less visible depth to absorb transactions without meaningfully changing widespread pricing. Given the inward indications noted above, as well as the extended outward “dollar” environment, it isn’t surprising that July high yield issuance was the second lowest monthly total since QE3 started (only better than last August and the initial “dollar” erosion). SIFMA estimates just $7.4 billion in gross issuance in July compared to an average of nearly $30 billion per month between September 2014 and May 2015. The rolling three-month average issuance ended with July is 34% below the same three months of 2014 when the “dollar” breakout began.
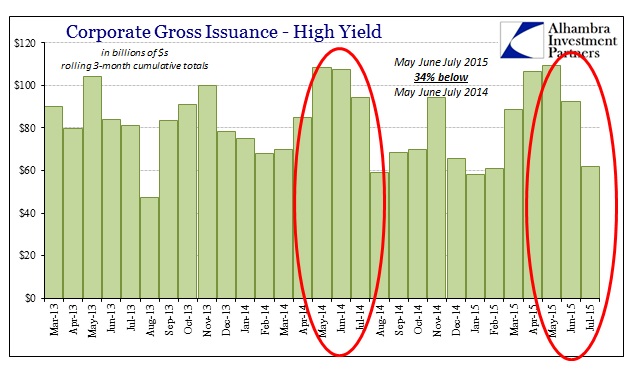
So the trend in overall issuance follows these “dollar” episodes almost exactly; a decline in gross volume to October 2014, renewed in December, followed by an almost robust rebound from March until May 2015 during the “dollar” “pause.” Issuance projections such as these are problems in that companies dependent on “reach for yield” flow cannot long survive a sustained absence of it. But the worst of the implications here in terms of issuance is how that reflects depth of pricing irregularity and illiquidity. In other words, visible pricing will be used to reflect leveraged positions hidden all throughout the “dollar” world, invisible by less active trading but no less leveraged behind the scenes.
If liquidity and the “dollar” continue as they are, and issuance anticipates a much less certain pricing environment, then the next stage is widespread repositioning across the whole network of interconnected risky portfolios. The “math” might be forgiving on a temporary change in issuance, and thus pricing and fundamentals, but the longer that goes the more the math (especially deltas surrounding default rates now at historic lows) will have to evolve increasingly unfriendly calculations. In other words, the numbers currently supporting this:
Stay In Touch