
Just a couple of noteworthy prices/developments around the close:
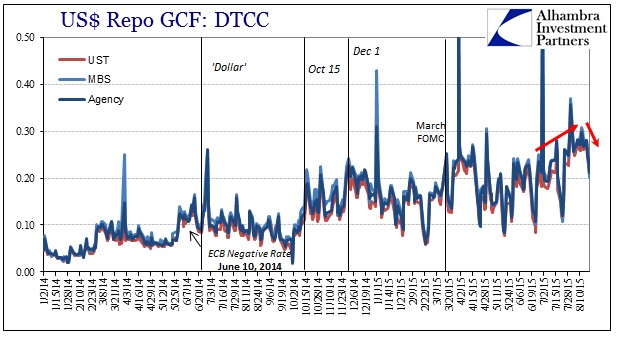
1. Repo rates have come back down, with the GC rates yesterday below IOER for the first time in 16 trading sessions (MBS). Volume in MBS has been quite light recently, with UST volume making up the difference. I can’t see any particular reason for such a marginal shift except the persistence of the MBS rate above UST, which is usually the case anyway.
Even though repo rates have turned lower, that isn’t especially unusual nor does it immediately suggest conditions have normalized. The same occurred right after October 15 and funding irregularity continued on more or less thereafter in certain markets for weeks.
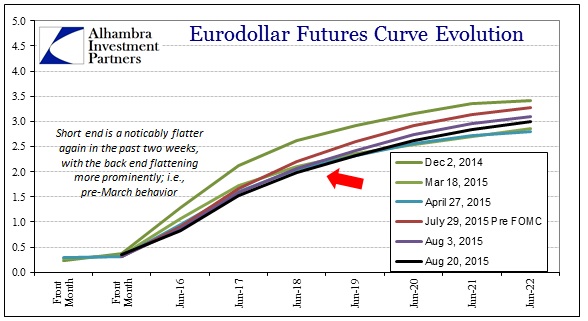
2. The eurodollar curve up to and inside 2018 is nearly as bid/flat as it has been. The June 2018 contract, for example, traded above 98 today which is within sight of its high. With the curve shrinking in the near-term it suggests serious bearishness continuing in money markets independent of the FOMC’s continued confusion and dissembling.

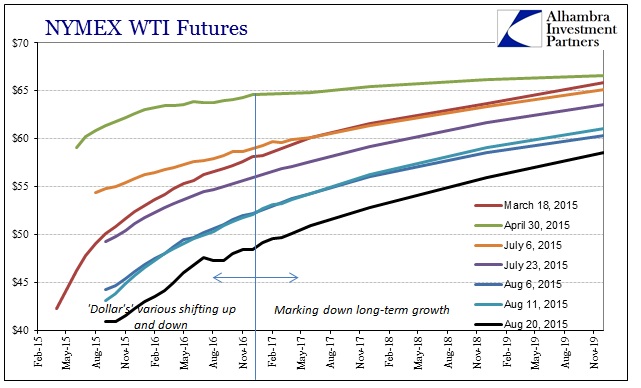
3. Crude oil trading, I think, reflected the drawn off nature of the “dollar” today, at least for most of the day. The front end of the WTI curve was actually bid higher (lack of direct “dollar” pressure) for awhile, if somewhat, while the back end sold off directly and severely; 2016 maturities and out were down almost $2 per barrel. That led to some new lows across the curve, with the December 2019 contract below $60 for the first time (and nearly into the $58’s). The June 2017 contract, which is far more traded and relevant, has simply sunk like a stone and is now barely above $50; it was just shy of $65 on June 24, and, reflecting very well the timing of the related Chinese liquidity gap, $62.15 in morning trading on July 6 (falling to $58.53 by the close of that day).
By the end of the trading session, however, nearly the full WTI curve was sold except for just the front month, September. The entire curve closed unusually lumpy, including a closing price for the June 2016 contract that isn’t quite conforming (the last quoted price I have would set up a nearly $2 contango to July, and a $0.30 backwardation to May; I have omitted it from the charts below absent further clarification). Economic expectations darkening with or without the “dollar’s” help?

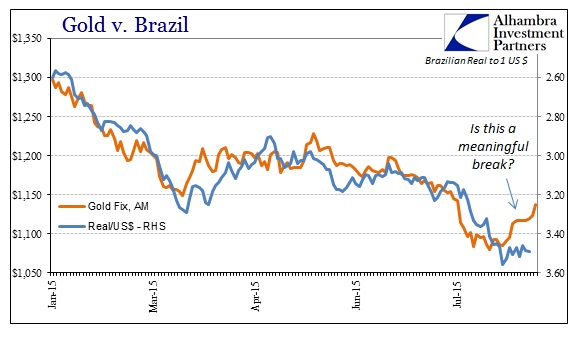
4. Continuing on from yesterday, gold was up significantly. At $1,137.95, it was the highest at the AM fix since July 17; and hit almost $1,150 at the PM fix. There was no obvious “dollar” pressure today, so we can’t make any interpretations about how gold might perform under such “heat”, but it is at least consistent with the past week again with or without the “dollar.” I’d like to see gold continue higher with the “dollar” under heavy duress before making any hard determination about a potentially sustained safety bid, but, pace WTI, there is certainly by itself enough negativity to justify even a temporary runup.
That seems to be theme today, at least in broad markets apart from the usual funding disruptions. Stocks were heavily sold and UST’s bid, the 10-year back below 2.10%, and nary an obvious “dollar” to explain it proximately.
Stay In Touch