
Since the corporate bond bubble has added more than a half year since I last updated its size potential, it is worth reviewing given the lack of enthusiasm in that space post-August 24. Even before that “dollar” run clocked China and the rest of the world, the corporate bubble was being dented by the larger “dollar” trend dating back to June last year (which is itself a part of the overarching trend going back to 2013, and really August 2007).
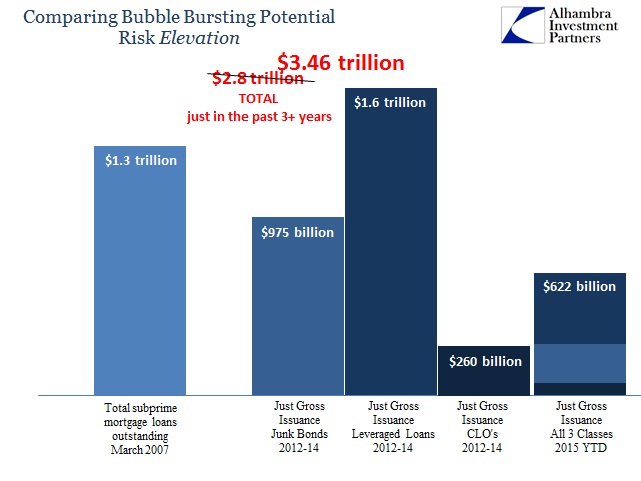
Total issuance this year is down across the board, but more so in leveraged loans than anywhere else. I have written before that I think it will be leveraged loans that are the primary fault-line dividing bubble and its reversion, so that seems to be holding this year as that leading edge. Through August, leveraged loan issuance (figures from LSTA) is down 22% from the same period in 2014. CLO gross issuance is off 15.5% (through July), while junk bonds have been floated at about the same pace (“dumb” money retail investors?).

The fact that the yield level (to maturity) for at least the names included in the 100 index (which is likely much more positive in its view of the overall leveraged loan condition) has gone from 4.47% (insanely low) in August 2014 to 5.53% this August (still insanely low) begins to put together the ominous picture. Either these low quality obligor companies can’t handle an extra 1% in borrowing costs or investors are now so wary of the decidedly non-transitory price momentum they have stepped out of the way by one-fifth. Neither is a particularly optimistic view of the state of the bubble.
It will be quite interesting to see what volumes look like in September, which is typically one of the heaviest months for deal flow. That may be one factor as to why leveraged loan prices don’t seem to be able to gain any traction, continuing to be stuck uncomfortably close to the August 26 low.


With the entire high yield/junk class seemingly unable to attract serious bids so far, the time factor is undoubtedly working still against the overall bubble. With these figures in hand, we can update the total size (keeping in mind that gross issuance isn’t a direct number; we have no way of accounting for true refunding so the actual size of the bubble is somewhat less than the headline) as combined with a pricing environment increasingly hostile. It goes without saying, but I’ll reiterate here, that that is a bad combination. In other words, with this size and lingering edginess/wariness it doesn’t take much to get the snowball starting down the hill; especially having already experienced two previews in the past nine months.
Stay In Touch