
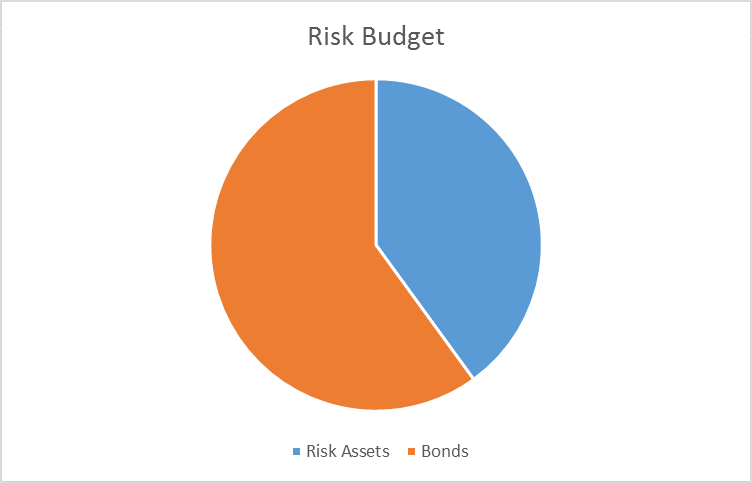
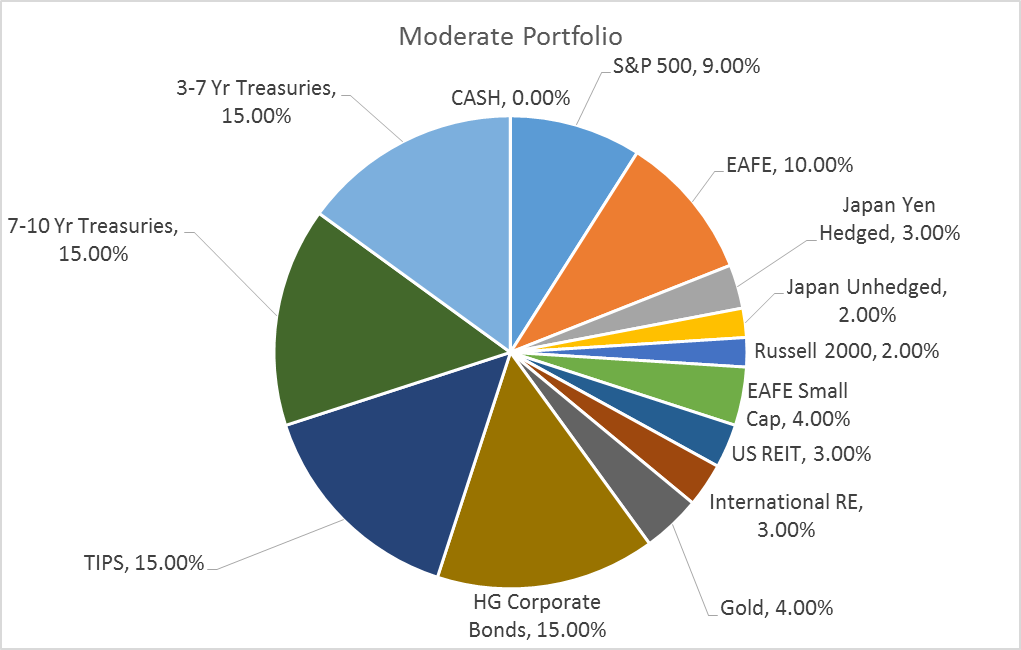
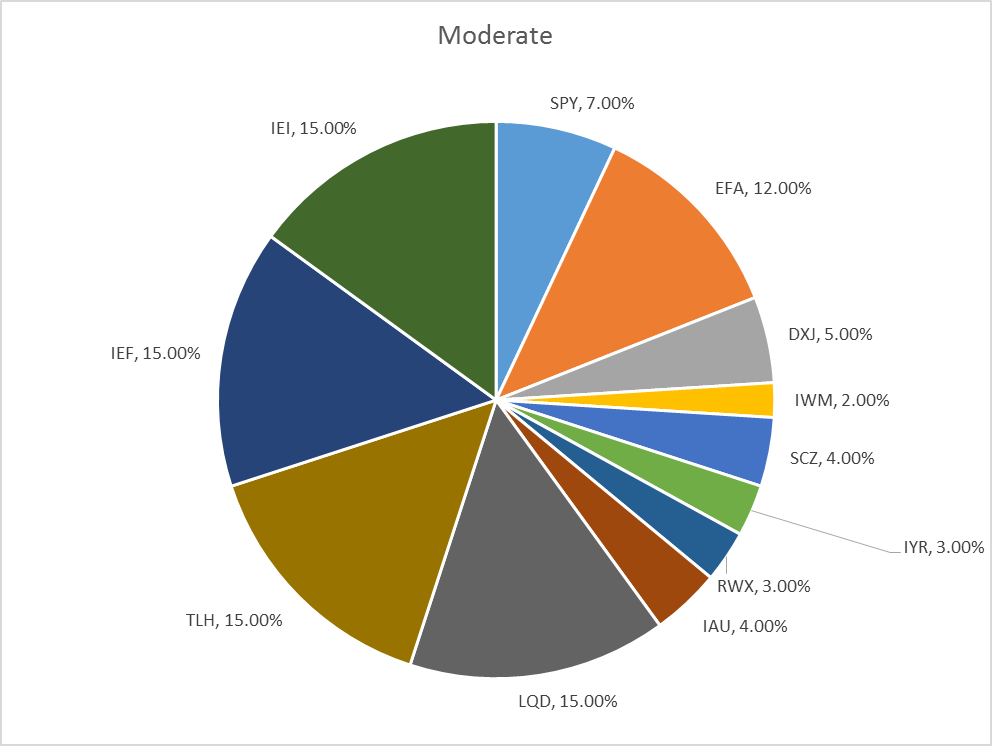
The risk budgets this month are again unchanged. For the moderate risk investor, the allocation between risk assets and bonds remains at 40/60 versus the benchmark of 60/40. The changes in our indicators since last month’s update have not been sufficient to warrant a change. Credit spreads did narrow significantly over the last month but the widening trend is still intact.
The economic data improved somewhat over the last month and oil prices firmed. This firming of oil prices, more than anything, was the catalyst for the improvement in credit spreads. That improvement in credit spreads was accompanied by a pretty nice rally in stocks but like the trend in spreads, the trend in stocks hasn’t changed, the downtrend threatened but still intact. The improvement in the economic mood also affected the long end of the bond market. Our move last month to sell duration turned out nearly perfect as the update was published the day TLT and TLH peaked.
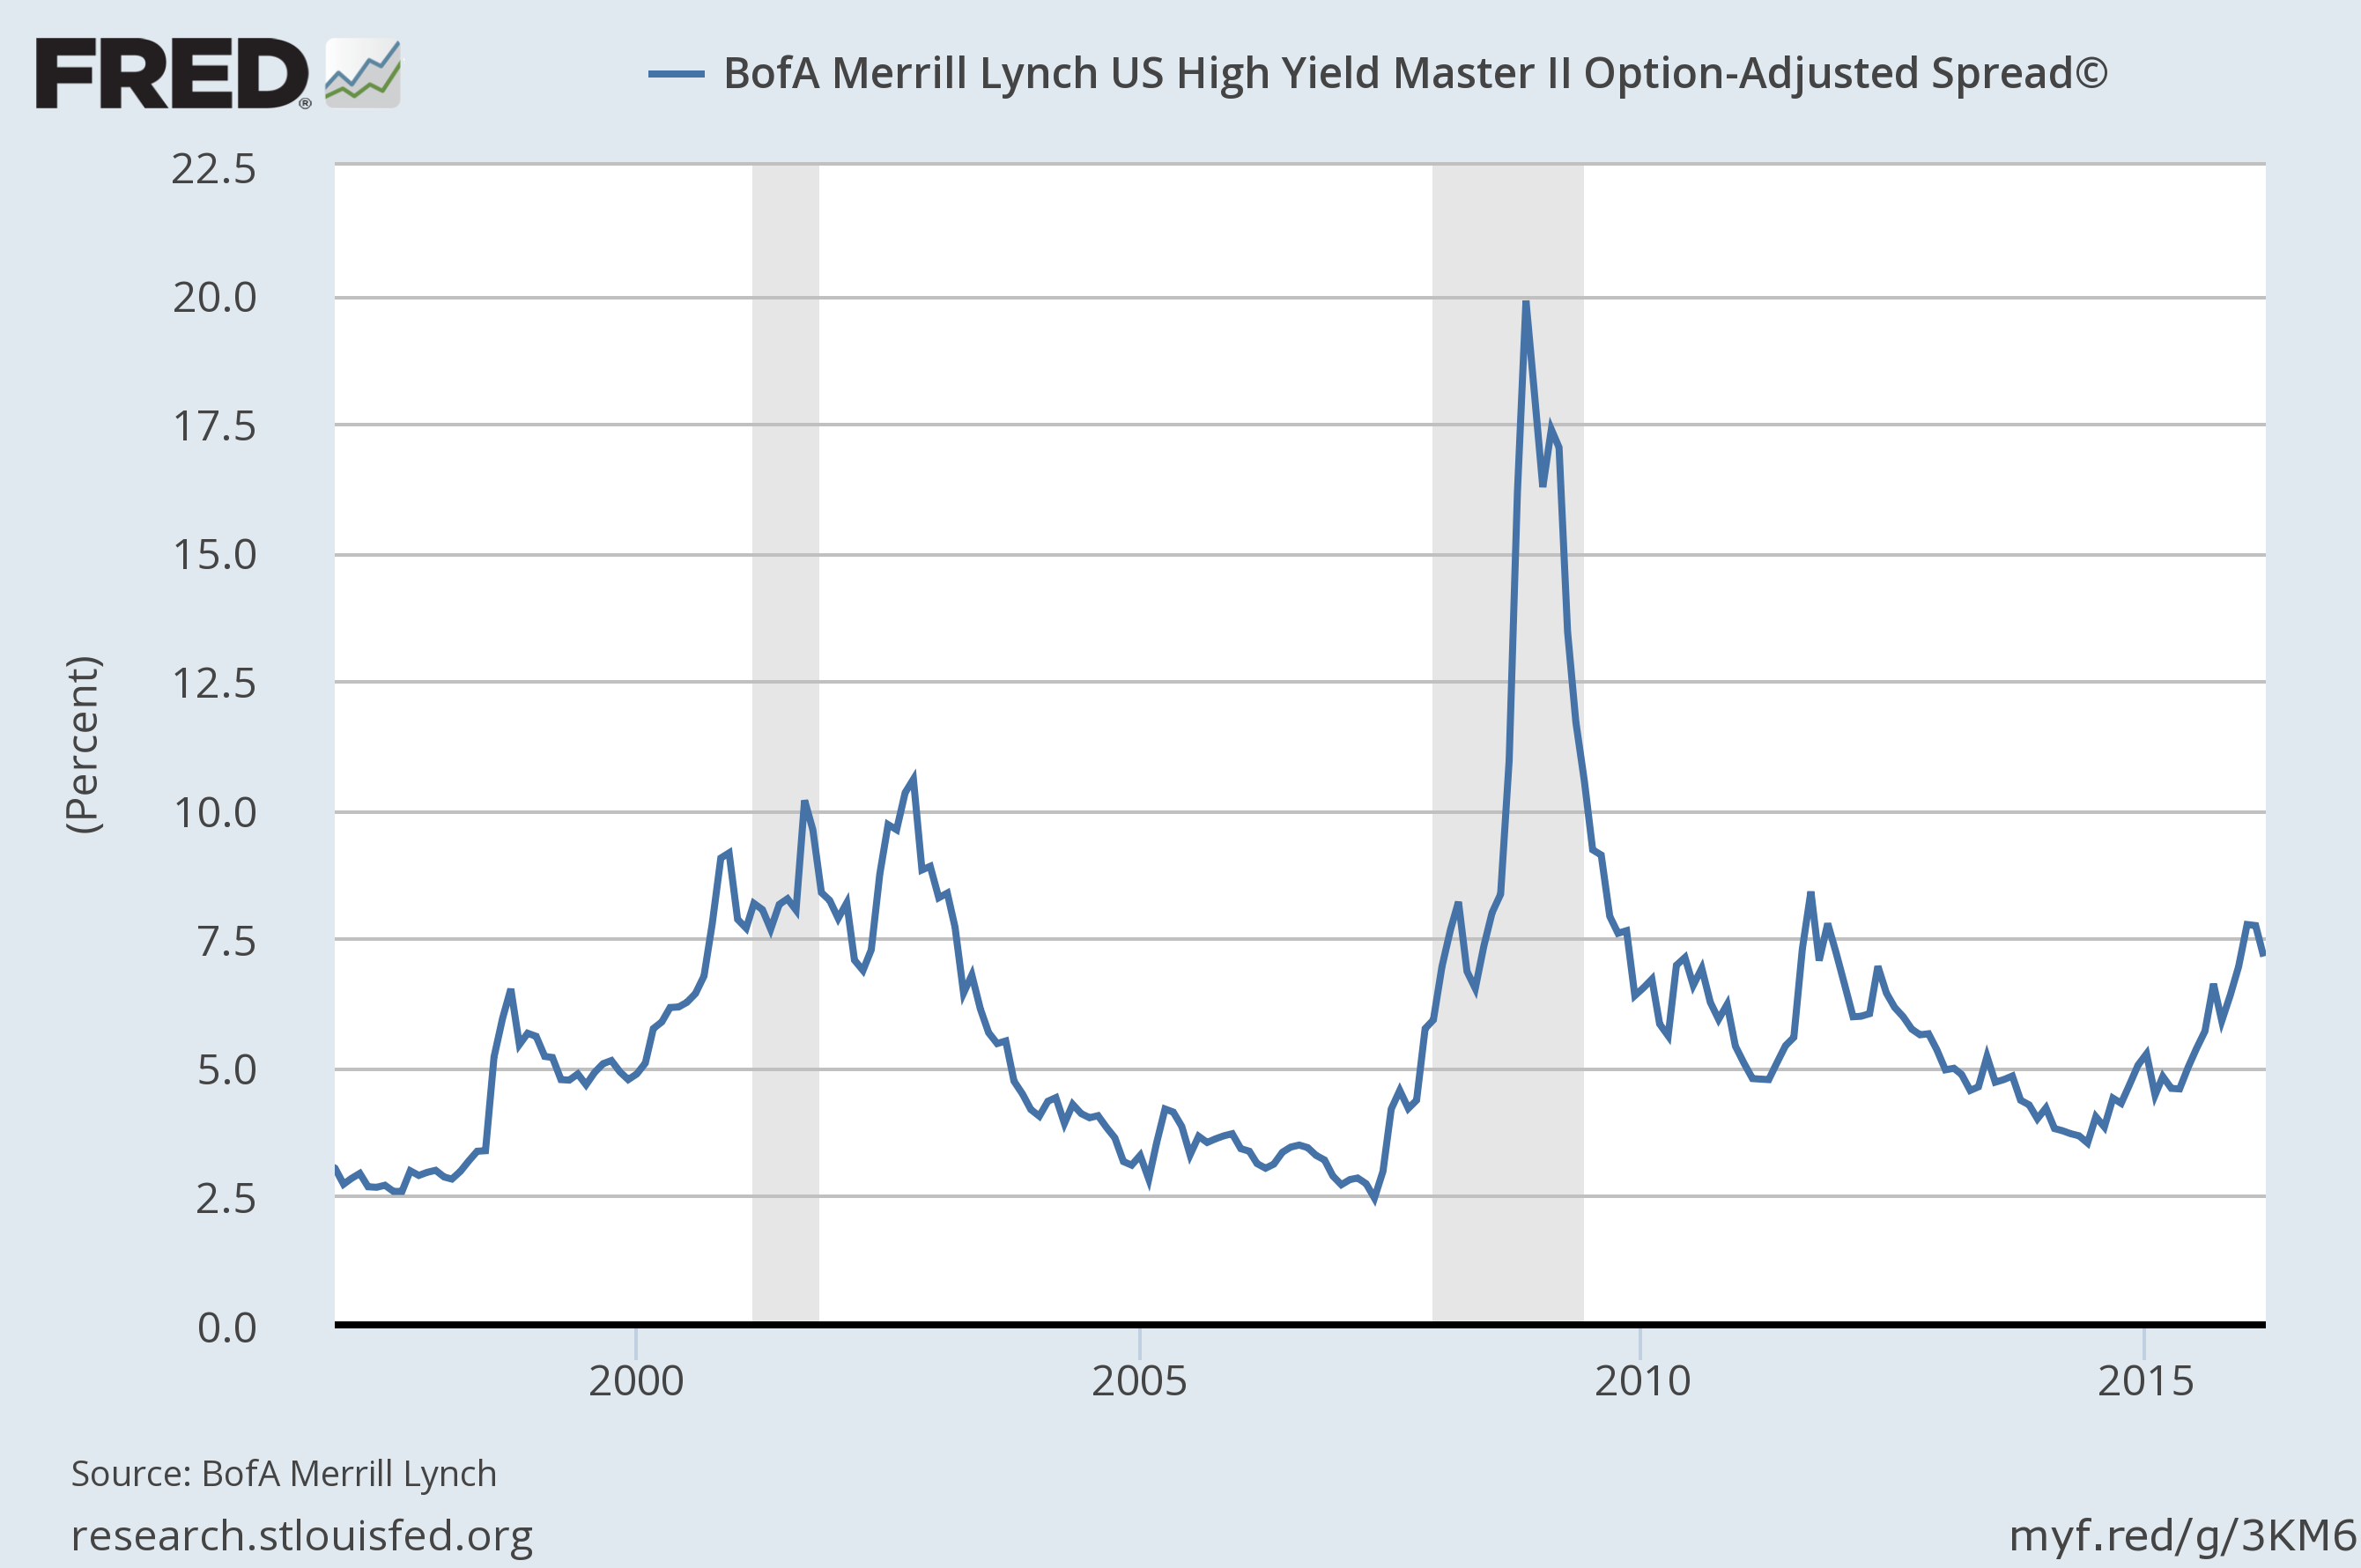
- Credit Spreads: The HY spread in last month’s update turned out to be the peak so far for this cycle, 8.87%. Since then spreads have narrowed to 7.15%, a very large move for one month. Spreads narrowed across the spectrum of ratings.
- Valuations have not improved as earnings for Q4 2015 were once again negative, the third quarter in a row. In addition, estimates for Q1 are falling and right now are expected to make it four in a row. Stock prices have not fallen far enough to reduce valuations meaningfully.
- All but the shortest momentum indicators are still negative.
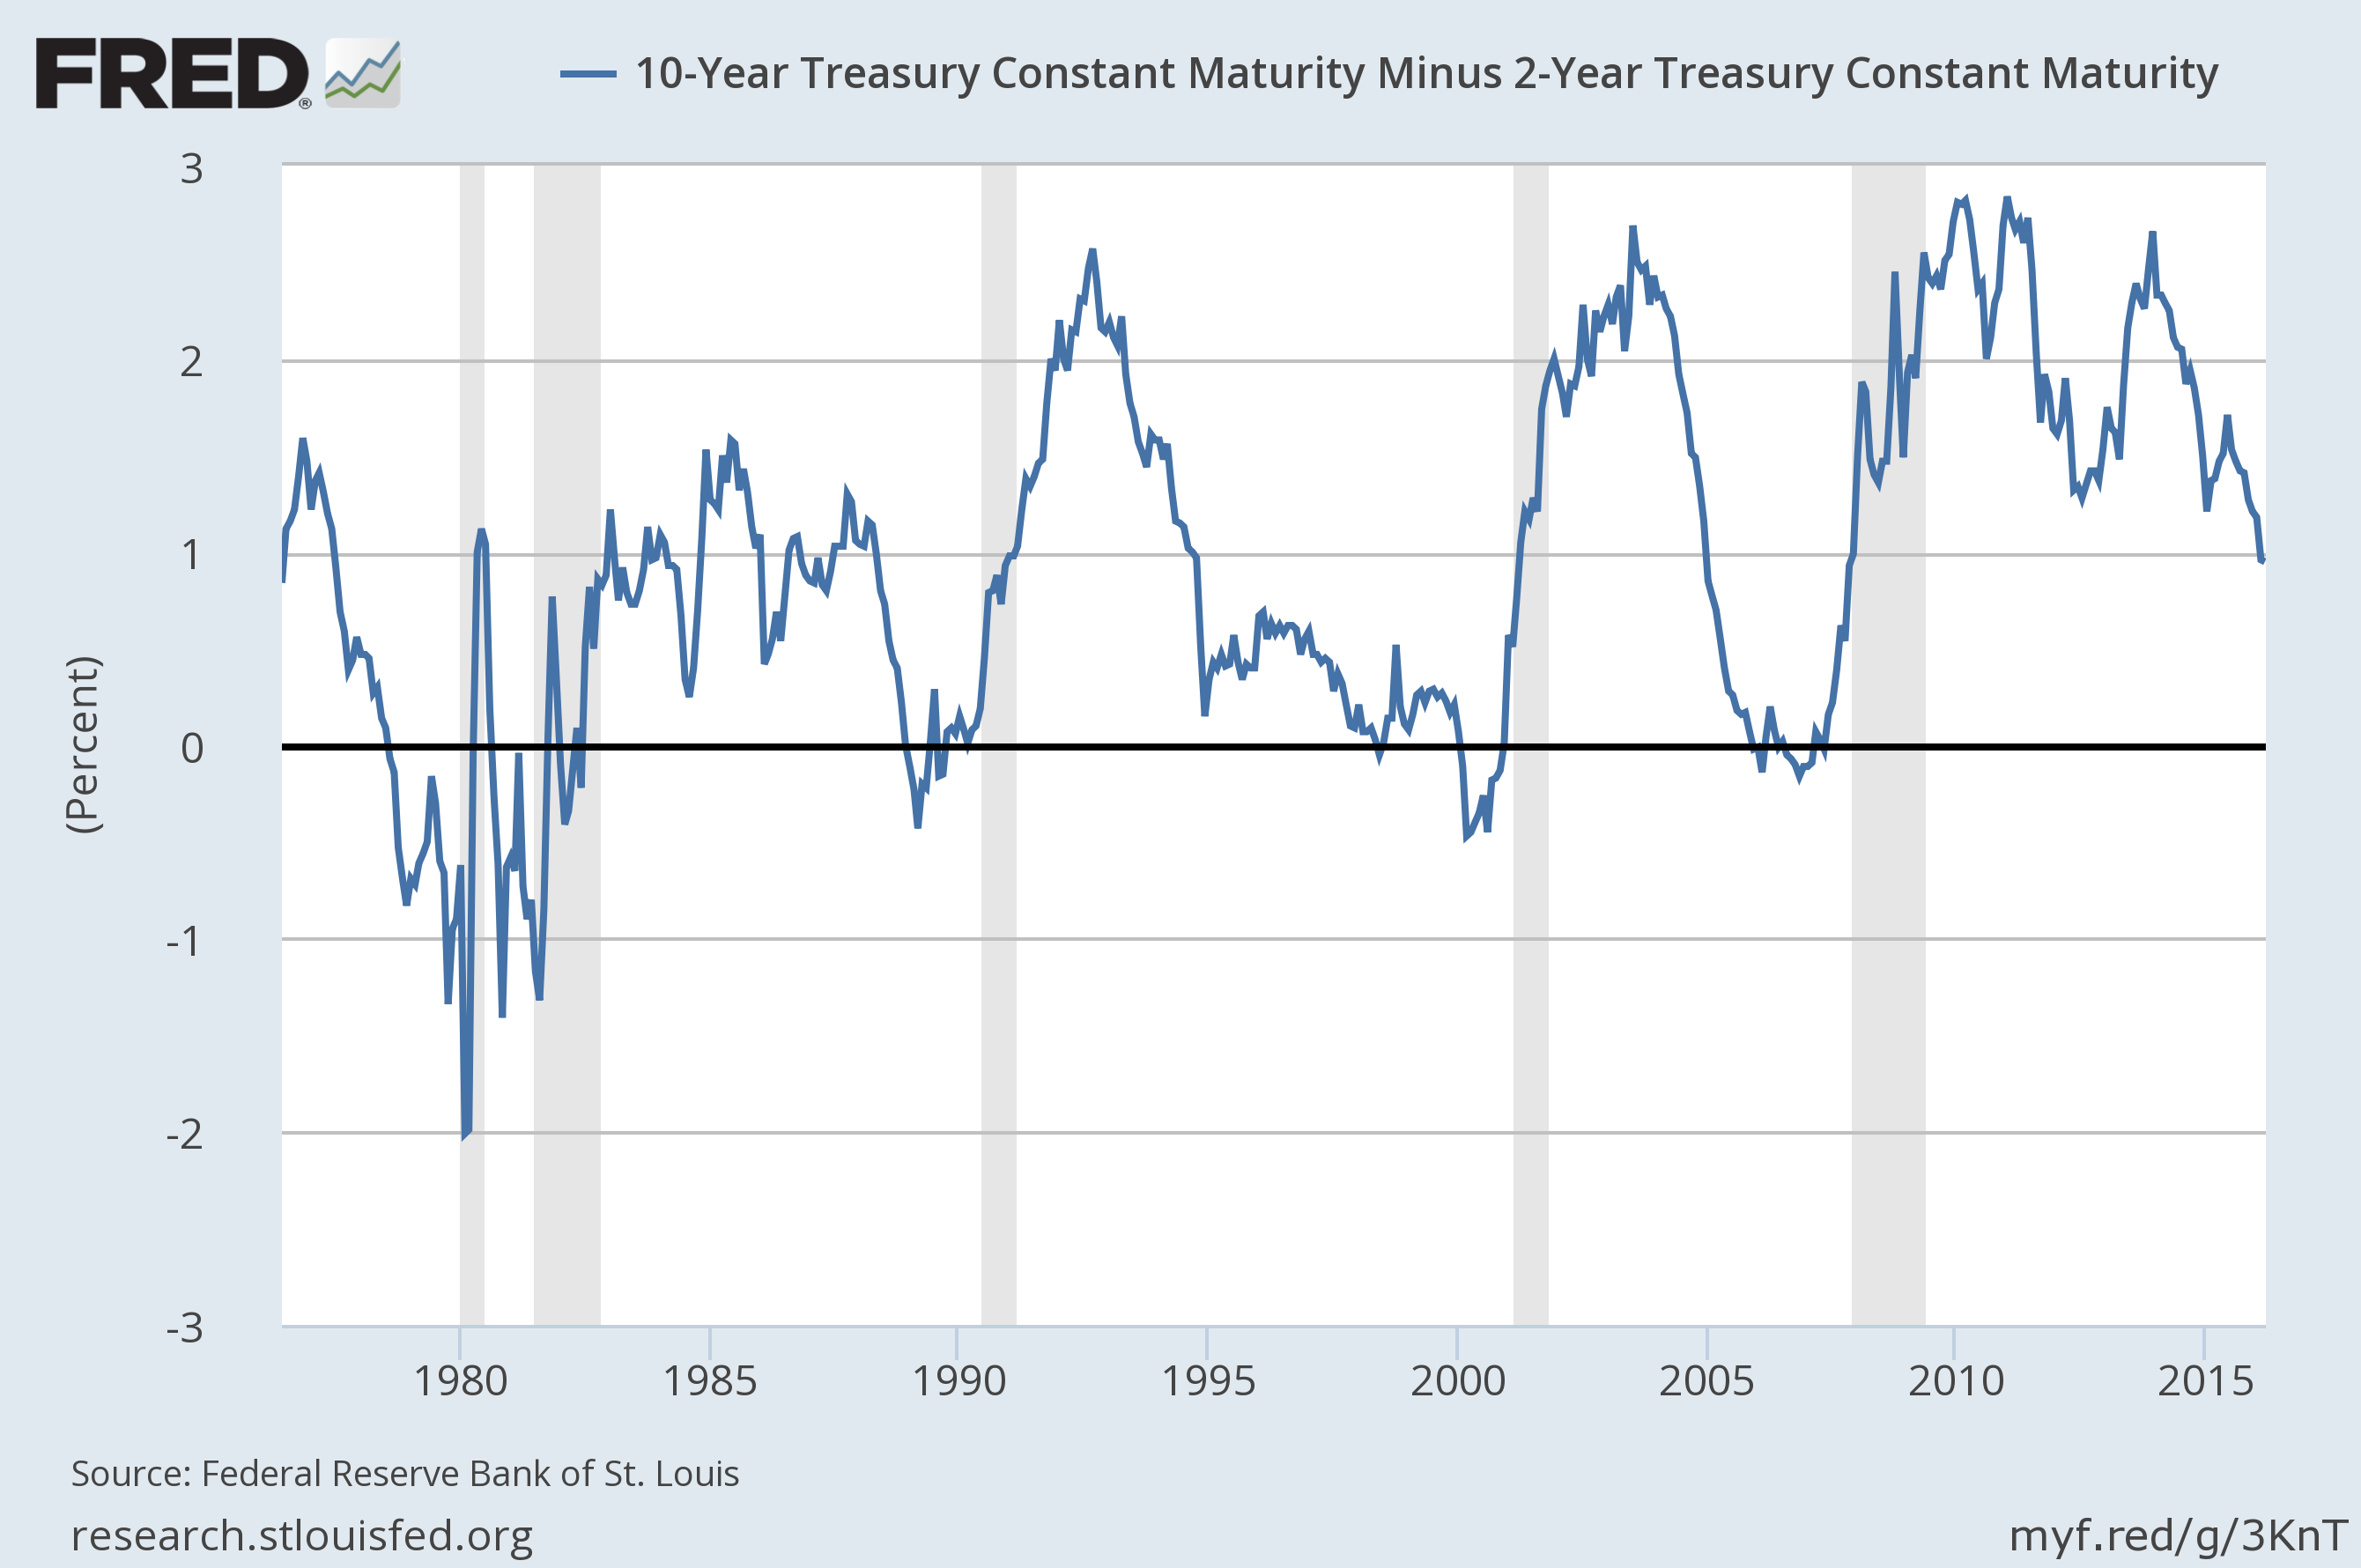
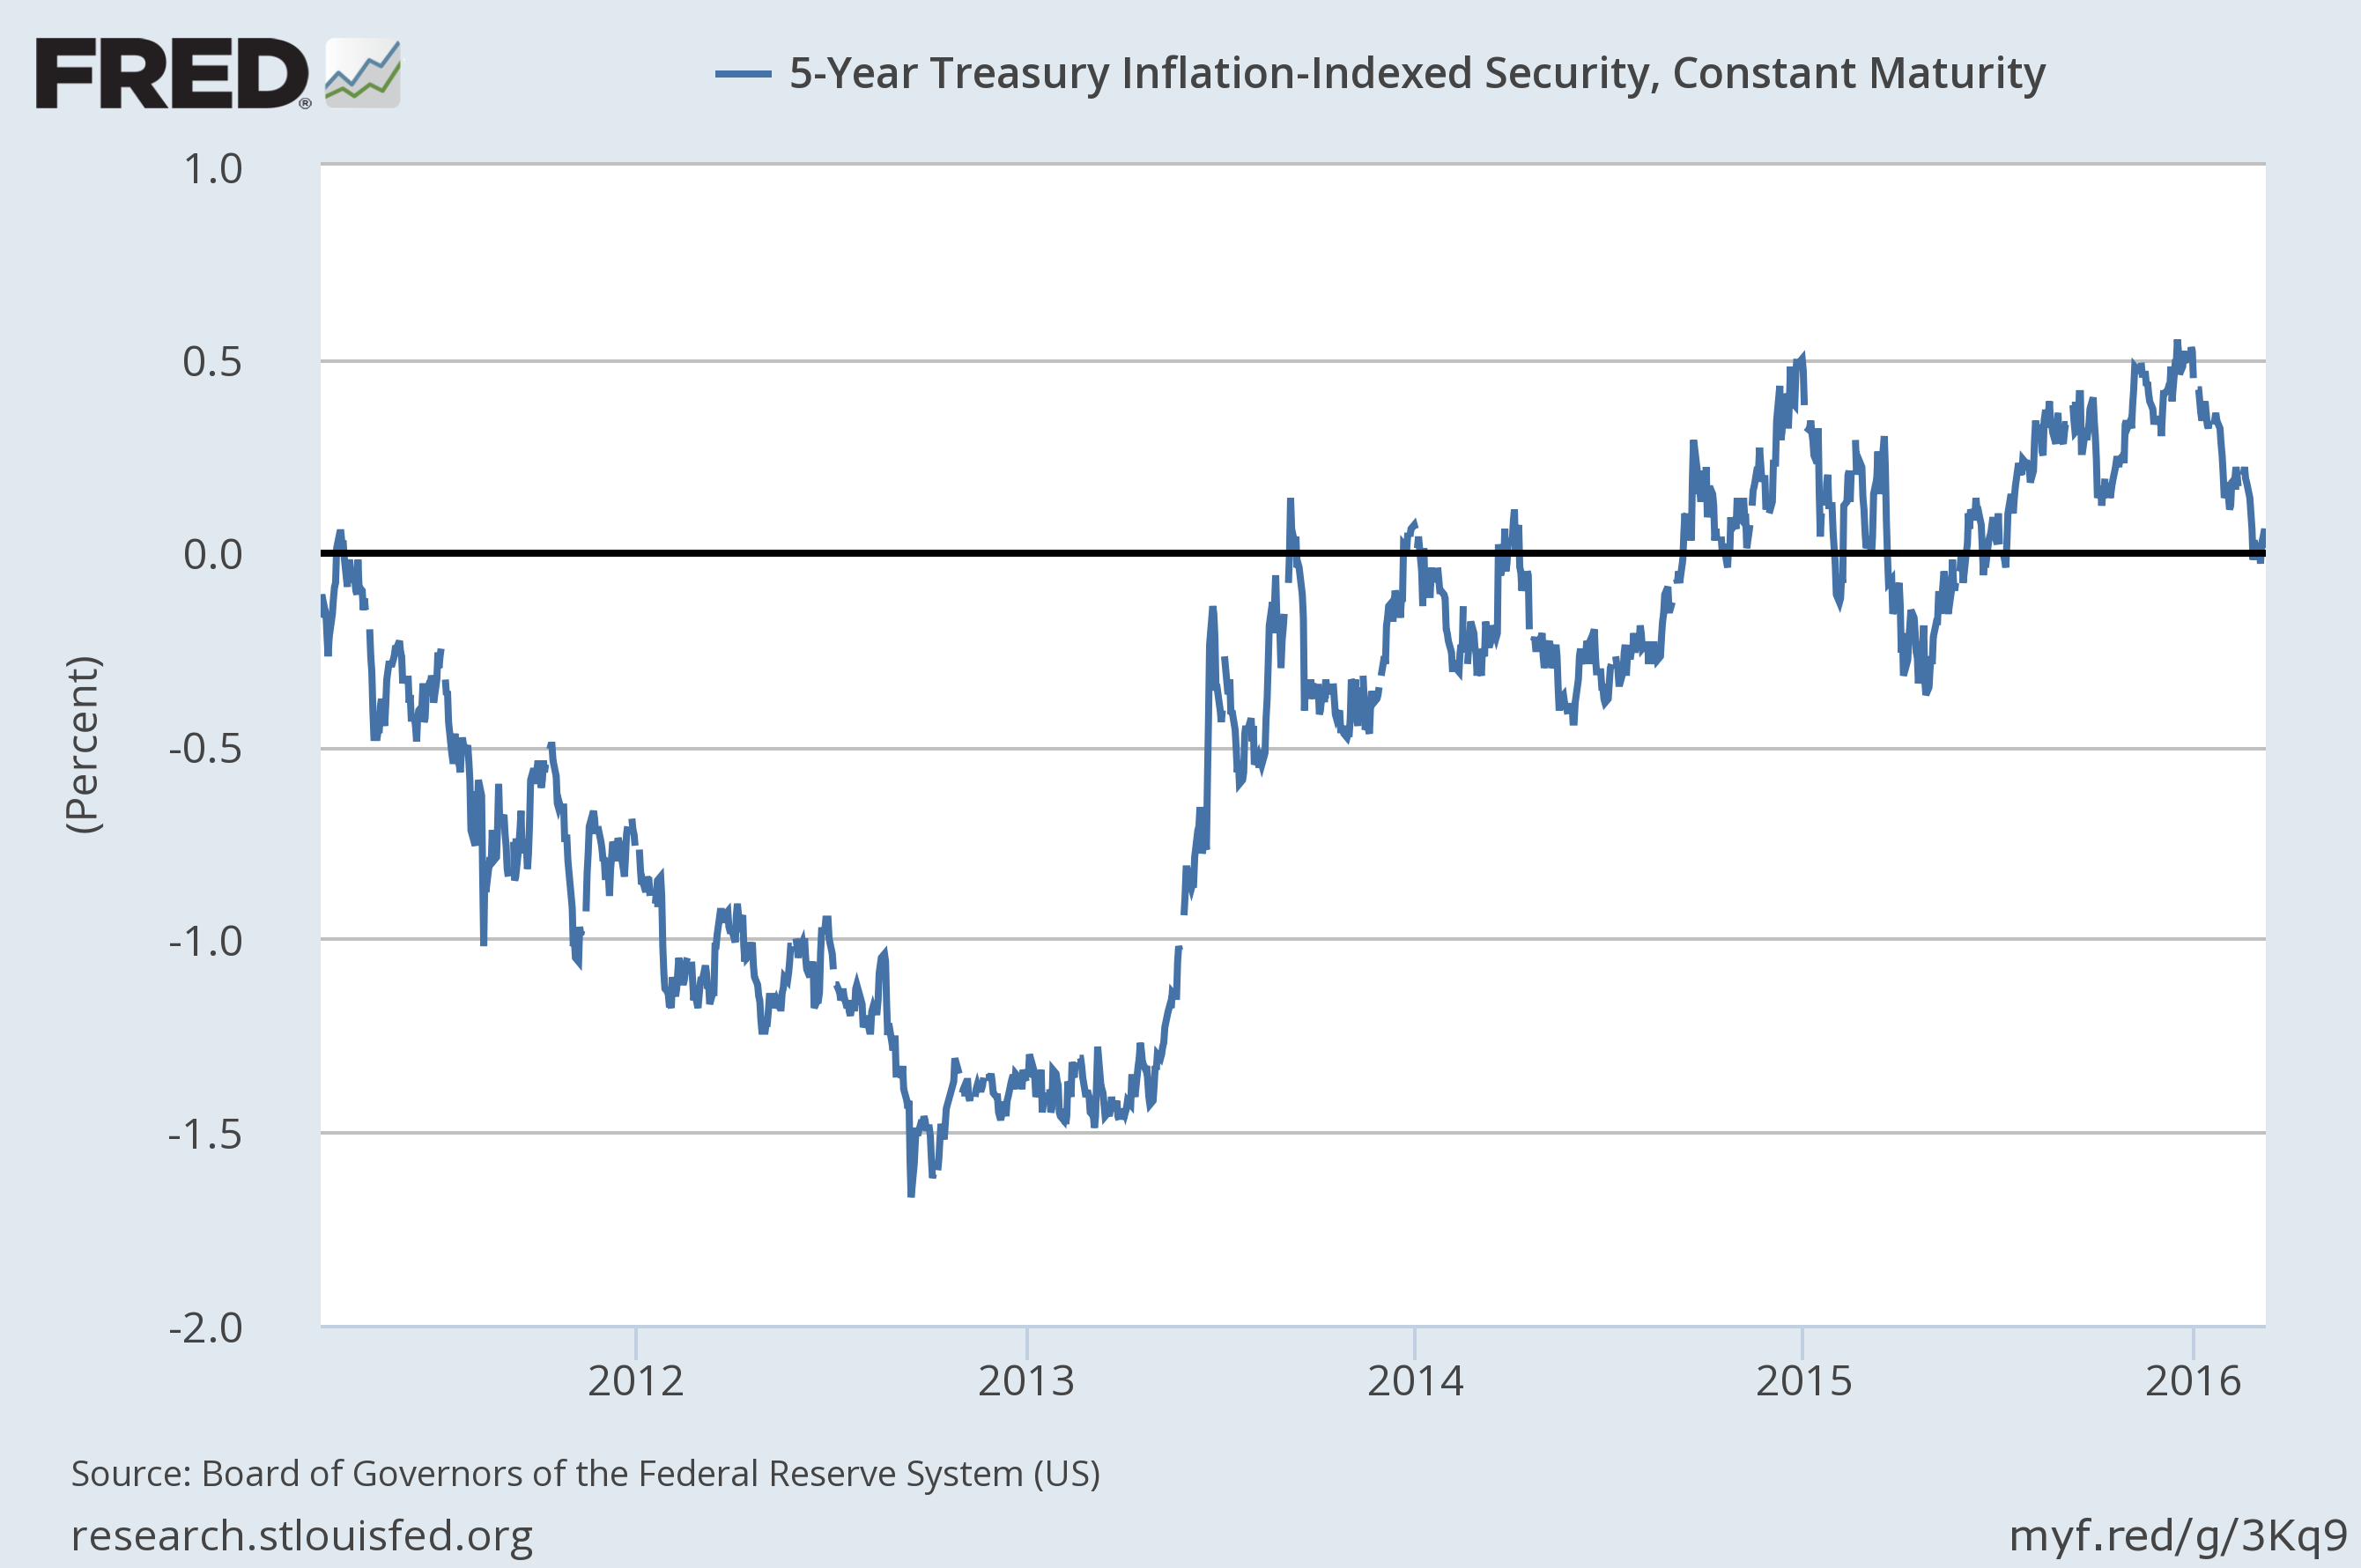
- The yield curve continued to flatten but the 10/2 spread is still not flat or inverted. Real rates also continued to fall with the 5 year TIPS going negative briefly (currently at 0.01%). Falling real rates have been a positive for gold and other commodities.
Credit Spreads
The panic I noted in credit spreads last month abated throughout the month and spreads narrowed significantly. The narrowing, however, was not by my reckoning sufficient to change the trend nor to make a change in allocation. A narrowing like this even before recession is not unusual. As you can see similar moves were seen prior to previous recessions. The economic damage of wider spreads is hard to quantify but high yield issuance is down considerably from last year. So far in 2016, $16.4 billion in junk bonds have been issued versus $51.5 billion in the first two months of last year.
Widening trend still intact
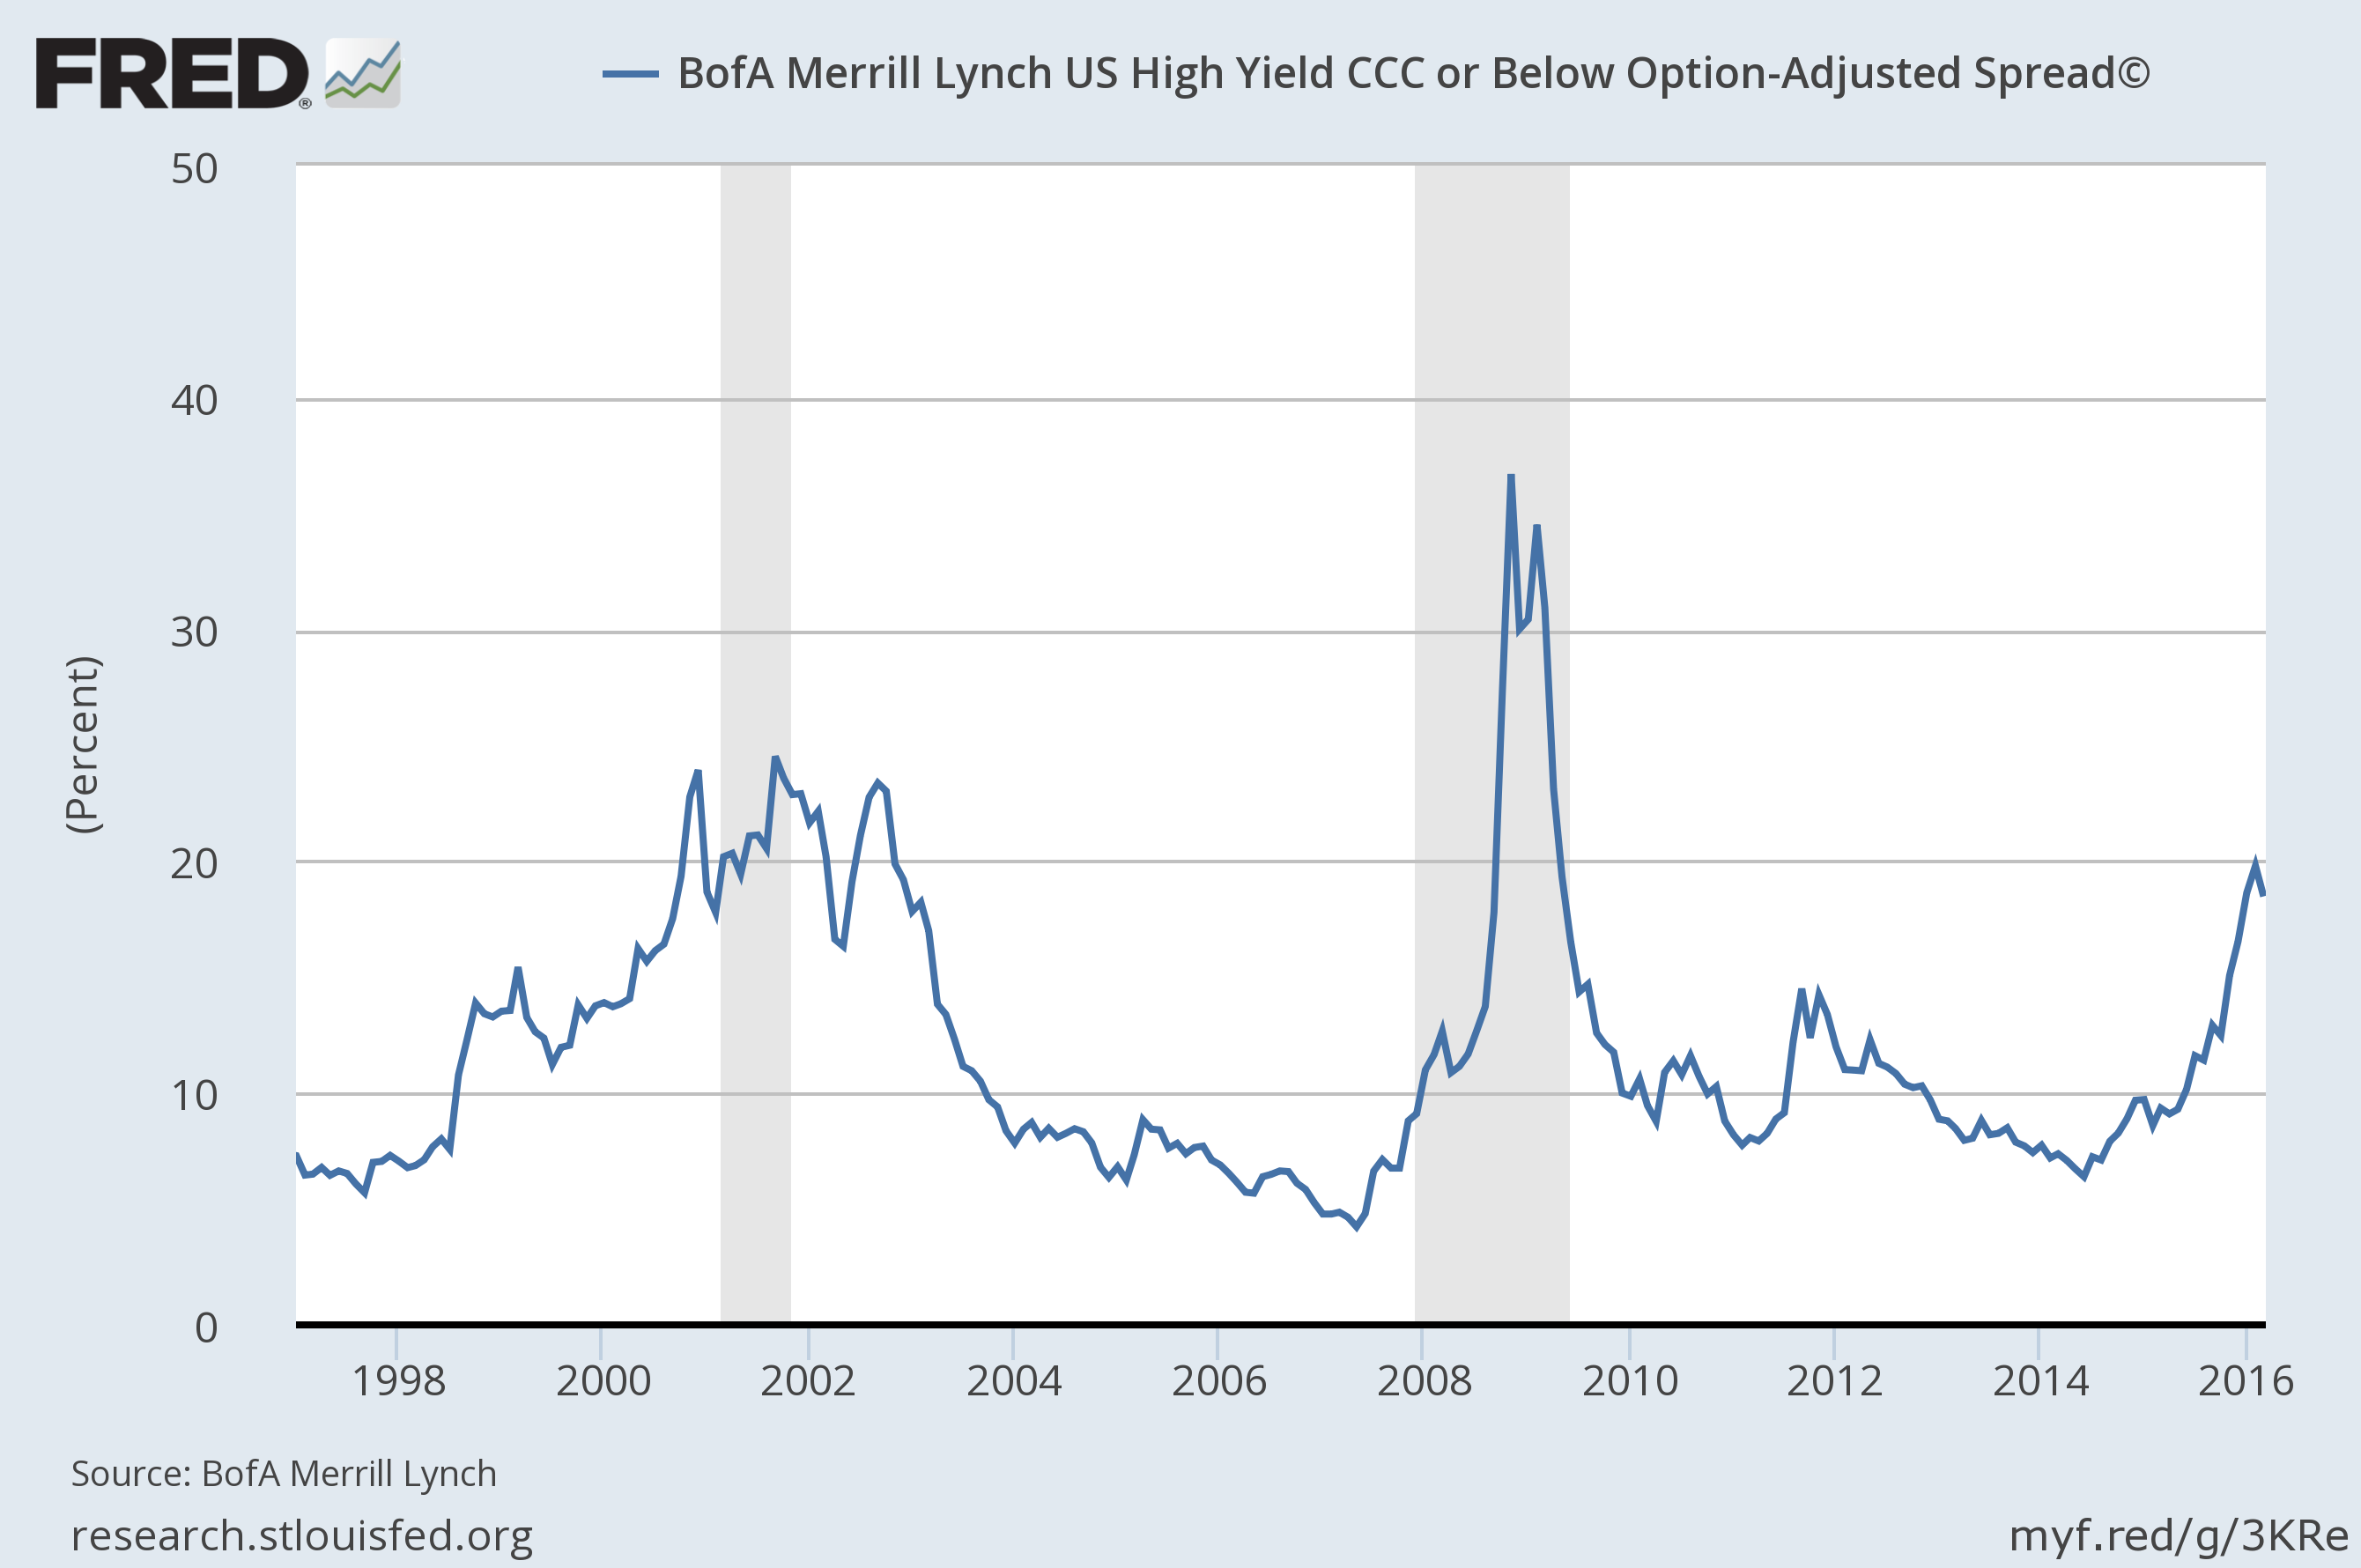
CCC spreads narrowed too but are still very elevated
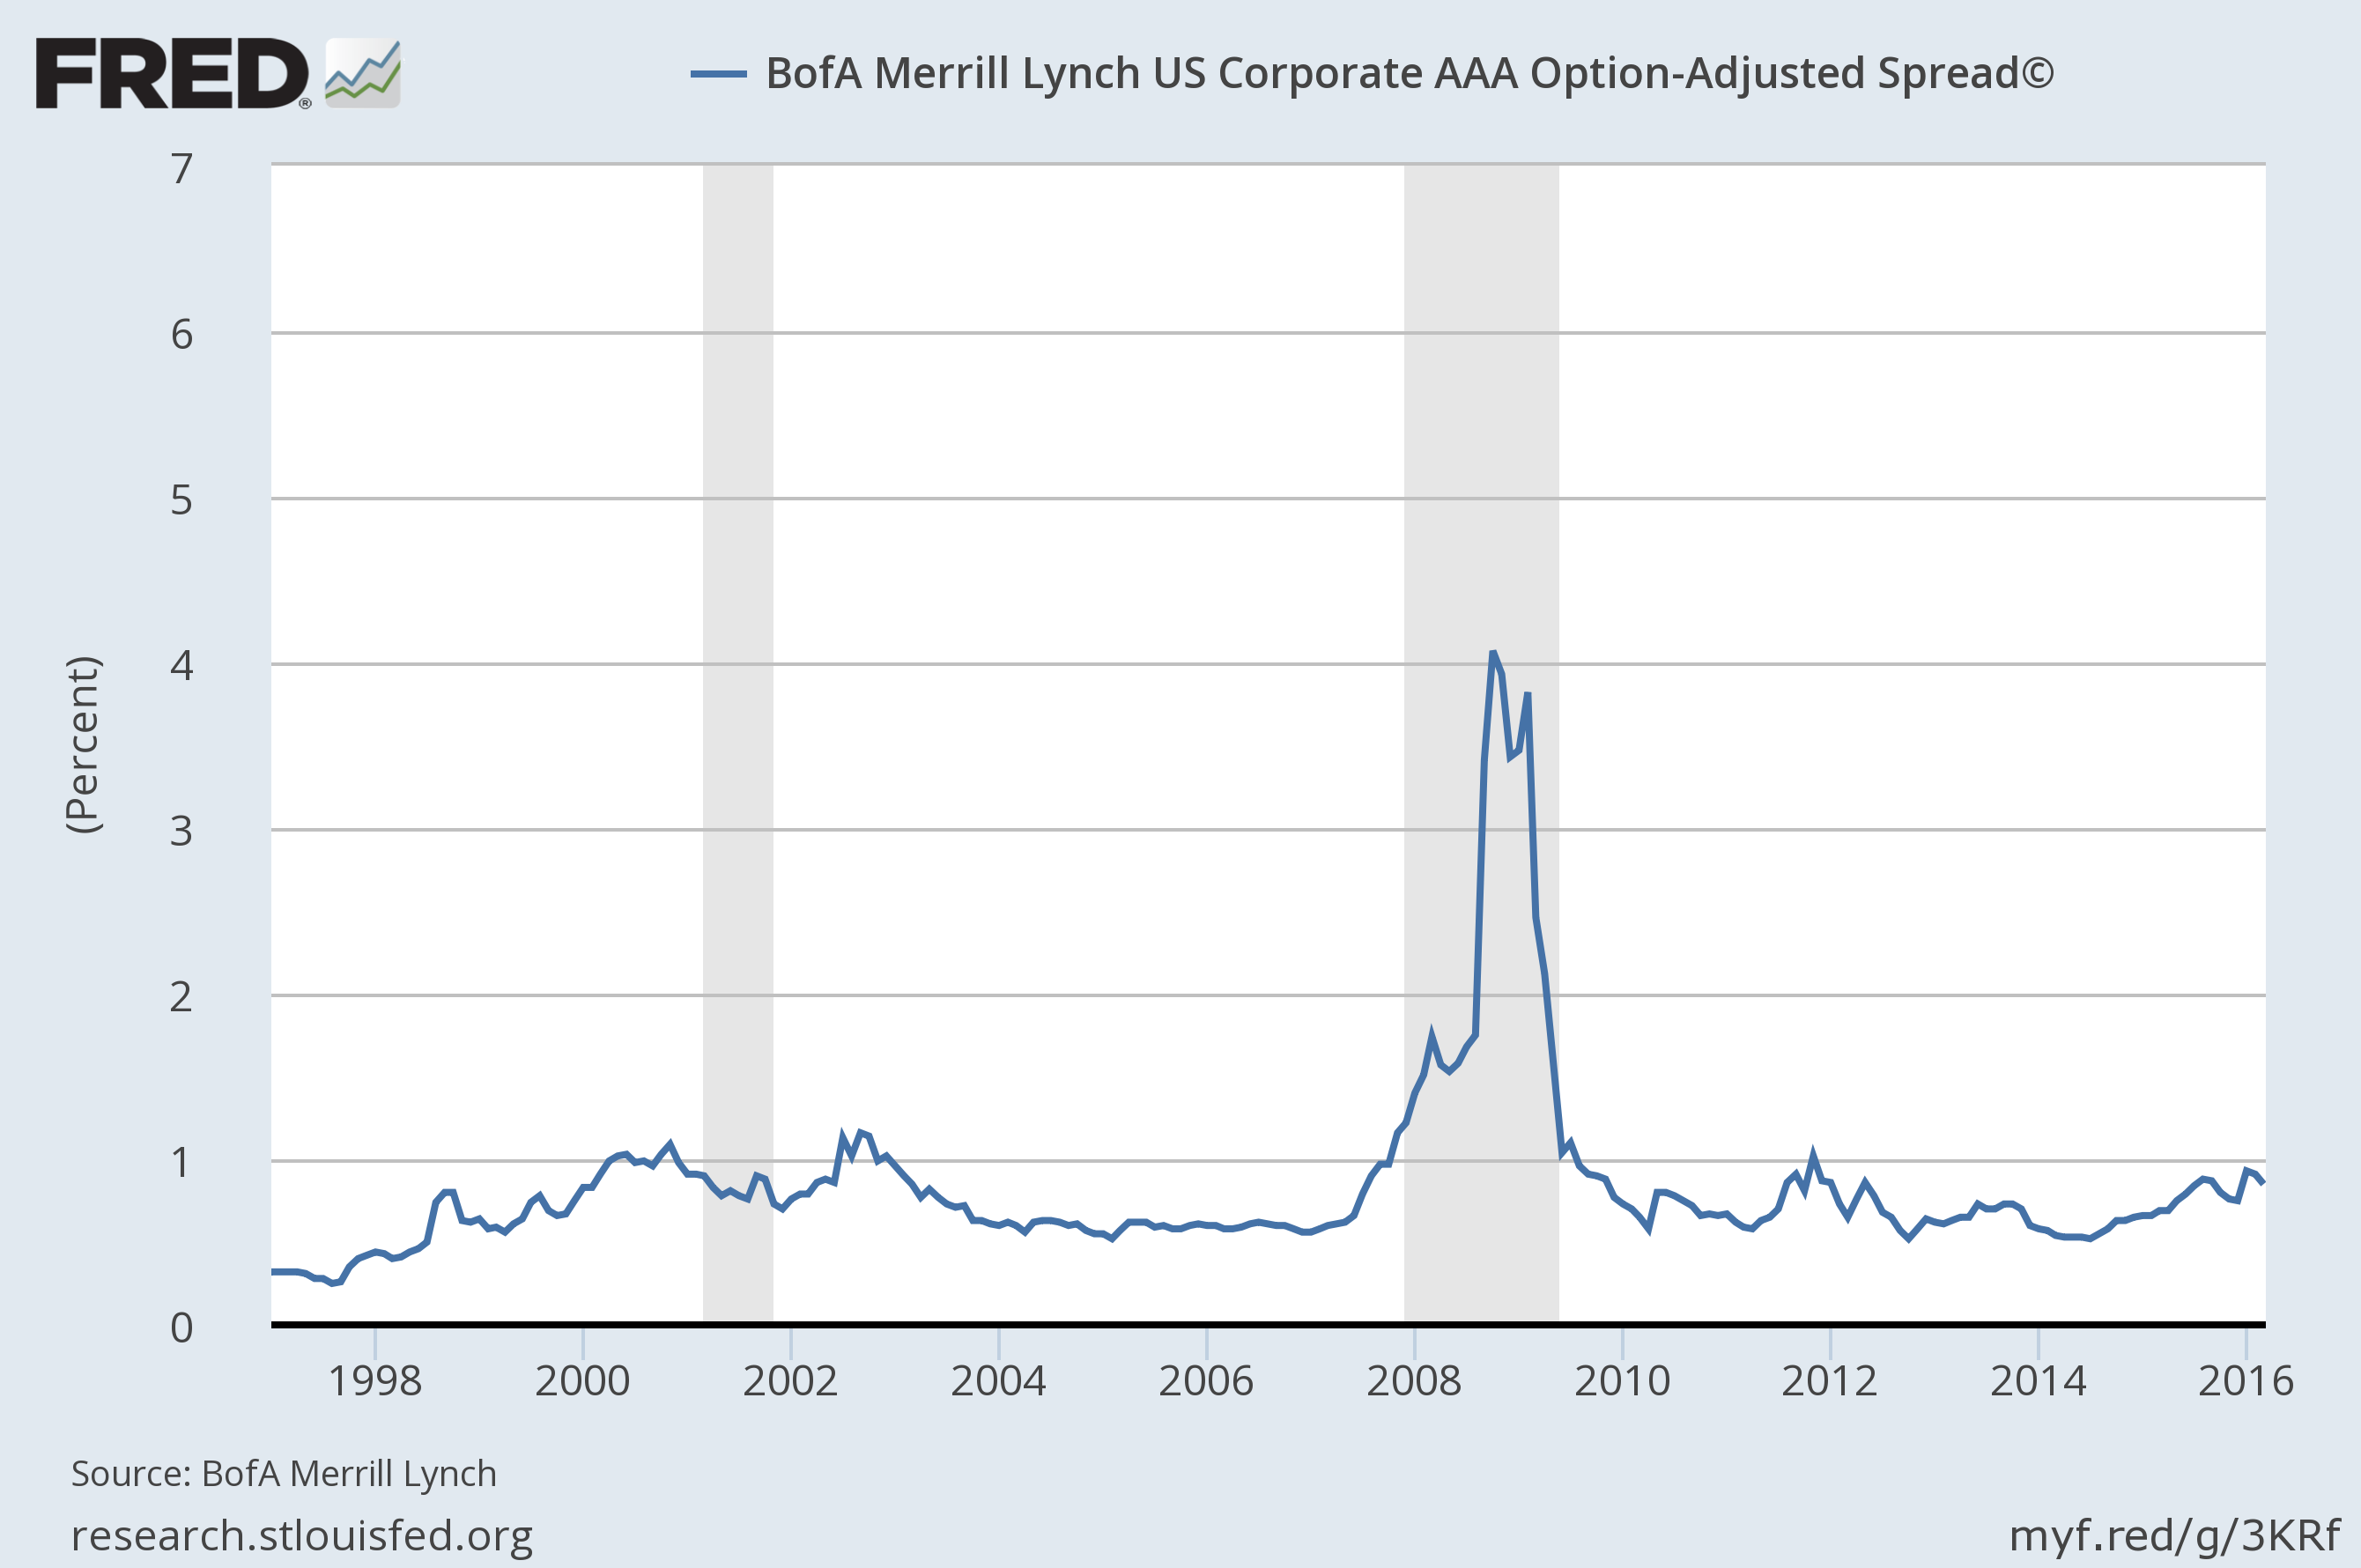
AAA spreads narrowed but are still near recession levels, a function of XOM bonds:
Yield Curves/Bonds
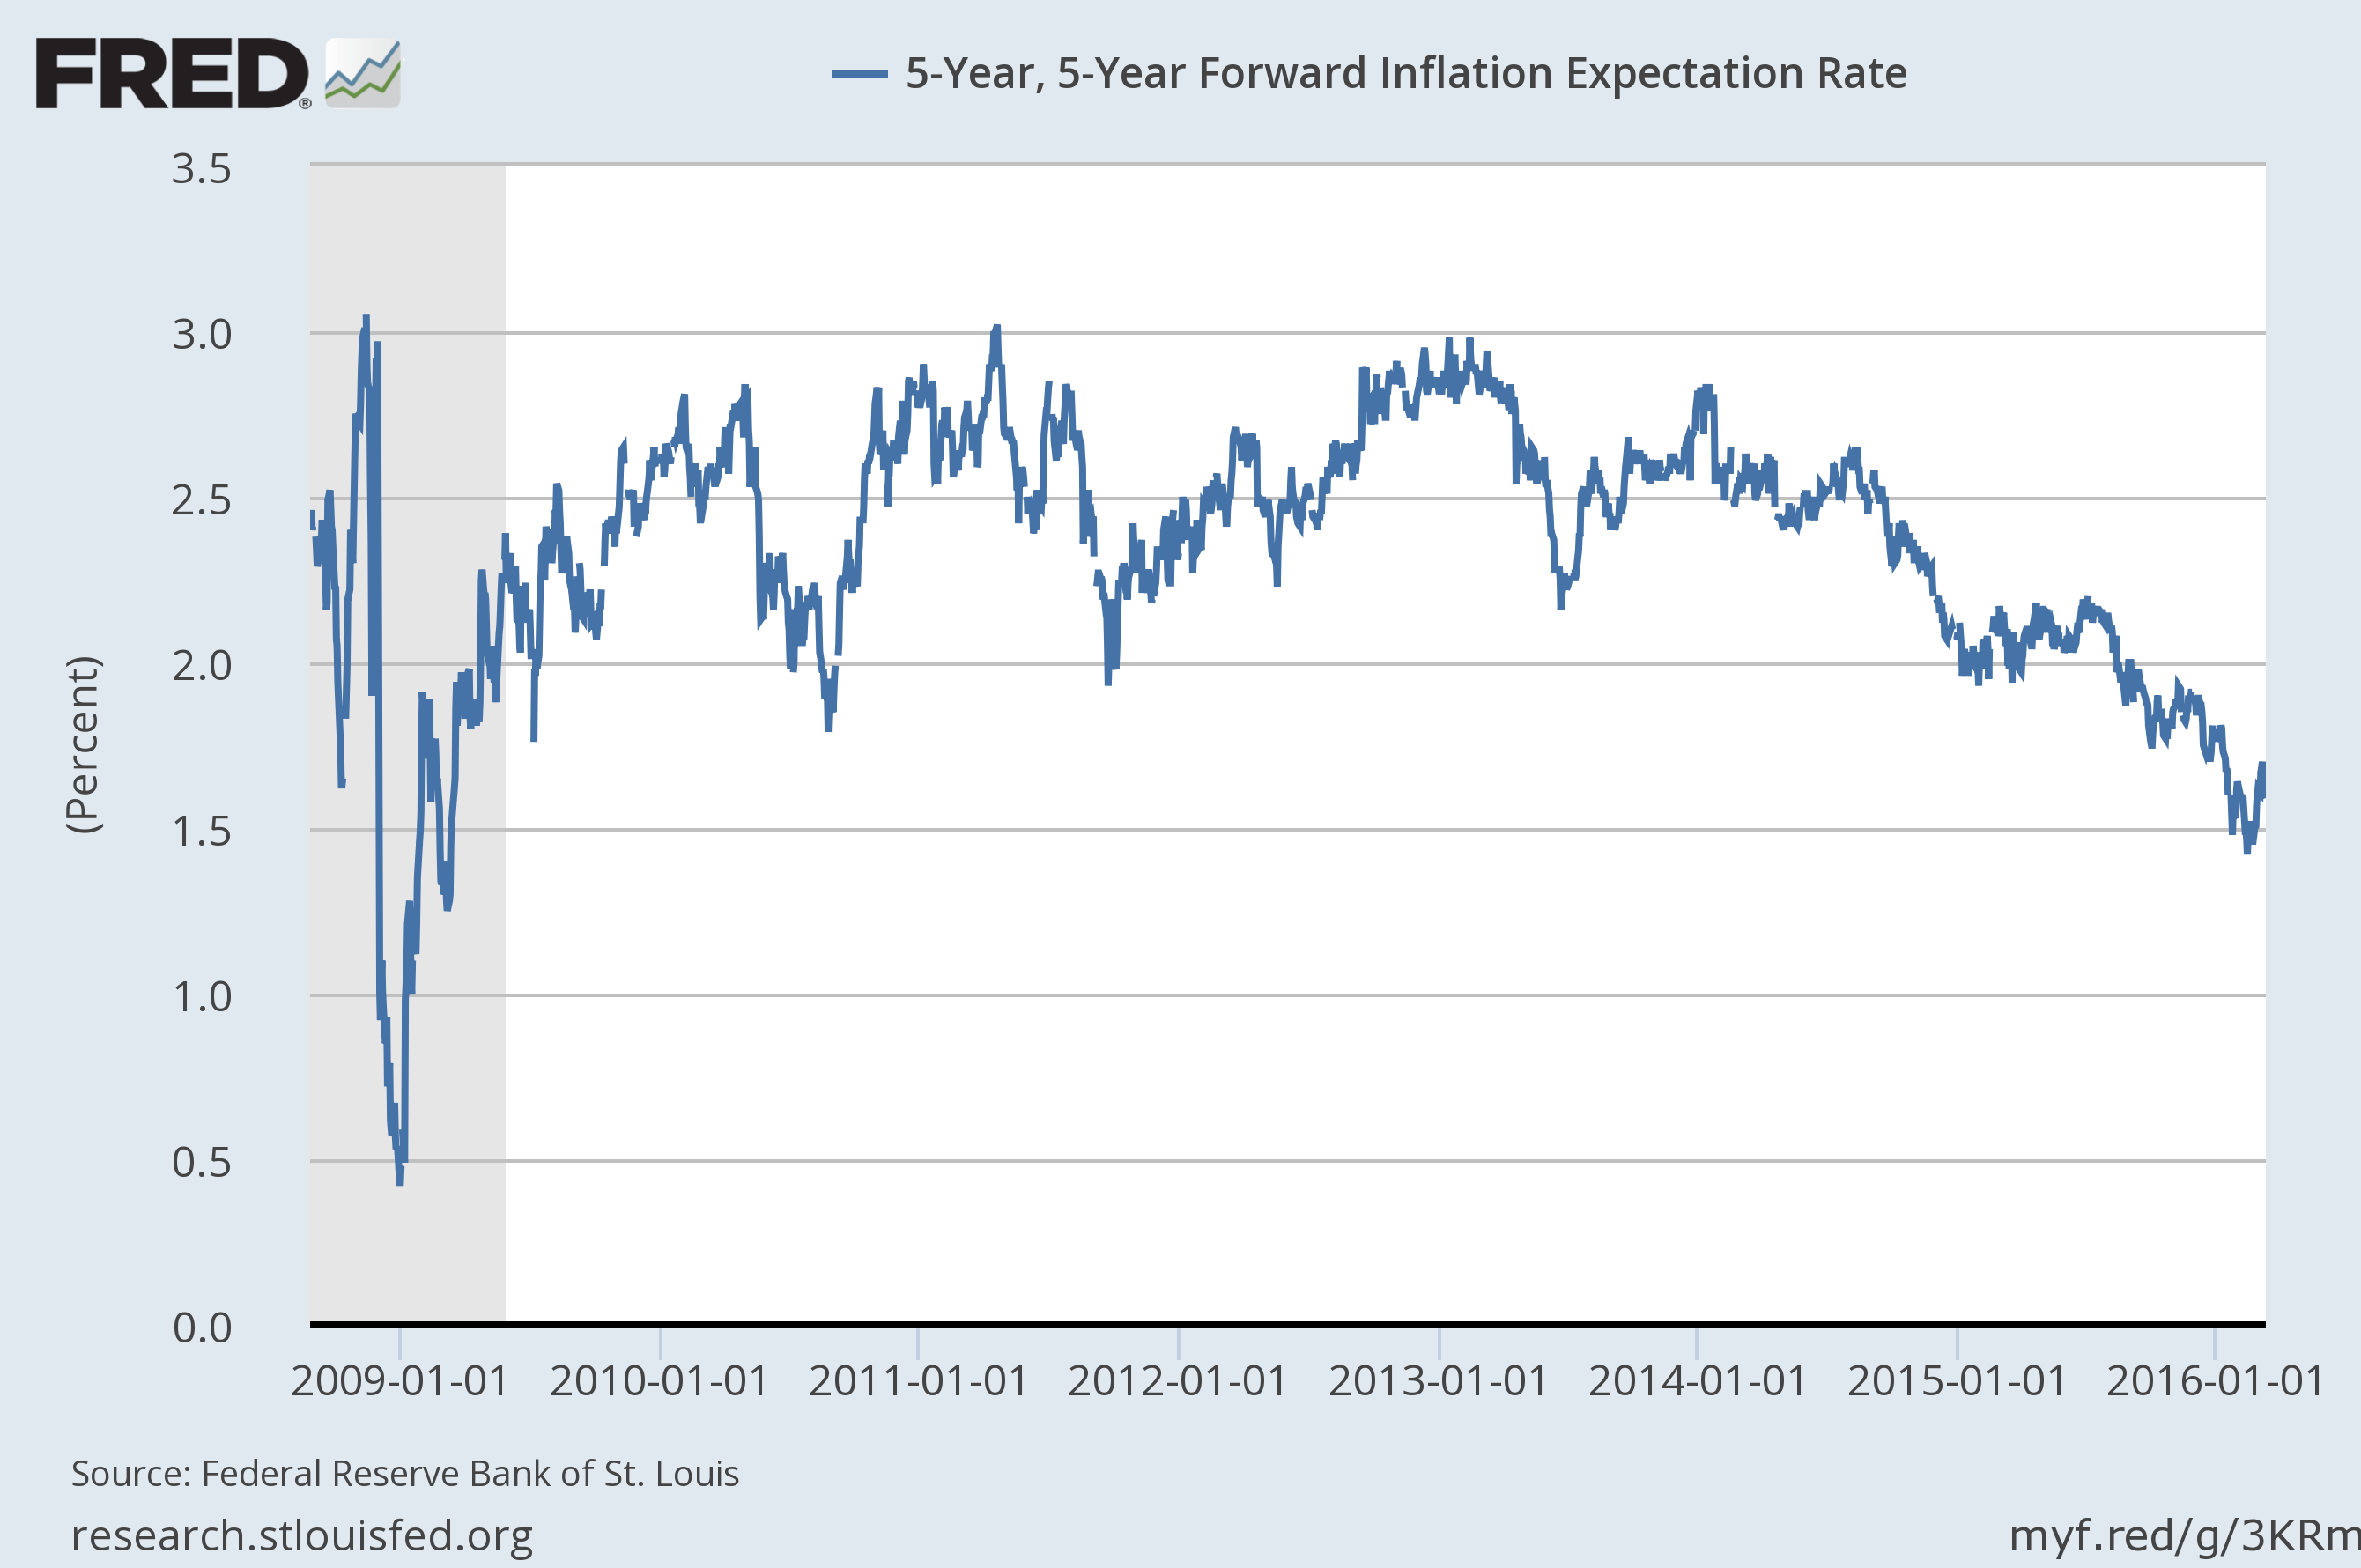
The yield curve continues to flatten as expectations for rate hikes get moved out. Inflation expectations have risen off the lows since the last update but are still quite low. Real interest rates fell as investors sought the inflation protection of TIPs.
10/2 curve is flattening but far from flat
Inflation expectations ticked up over the last month
Real interest rates briefly turned negative
Valuations
Valuations remain elevated and current earnings as well as estimates of future earnings continue to fall. In looking at other valuation measures, market cap/GDP shows a lot of foreign markets that are trading very cheap compared to history and the US. Most of Europe looks fairly cheap with Italy and Russia particularly cheap – and for pretty good reasons. Spain still looks cheap at about 80% of GDP and at least it is growing and the economy improving, if slowly. Emerging markets, as noted here before, are the cheapest as a group with Brazil, Mexico and Indonesia all trading for less than 50% of GDP. Korea is cheaper than Japan where valuations are still cheap relative to earnings and book value but not as much in comparison to GDP. Switzerland still looks to be the most expensive developed market as a % of GDP.
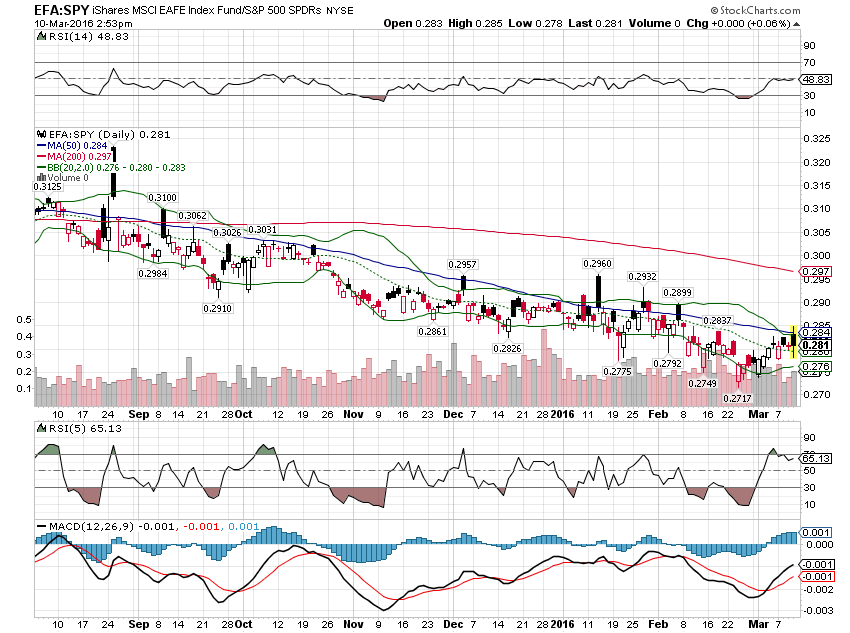
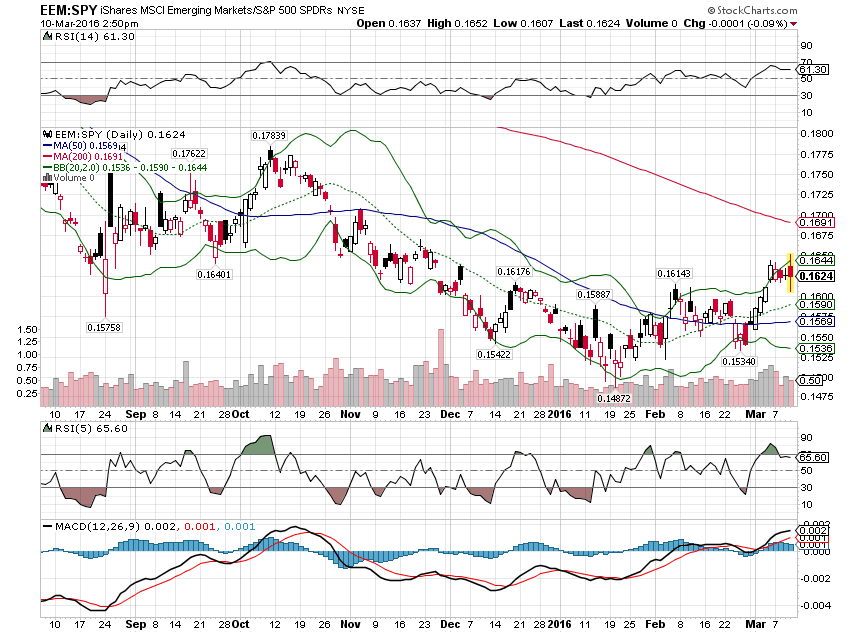
The cheaper international stock markets did outperform over the last month but the longer term trend still favors domestic markets. Emerging markets have been outperforming since mid-January, but again the long term trend still favors the US. The relative performance between international and US markets is really a function of the dollar and until the dollar trend shifts from neutral to down – assuming that real rates continue to fall which should push the dollar down – a durable trend shift seems unlikely.
A trend shift? Not until the dollar downtrend becomes more established
Emerging markets have been outperforming most of the year
Momentum
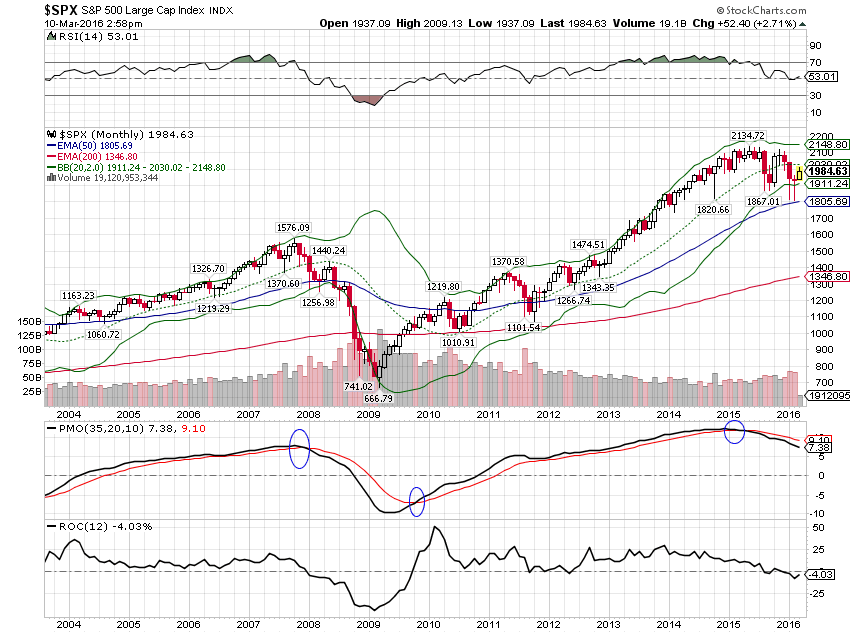
Despite the nice rally over the last month (up about 9% since the last update) momentum and the trend for the S&P 500 are still down. The downtrend hasn’t been broken and only short term momentum indicators are positive – and overbought. As I’ve been outlining over the last seven months, long term momentum has shifted to bonds and gold over stocks. The longer term trend still favors longer duration bonds over shorter durations but short term momentum has shifted. One potentially new trend is the outperformance of the GSCI versus gold. It is a very short term phenomenon at this point though and too early to invest.
S&P trend and momentum are down
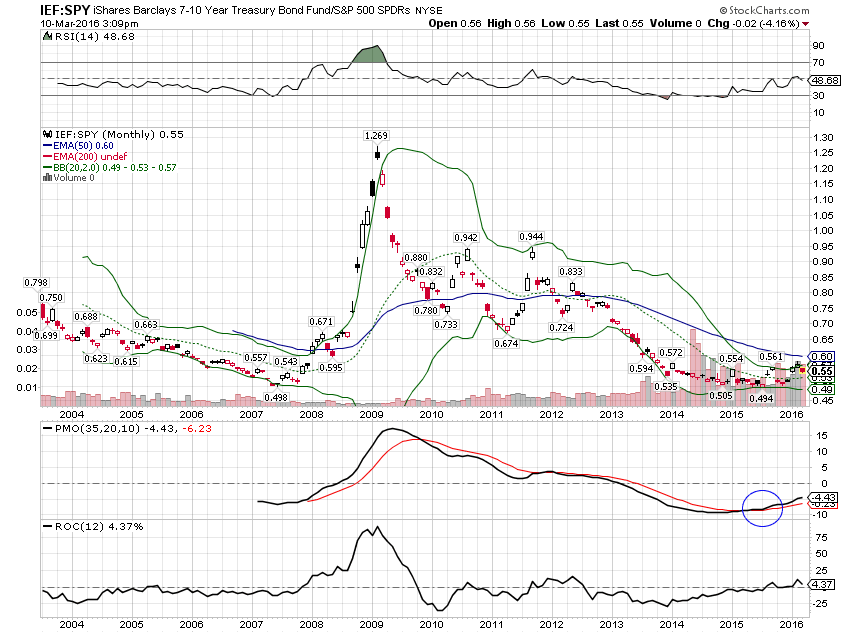
Momentum favors bonds over stocks
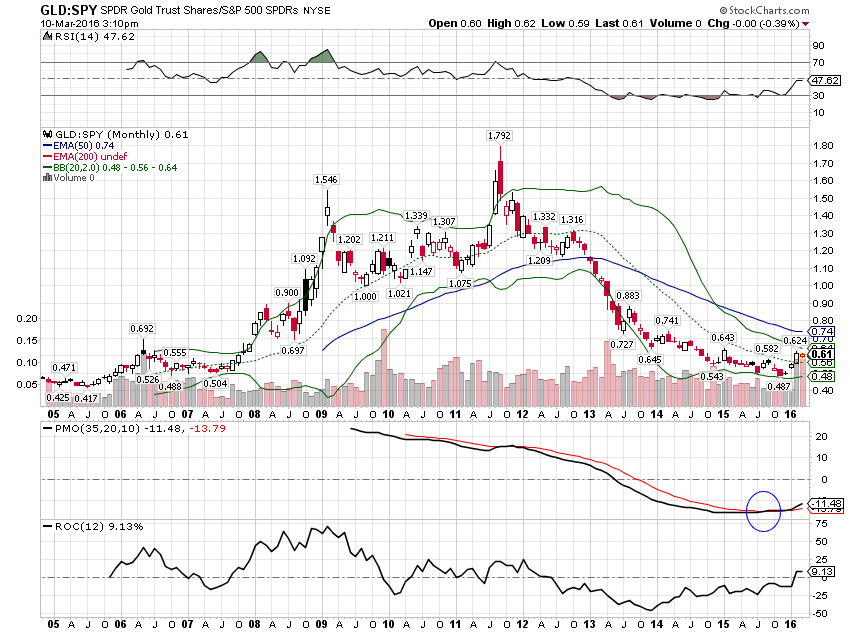
And gold over stocks as well
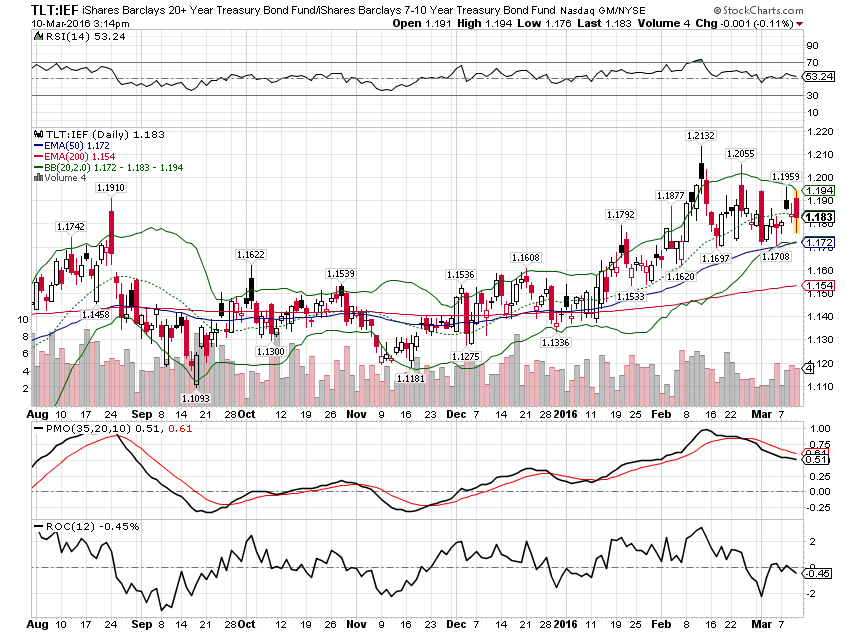
Longer duration bonds are outperforming shorter durations although short term momentum has rolled over
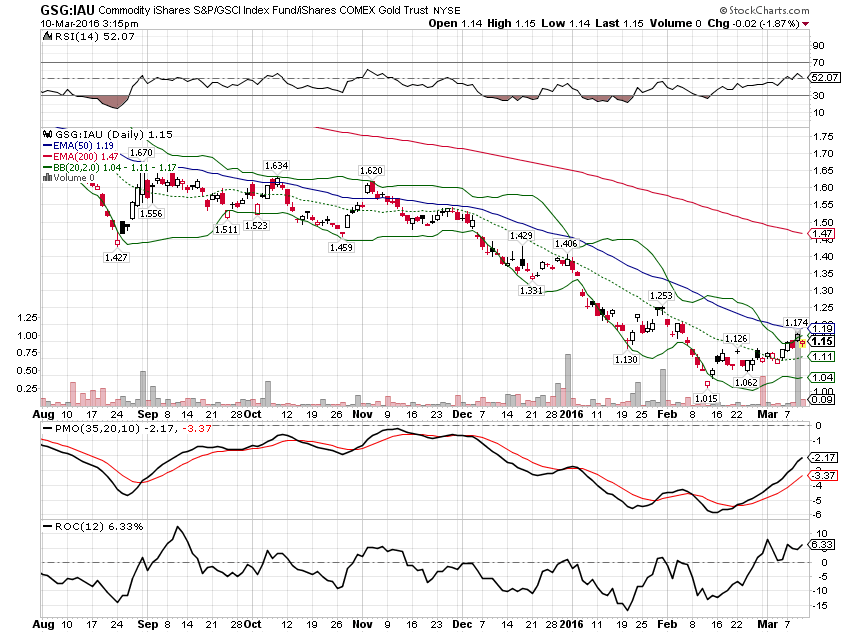
A general commodity index has started to outperform gold over the last couple of weeks. Very early but worth keeping an eye on
Other Relative Performance Observations
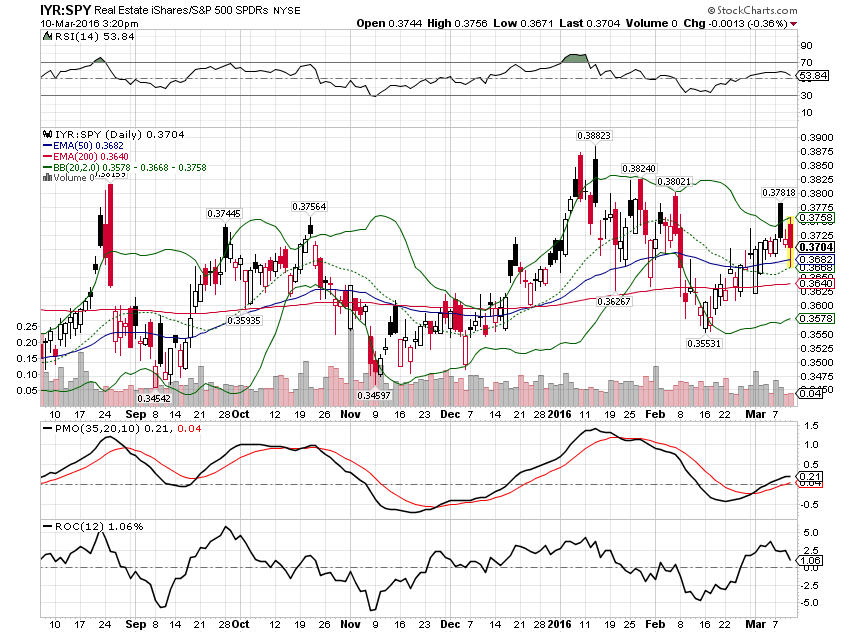
REITs outperformed during the recent rally
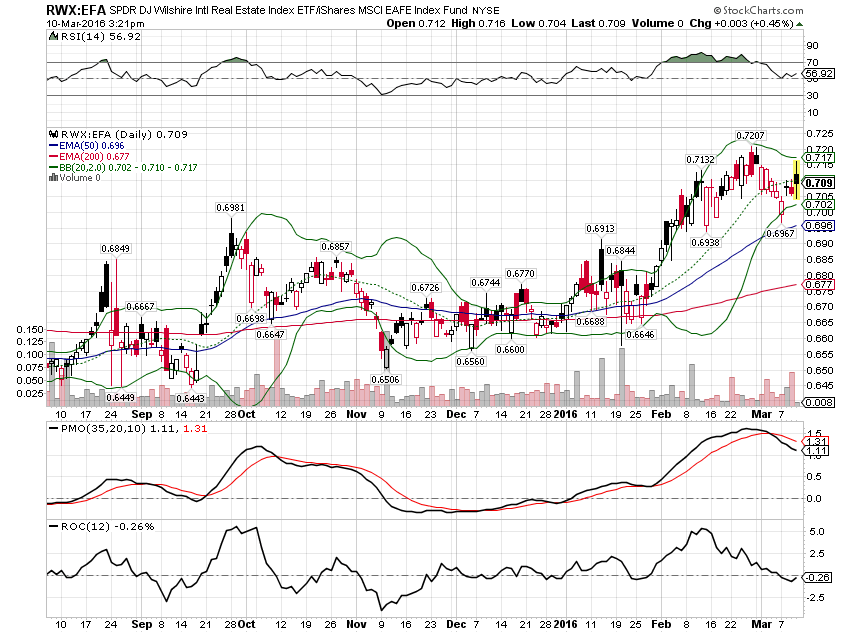
International RE also outperforming EFA
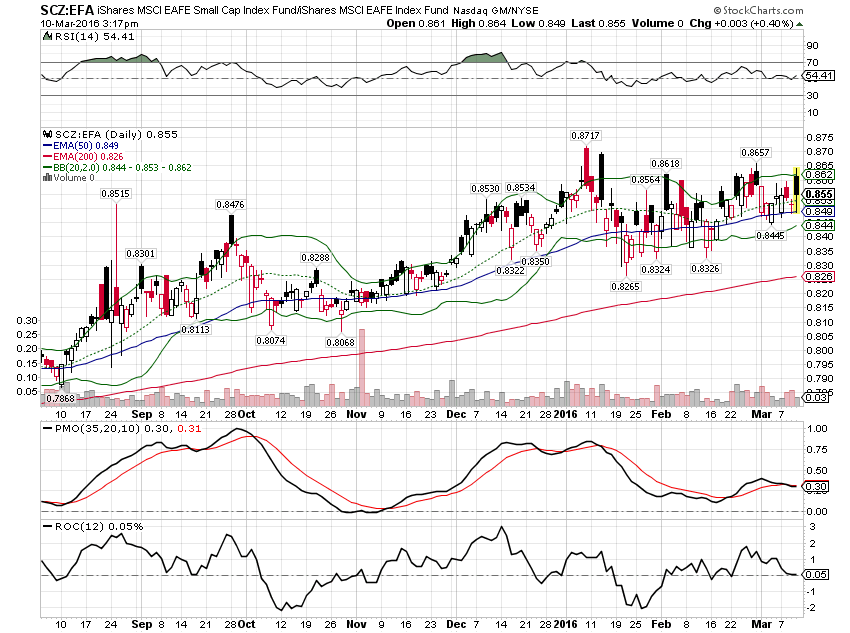
EAFE Small cap still outperforming Large Cap
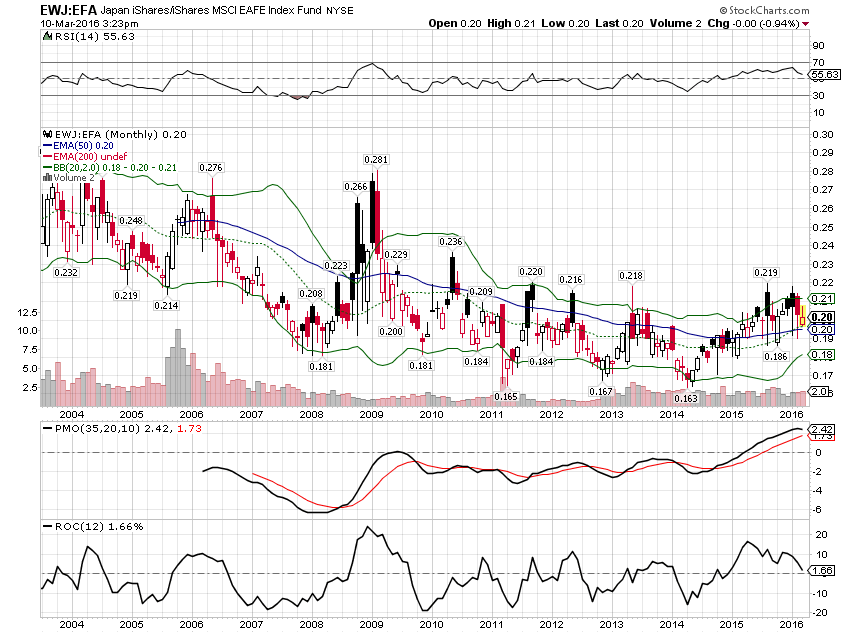
Long term momentum still favors Japan over EAFE
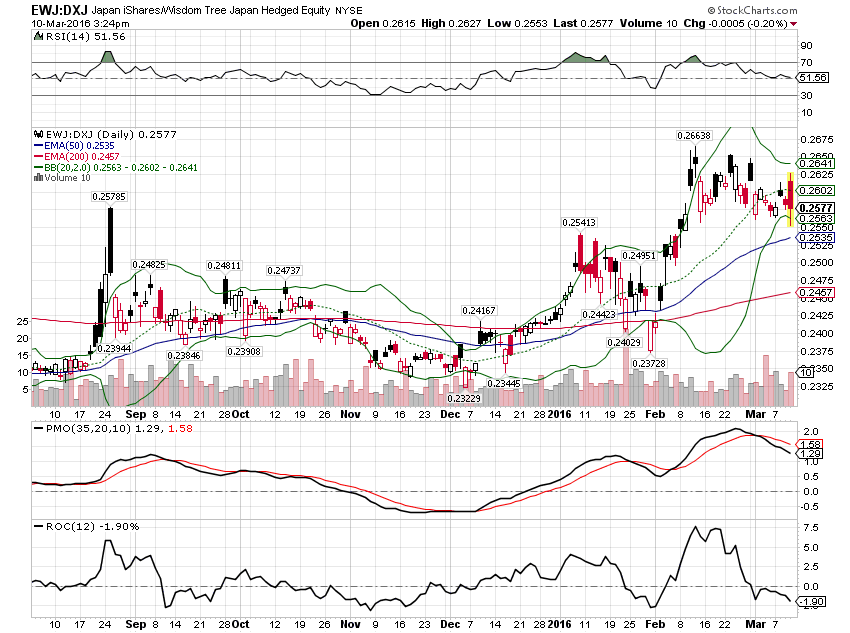
The unhedged version is now outperforming with the Yen firming
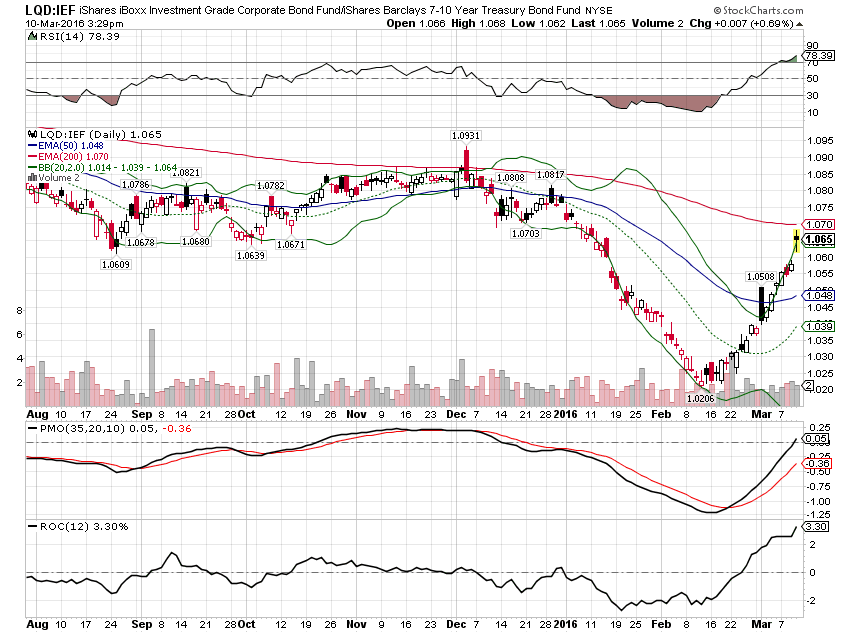
And one last one; IG corporate bonds strongly outperformed Treasuries over the last month
I am making no changes to the allocations this month.
For information about other risk based asset allocations or any of our other tactical models, please contact Joe Calhoun atjyc3@4kb.d43.myftpupload.com or 786-249-3773. You can also book an appointment using our contact form.
Some of our tactical models, including the other risk based asset allocation models and our individual stock model portfolios, are included in our subscription service available through Seeking Alpha.
Click here to sign up for our free weekly e-newsletter.
“Wealth preservation and accumulation through thoughtful investing.”
This material has been distributed for informational purposes only. It is the opinion of the author and should not be considered as investment advice or a recommendation of any particular security, strategy, or investment product. Investments involve risk and you can lose money. Past investing and economic performance is not indicative of future performance. Alhambra Investment Partners, LLC expressly disclaims all liability in respect to actions taken based on all of the information in this writing. If an investor does not understand the risks associated with certain securities, he/she should seek the advice of an independent adviser.
Stay In Touch