
The front end of the oil price complex continues to get all the attention because it seems to further the more optimistic narrative. It is the back end, however, that is most significant. The nearer maturities of the futures curve reflect more the funding environment than the fundamental view of oil and the economy. The lack of continued liquidation has “allowed” investors (and speculators who are no longer, apparently, deserving of mainstream scorn) to bid up the front, but the outer years remain flat and unimpressed.
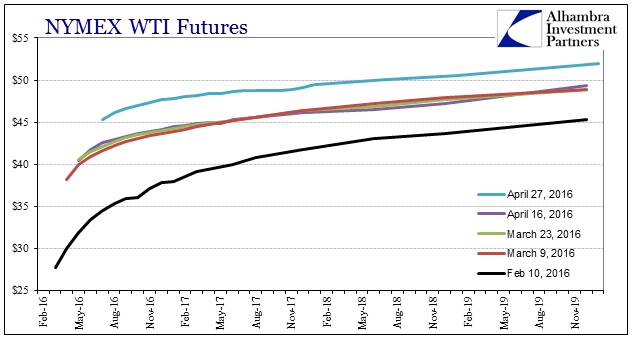
The entire curve has moved higher, to be sure, but the $6 or so in 2018 maturities and out isn’t nearly as impressive as the $18 at the front. Viewing the curve as it is now compared to what it was entering the last liquidation wave, however, reveals the changed disposition especially upon more macroeconomic considerations.
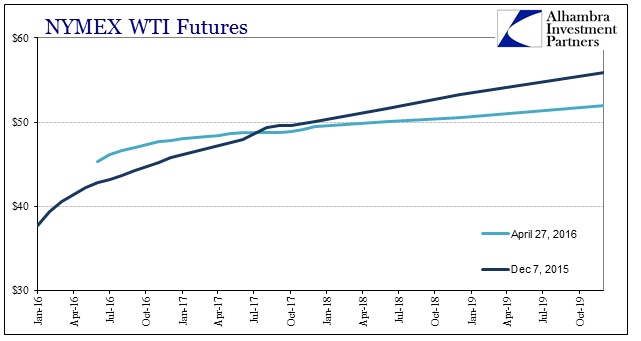
The steepness is almost gone with the flattening centered around $50. At one time not all that long ago, such a low level was unthinkable. A year ago, the curve was settling more toward $65 to $70. The difference is reality, where the gravity of desperate funding “pulled” on the front end leading in anticipation of what we see now, where the back end followed to confirm the depressing “dollar” instincts. The crude or energy imbalance is widespread now, historic in its level, and, more importantly, continuing to get worse. Thus, the flatter curve at $50 is, in view of the past few months, maybe as optimistic as it can be.
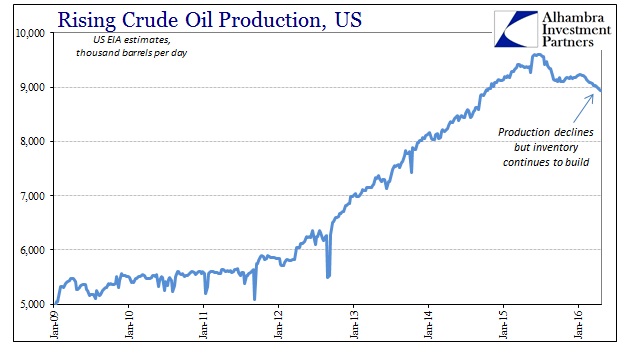
Production levels in the US have started to decline and steadily at that. No matter the shrinking supply (or even normal seasonal patterns), however, the total inventory of crude oil continues to set new records. Since the end of September 2015, the US EIA reports that total inventory (not including the SPR) has ballooned by a further 86.6 million barrels.
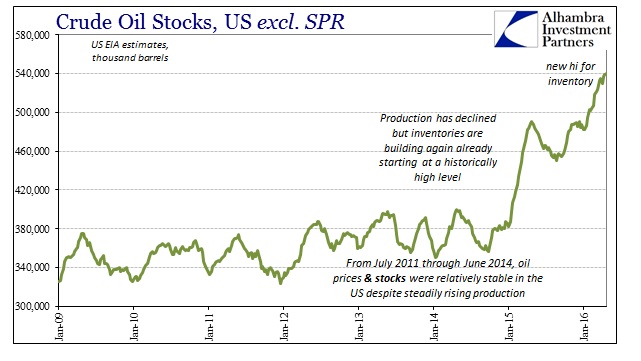
Over those 31 weeks, inventories have been drawn down in only five of them, meaning a steady and consistent buildup no matter the usual historic pattern. It hasn’t been just crude oil, either, as gasoline inventories likewise build though more so along with regular seasonality only adjusting upward compared to the past several years.
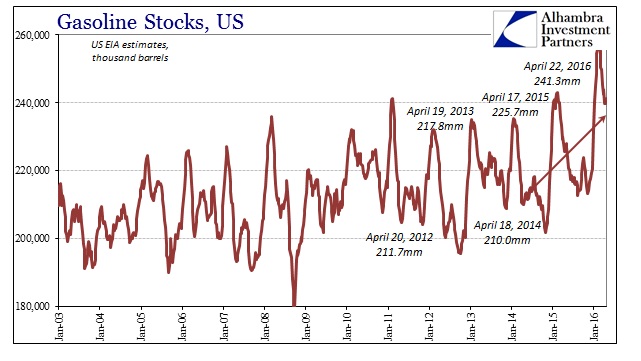
Gasoline inventory in the latest week is 7% more than the same week in 2015, and 15% above the same week in 2014. These are all very pessimistic fundamental balances that negatively reflect on the actual economic circumstances. The flat and low WTI futures curve further confirms that the overall slowdown (since 2012) amplified into steady if so far nominal economic contraction during this period. It has taken a little longer to see it in Apple’s revenue or in FOMC statements, but it has been working and widespread for more than a year and a half already. With curve as it is, there isn’t much expectation for that to change.
Stay In Touch