
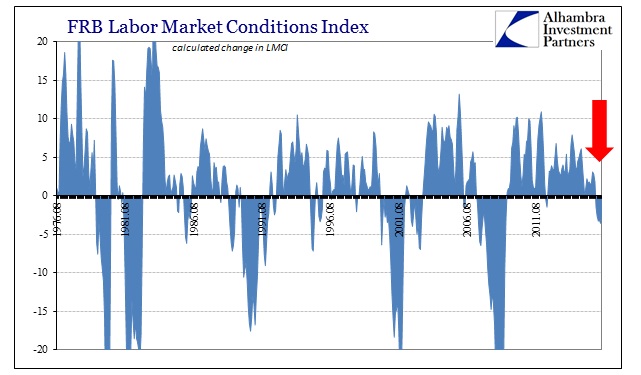
Even with the huge turnaround in the Establishment Survey’s headline number in June, the Fed’s alternate factor model could not manage a positive number. It was an improvement over May (revised), but nonetheless the sixth consecutive month of contraction. The monthly figures have been revised more pliably this year, but overall the view of the labor market from the Fed’s LMCI is much different than what they claim in public.
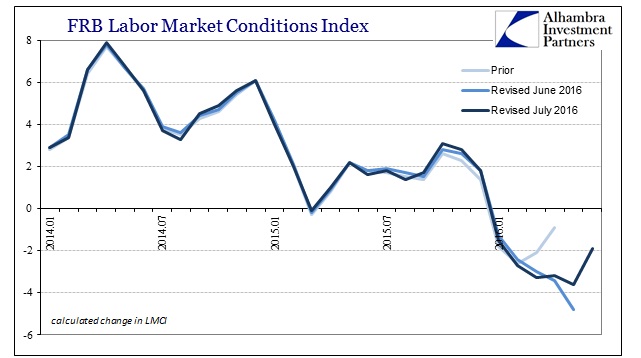
Since the start of 2015, the LMCI model shows a dramatic slowdown that at the end of last year turned quite negative. Unsurprisingly, this fits comfortably within the monetary view of the global economy under the “rising dollar.” The December 2014 reading was (revised) +6.1% seemingly in line with the mainstream view of the US economy that was about to complete its recovery and bask under sustained growth. Just three months later, however, the LMCI change dropped to -0.1%, the first negative reading since the 2012 slowdown.
Then, like the apparent recovery represented by the mainstream term “transitory”, the employment index rebounded but only partially; and it was the rebound itself, again like in financial markets, that would ultimately prove to be transitory. By October 2015, the LMCI indicated a weaker 3.1% local peak before dropping precipitously lagging the eruption of “global turmoil” last August and coincident to its last outbreak through January and February.
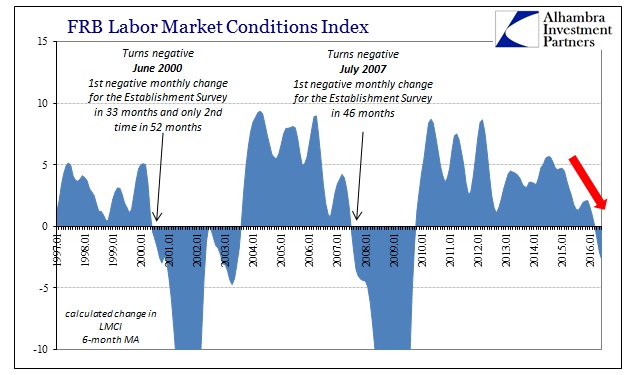
That has brought the 6-month average down to -2.7%; the last time the average was that low was September 2009, and equivalent to about September 2007 and the cusp of the Great Recession on the way down. We have to keep in mind that the LMCI is a relatively new creation, meaning that it was back-tested to fit past cycles. That can be a source of bias if we are truly experiencing conditions unlike any prior cycles including the Great Recession, especially if we are trying to determine a cycle peak where neither of those words might apply.
Even in that condition, however, there would still be value in associating relative performance in the attempt to tease out any meaningful comparisons. In other words, the 6-month average suggests a labor market like autumn 2007 or summer 2000, but even if that doesn’t mean recession is right around the corner (while still not precluding the possibility) it still provides us with significant context about how far this elongated cycle or monetary strangulation (non-cycle) may have progressed.
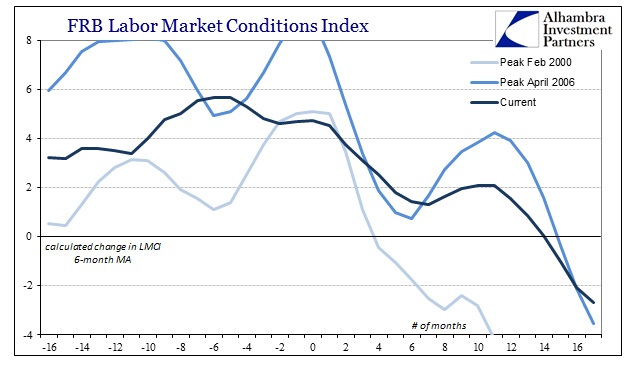
It makes for a very interesting contrast particularly given the supposedly strong rebound in labor in June at least as far as the Establishment Survey is concerned. Because the LMCI model is back-tested it seems to be calibrated such that a sufficiently negative (in terms of prolonged contraction) condition aligned in the past with a hard inflection in the Establishment Survey. This time, however, there seems no discernable relationship at all; meaning either the cyclical “rules” no longer apply in the LMCI setting or the Establishment Survey is off in a world all its own (with the unemployment rate). Worse, for the sake of analysis, those two possibilities are not mutually exclusive.
Despite the lack of clarity, it seems very reasonable that the labor market may not be at all robust as is projected in the headline payroll statistics. That much we know given the state of the world, especially manufacturing and the “goods economy” not just in the US but all over. Again, the LMCI seems to have picked up the “rising dollar” and its descent into “global turmoil” that is missed in the focus on the isolated monthly Establishment Survey variation.
But that might be just a false comparison, as the true apples to apples relationship might be better established by each respective trend. The mainstream is fixated on the monthly number, but that should not mean we make the same mistake. The trend in the payroll numbers in 2016 is at least sympathetic with the overall direction of the LMCI – and has been that way also since late 2014. We find in both, as usual, the downward trend is conspicuously uneven but no less overall downward. But because it isn’t straight down in the typical cycle “V”, commentary exhibits an almost bi-polar treatment especially as monthly numbers go from one extreme to the other.
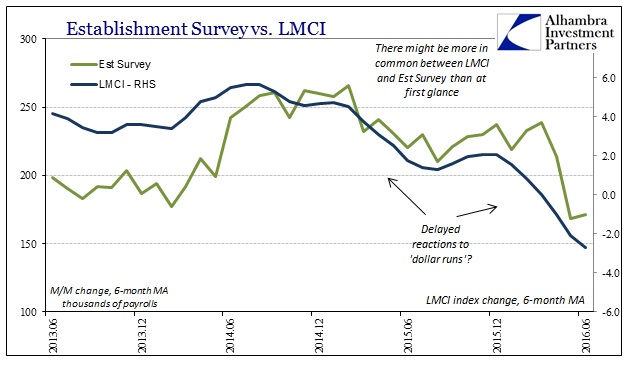
In that respect, there might not be as much separation between the LMCI and headline payroll figures, at least in terms of direction and maybe even timing, than it might first appear. The problem can thus be condensed into two seeming divergences, only one of which is significant. The Establishment Survey starts from an unusually high perch, which is highly questionable given the true state of the economy in 2014. The other problem is simply mainstream commentary, particularly in the orthodox view that is far more charitable to the recovery narrative and therefore downplays “bad” months in favor of those deemed “good”; like June 2016. In reality, what is meaningful is not that the labor market has really good months but rather that there are so many “bad” months in the first place (the uneven nature of this slowdown) to seemingly even them out (at best).
Instead, what might be at odds or at least left to be determined is what such a “rising dollar” slowdown actually means for the immediate and intermediate economy. The mainstream is looking for a binary answer to recession or not recession; that might be an inappropriate and misleading context. Instead, it might be better to simply realize the commonalities between the Establishment Survey average and the LMCI average both suggesting a labor market that is getting, on the whole, worse and leaving it there. Figuring out what “worse” actually means, especially in this global monetary framework, is simply beyond these statistics.
Stay In Touch