
The personal savings rate rose slightly in August, though as I have shown before in truth we have no idea what the actual savings rate might be. The revisions to it over the years have made it one of the least reliable indications in the economics catalog. The reason is the suddenly frequent tendency of the BEA to seriously revise both income and spending and not at the same time. Revisions are a fact of economic statistics, but what has occurred in these series truly strains any already dubious notion of precision.
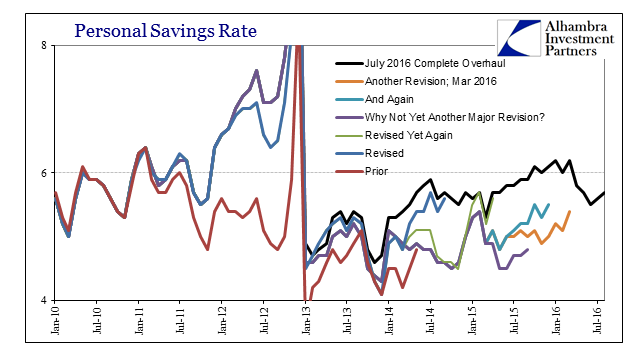
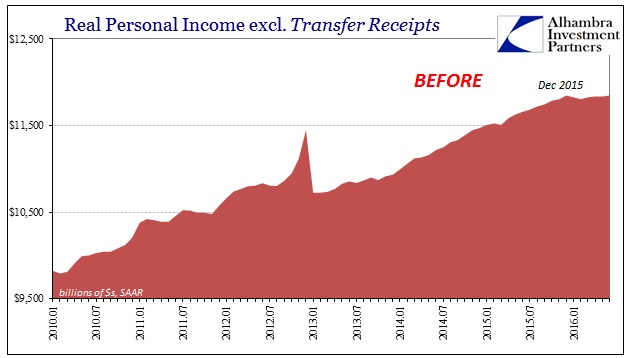
On the income side, the data series that draws the most serious attention is Real Personal Income less Transfer Payments. This is one of the four economic accounts that the NBER uses to analyze the business cycle. Before significant revisions last month, the trend showed a clear break around last December. It wasn’t a straight drop into contraction as you might expect (if you were the NBER) of a recession, but it was enough to warrant or validate suspicion about the economy and especially the narrative that this year would be so much better than last year.
Revisions over the last two months have softened what might be a real disturbance, but it still remains overall as does the clear slowing even though inflation (“real”) remains suspiciously subdued.
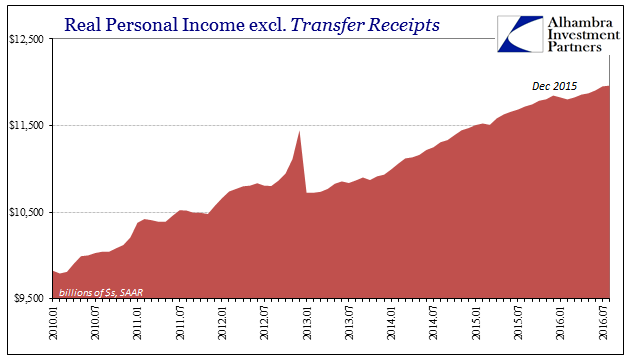
As of the current figures, Real PI ex Xfers was barely more in August than July, once again indicating that the economy is weaker in 2016 than even 2015; so much that this slowing of the slowing has almost surely taken an imprecise toll on even the labor market.
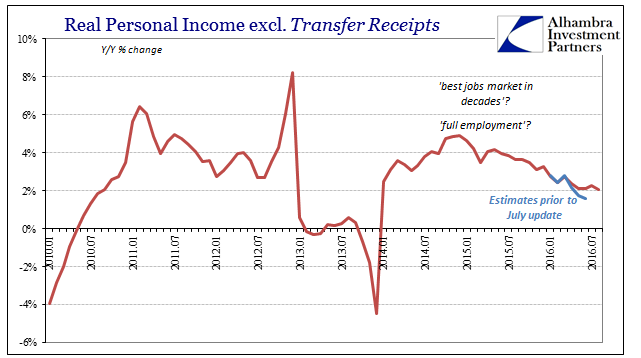
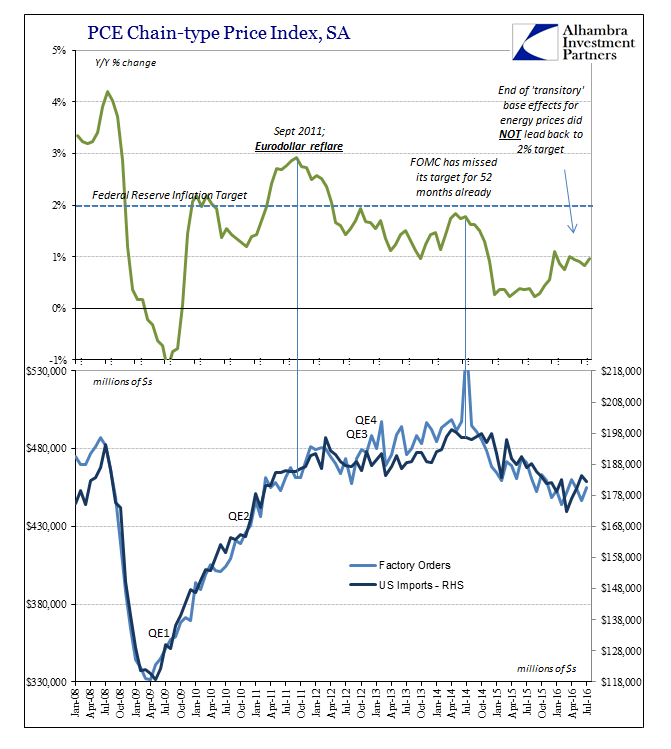
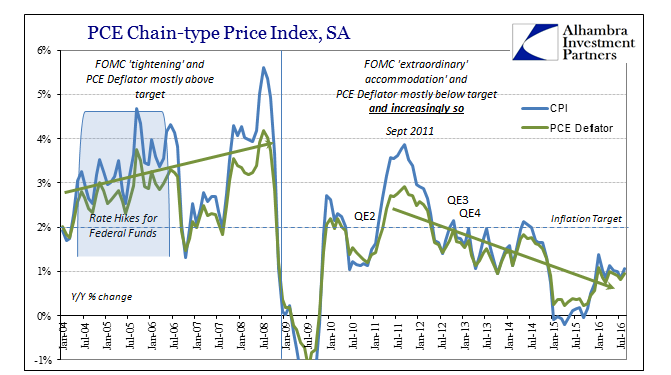
As the labor market and the aggregate gains in national income (perhaps) slacken, it further confirms the monetary view of the economy as expressed by the PCE Deflator. By the Fed’s own standards, it professed that the deflator in this series was the most accurate (such as that may ever be the case) measure of inflation available. When it decelerated sharply to start 2015, that was believed to be nothing more than the “transitory” effects of just oil prices reflecting the “supply glut” of too much success.
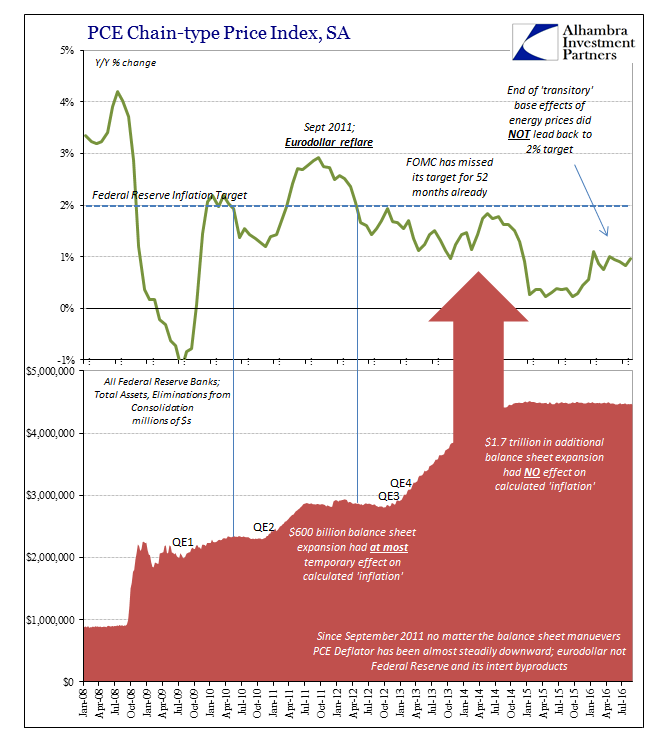
That contention was made even though by that point measured inflation had been steadily under the Fed’s 2% target for several years already. The idea of “transitory” was simply that enormous balance sheet expansion could not be suppressed for long, as surely so much “money printing” would impact the economy in the same predictable manner as money printing always had. In the last two QE’s alone, the eventual quantity was $1.7 trillion, thus far more than enough “Q” to obtain clear effects of “E.”
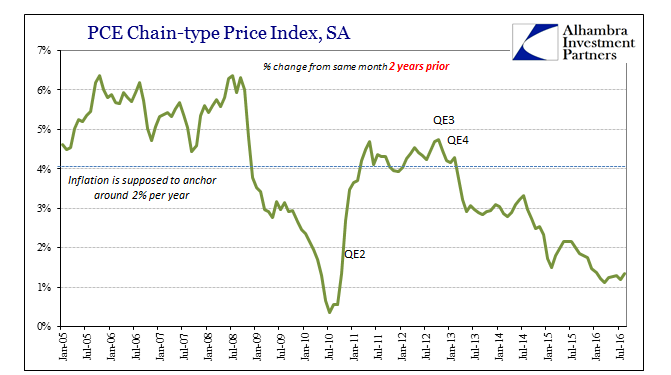
Turning into 2016, however, it just didn’t happen. Worse, the PCE Deflator continues to be subdued this year on top of last year. In what can only be classified as devastating evidence against QE as money printing, the two-year cumulative change in consumer prices is as low now as the worst parts of the aftermath of the Great “Recession.”
This has to be one big reason (if not the only reason) why the FOMC has not raised rates again. In orthodox monetarism, the long term inflation expectation is a very big deal. If people start to believe that inflation isn’t acting predictably and that relates to perceptions of monetary policy effectiveness, then the central bank and all its policies will have to work that much harder (maybe overwhelmingly so) to accomplish what it seeks to.
In reality, of course, the Fed’s problems are much bigger than even that. How is the chart above even possible with a Fed balance sheet intentionally run up to $4.5 trillion? If QE and balance sheet expansion is money printing, then what the PCE Deflator now shows is impossible, even factoring potential lags (transitory). This is confirmed by viewing the 2-year changes in historical context.
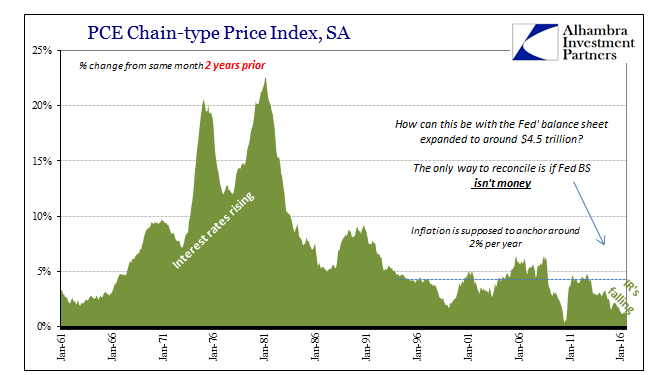
That we would find the lowest 2-year change in calculated aggregate consumer prices immediately follow the Great “Recession” is unsurprising. To calculate the current economy revisiting those lows after $3.5 trillion of QE’s and monetary policy whatnot since then is downright disqualifying of not just QE’s but money as a part of monetary policy. It just isn’t there.
If inflation expectations are indeed starting to de-anchor it is because there is every reason to suspect monetary policy is at the very least ineffective. Even the labor market statistics including Real Personal Income less Transfer Payments shows that this year has been impacted by last year’s events. In other words, as more time passes there is only less and less corroboration for monetary policy and its anticipated recovery while much, much more evidence of ongoing or even tightening monetary contraction in the real economy (and financial markets too, if more spasmodically). It’s not recession now just as it wasn’t recession then; it is all far worse than that.
Stay In Touch