
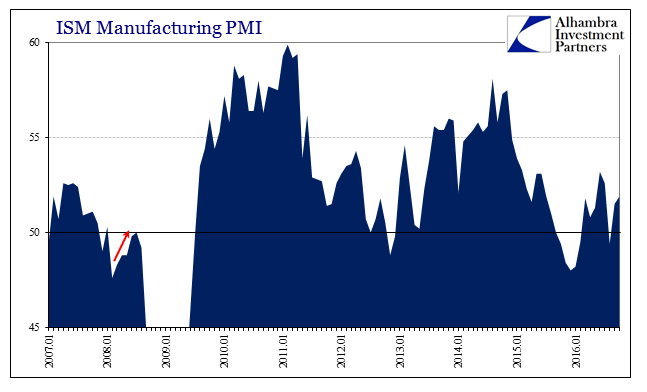
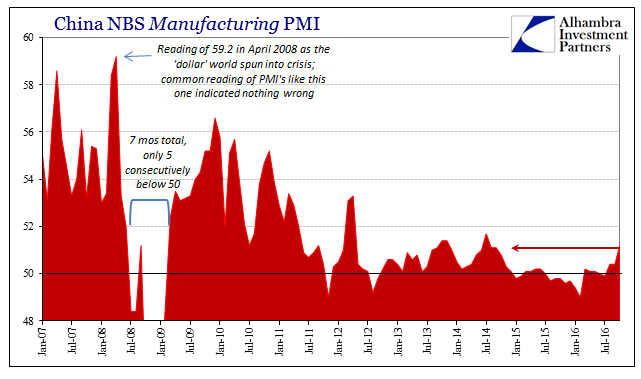
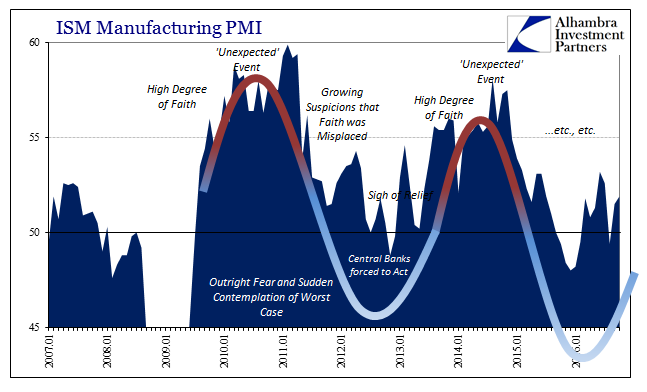
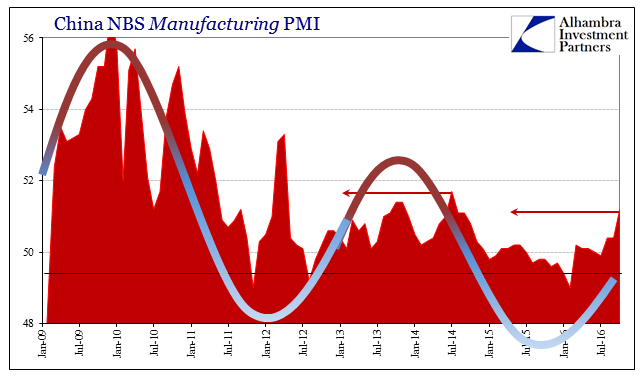
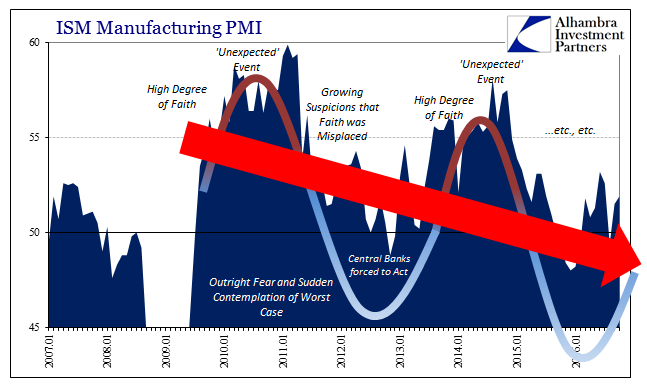
A strong cohort of global PMI’s has cheered today pretty much everyone, from economists to the media and anyone else in between. China’s official Manufacturing PMI was calculated at 51.2 in October, the highest level since July 2014, up seemingly significantly from the 49.9 just three months ago this July. In the United States, the ISM Manufacturing rose again to 51.9 from 51.5 last month, but that registers two months of what are being interpreted as solidifying gains after the August “scare” where the index dropped just below 50.
Again, the world sees these numbers as improvement when instead they show, pretty conclusively, nothing has changed. The global economy is still stuck in depression, but these statistics demonstrate what has become typical, that there are times during all this when “experts” feel a little better about it. PMI’s capture sentiment, and that is what washes out into these numbers.
The problem is as I have been writing for months, that there is great difficulty in translating these indices or any economic accounts into actually meaningful explanations. The mainstream in being wed to the business cycle filters all this data through that paradigm – and ends up confused. There is indeed cycles at work here; just not the business cycle.
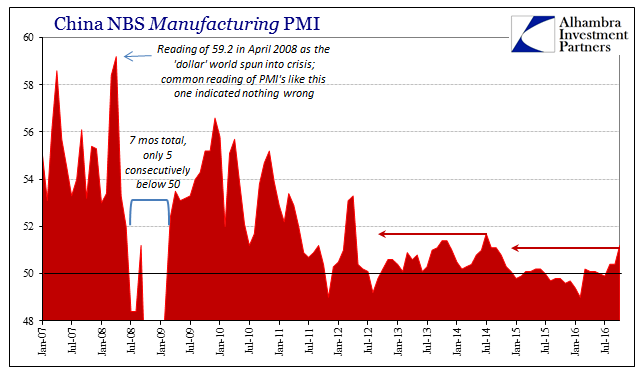
This idea should be acknowledged in widespread fashion simply because it is exceedingly easy to see. Starting with China’s Manufacturing PMI, though at a multi-year high in October 2016 it only recalls the last multi-year high. In July 2014, the index jumped to 51.7, which at the time was the highest level in more than two years before it dating back to early 2012. And then, as now, it was treated as conclusive proof that prior weakness had been skillfully put to the past. In other words, the index has only repeated itself.
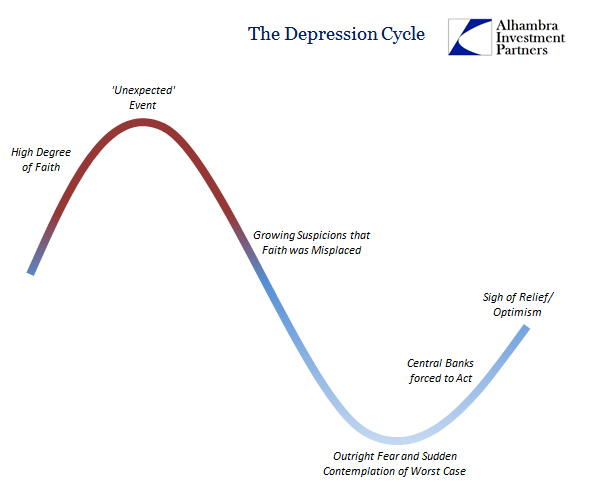
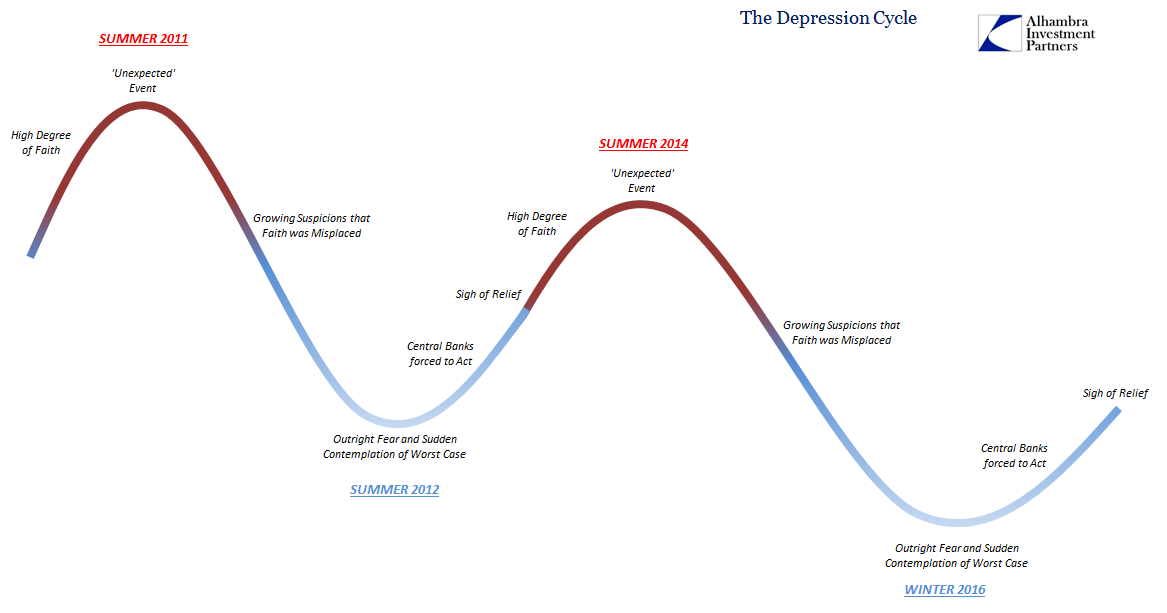
These non-business cycles, perhaps better classified as depression cycles, are as much reaction in expectations and emotions to misunderstanding of these points. They play out in narratives as well as actual economic activity. It all starts with central banks and official “stimulus” policies that for a time appear to be effective. The combination of belief in them as well as the natural economic tendency for growth to be better after an “event” achieves a high degree of acceptance.
Only those good feelings don’t last. Something “unexpected” comes along and not much thereafter things start to decline and deteriorate. After some time, that prior unshakable faith in “stimulus” is shaken by doubt. As it progresses further, doubts turn to fear of markets as well as economy. In the latter, however, people naturally judge the possible worst case as recession, where all of sudden it has become a possibility to consider that only a short while before was deemed (by “experts”) impossible.
The economy being in such a questionable state induces central banks (and sometimes fiscal authorities) to react to that state, which combines with the natural (and often seasonal) tendencies of the economy itself to “bounce.” Many people, perhaps most, attribute the rebound to the proficiency of policy executions and after a while let out a huge sigh of relief that recession was avoided as if that ended the whole thing. Optimism replaces doubt and if it goes on long enough we are right back to the initial stage where there is a high degree of broad faith.
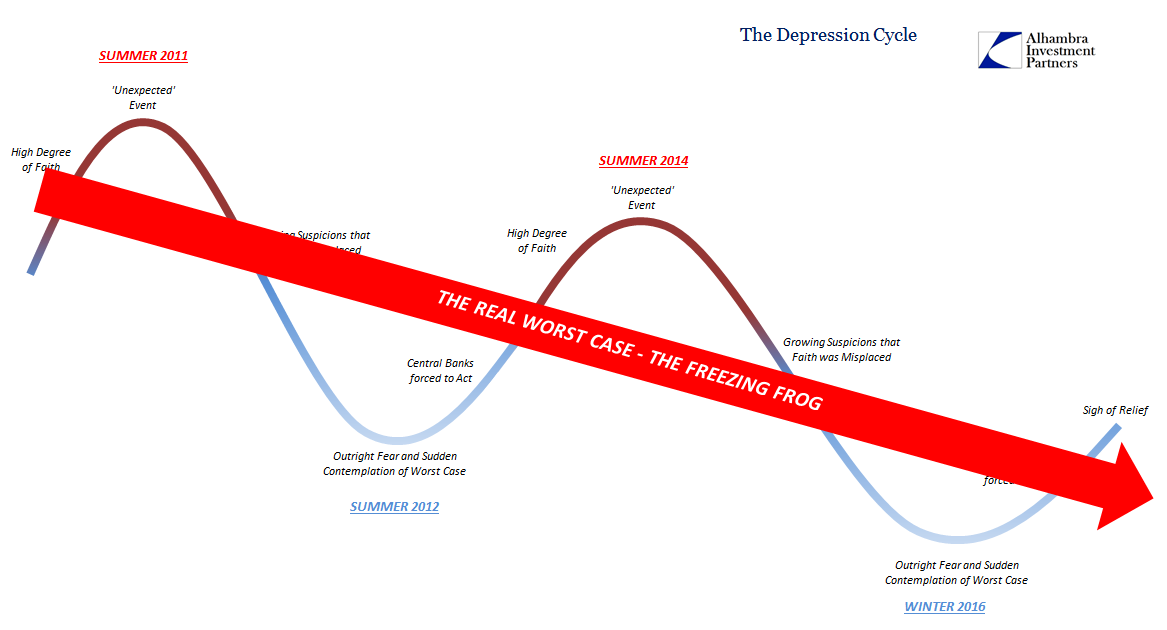
The problem is, again, one of translation because mainstream interpretation is grounded to that mistaken belief where recession is believed as the worst case. This simply isn’t the economy of the last decade or so. By being so relieved at avoiding the official NBER cycle declaration, or whatever official equivalent in these overseas economies, this view misses what is really the proverbial boiling frog. Or, as I wrote last week, the more appropriate metaphor is to slightly tweak the aphorism:
This pattern, however, is well-established now tracing all the way back to 2007. That is why nominal yields and curves have been falling since then, not as “stimulus” for more borrowing but as recognition of the dimming future prospects. Though there have been times when “normalcy” was considered a possibility, even a good one as in 2013, these bursts of optimism have been short-lived because the global economy only gets worse, slowly over time as if the proverbial boiling frog, though in this condition us amphibians are being slowly frozen rather than boiled.
We can very easily date the peaks and valleys of these depression cycles, now two of them, with the second perhaps on its way to being once more completed.
What we see of PMI’s throughout 2016, mixed as they are sure to be, is this general sense of relief that recession (or a “hard landing” in China) seems to have been avoided. But this is very different from inaugurating a recovery because from the perspective of the depression cycles we see very clearly that nothing has really changed. The increasingly frozen frog who is happy for a short while only to be confused all over again at the next “unexpected” turn chooses to emphasize those periods of relief and optimism instead of realizing how he is being slowly frozen into inanimation.
In fact, these cycles are so clear the stylized model I present above actually fits almost perfectly with these PMI’s. This is why I write that translating these economic accounts really should not be so difficult and muddied. Sentiment surveys in particular are data points that only register relative changes, meaning that contextual analysis is crucial to determining anything useful from them. When that provided context is the recession/not recession binary, it leads to bad translations.
These depression cycles can be labeled in any number of ways to still be consistent with the data as well as context. Yesterday, I used different descriptions on the Chicago Business Barometer that has been perhaps more confusing in the binary template because of its tendency to be so volatile month to month. That is just the amplified frequency of the same sorts of variabilities that we find under these terms as I have just described them.
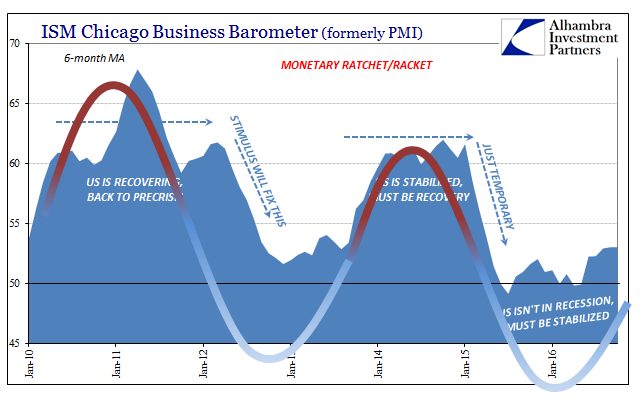
The labels used above are really just the related rationalizations that various emotional responses to the depression cycles have elicited. Again, these are universal, leaving little doubt as to both cause and interpretations of the effects of that cause.
That is because the peaks and valleys all line up to exactly “dollar” events. This is why I personally spend so much time and effort in Chinese money markets as well as the more esoteric eurodollar functions. It has proved time and again (including, of course, 2007) to determine the shifts in these depression cycles. Because of that we are under no illusions about what all this data truly means, even if the way in which the truly worst case will likely be achieved is nothing like a straight line.
In short, the real worst economic and financial case is the one where 2014 is repeated all over again, wasting that many more years hoping for an economy that isn’t actually possible. These upswings in sentiment don’t actually change the fact that the global economy is still being increasingly suffocated; but they do provide the opportunity for so many people to be misled all over again about what is really going on. This is how what should be easily diagnosed and dealt with (even if difficult and multi-dimensional of task) turns into a lost decade…or more.
Stay In Touch