
Gross Domestic Product in the United States for the third quarter of 2016 was revised higher from the preliminary estimate of 2.86% to now 3.109%, which is to say there is once more no difference. That is true even in comparison to earlier this year where GDP was less than 1.5% in each of the three preceding quarters. It should be completely clear by now after the mistaken interpretations of 2014 that there is no meaningful variance between 1% and 3% for GDP. After suffering malaise (depression) for years, the only number that would signal an actual change would be something like 6% or even 8% for several quarters in a row. All the rest are just positive numbers that serve to obscure the real problem by making it seem as if the economy is growing if but slowly and unevenly.
The BEA’s second estimate for GDP includes the preliminary quarterly estimates for corporate profits. This additional detail gives us greater insight into these two highly negative developments; the perpetual narrowness of interpretation that overstates the positives because it is (often intentionally) presented without the context of time (the real costs, thus contraction). In that sense, the figures from corporate profits are no different than the headline number, even as the latest estimates do seem to show serious improvement.
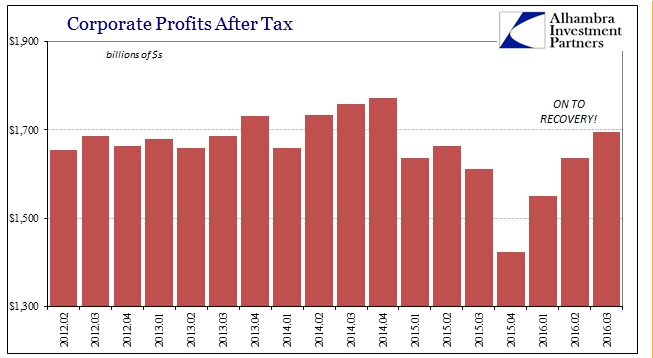
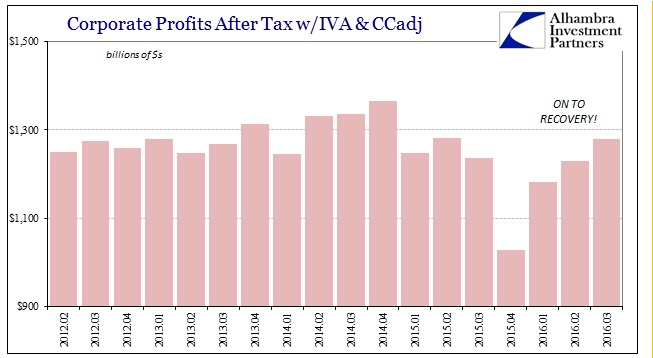
Corporate Profits After Tax dropped to a low of $1.4 trillion in Q4 last year, but have rebounded to almost $1.7 trillion as of Q3 2016. Similarly, corporate profits accounting for inventory and depreciation (IVA & CCadj) jumped from a low of $1 trillion last Q4 to now $1.28 trillion. As with GDP, these positive numbers are being served as if an actual recovery is underway. But as with all these accounts, what we find is the same weak but not getting weaker economy that is of an entirely different paradigm.
Again, most commentary assumes a linear relationship of relative changes. In other words, if a particular data point isn’t contracting or, as in this case, no longer contracting then it is assumed that it must be growing. This is the binary model of recession/not recession which just doesn’t apply here as anywhere. Taking profits out of their isolation shows that there is “something” very wrong with the US economy, and that concentrating analysis on the ups and downs has been, like 2014, misleading.
First and foremost, there has been little to no profit growth for years even after accounting for the latest increase. The linear convention does not factor that reality, but it is one that the real economy cannot escape (and clearly has not). Economists might argue that the uptrend in 2016 is the start of something big and different, but to do so they would still have to account for why those past uptrends failed before.
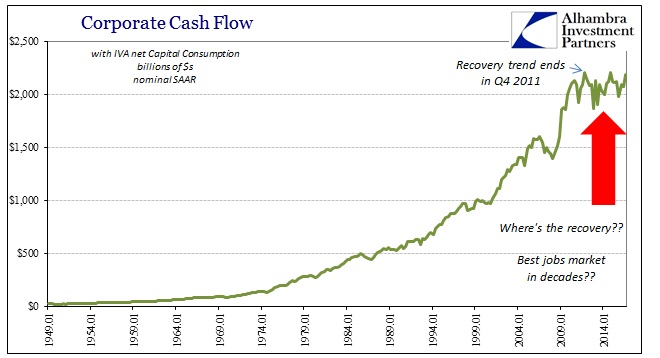
Corporate Net Cash Flow is perhaps the most significant of the corporate estimates in the GDP series as it is closest to actual economic decisions. Here we find that the current “rebound” is achingly similar to those already experienced over the past eight years.
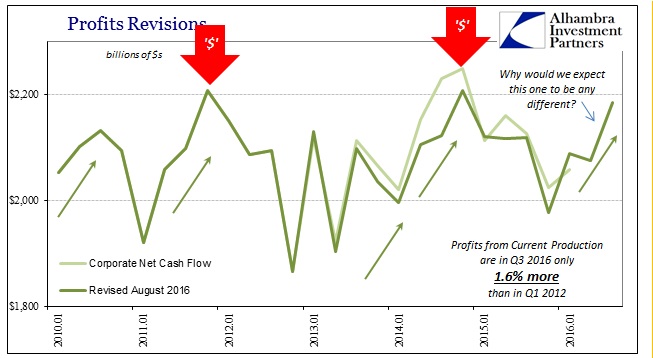
In Q4 2015, net cash flow fell below $2 trillion for the first time since the Polar Vortex in Q1 2014. As of Q3 2016, the BEA now estimates net cash flow to be almost $2.2 trillion. That level, however, is not even 2% more than Q1 2012, showing very well the effects of all these fits and starts that over time contribute only negative conditions. Throughout 2010 and 2011, cash flow, as many statistics, was suggesting dramatic improvement and even growth or recovery – only to suddenly cease in 2012. All that recurred in 2013 and especially 2014, where that upswing was once more interpreted as the definitive sign of recovery – only to suddenly and “unexpectedly” cease in 2015.
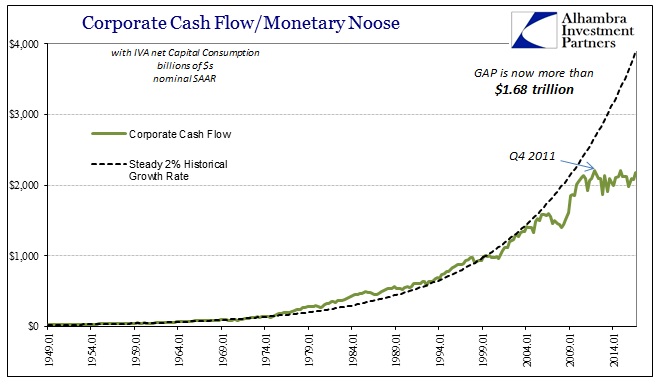
As the corporate sector, and thus the whole economy, lurches from one of these mini downturn/upswing cycles, the inappropriate emphasis on only those rebounds confuses the fact the economy is contracting in terms of time. Thus, by using each upswing to inappropriately set expectations about growth in the future, there is never any account for that lost time. If the economy is set to recover finally, after all, why bother about the past? The problem with that view is that by objectively analyzing the past you begin to realize why it hasn’t recovered and therefore the high degree of likelihood that it won’t no matter how positive the interim numbers.
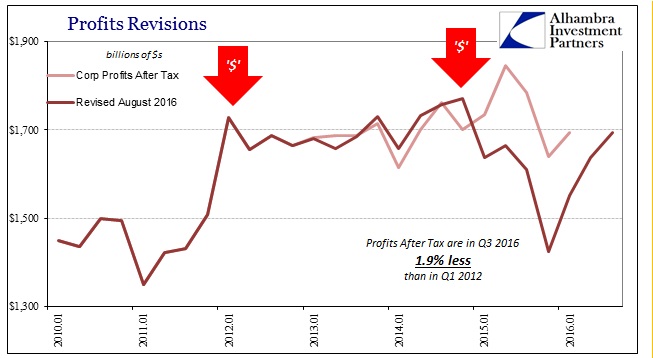
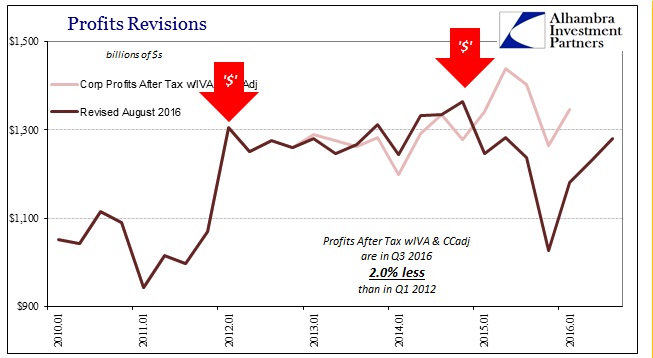
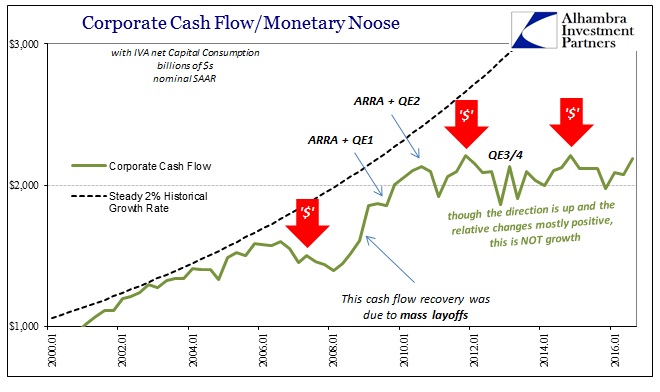
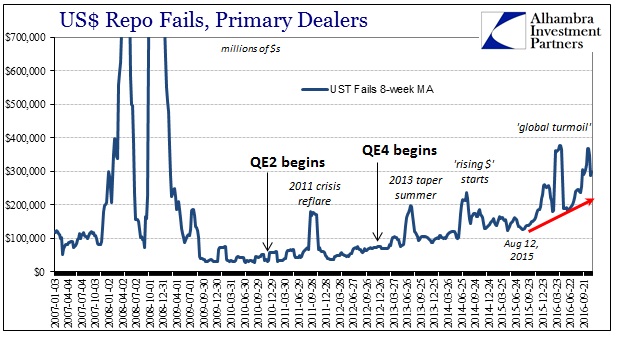
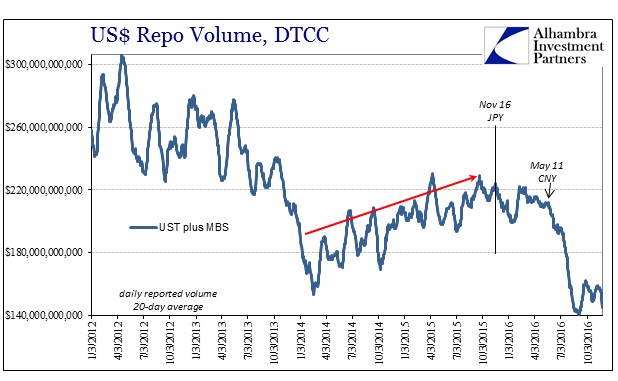
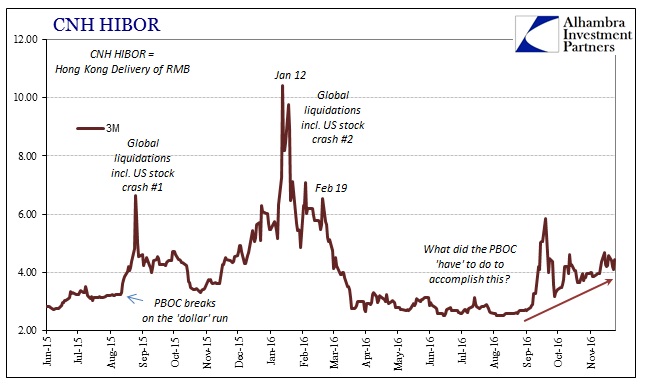
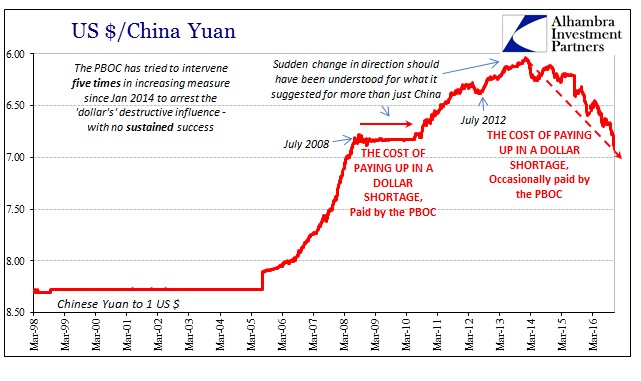
To economists, this is all a big mystery because their view of QE and “bank reserves” is likewise inappropriate. Viewing the monetary system as it is rather than what they think it “should be” has the effect of rendering obvious the whole issue. To leave little doubt, I have marked on the charts above the major “dollar” events of this “recovery” age which are not coincidentally the points where each time these minor upturns end so as to renew the massive time cost all over again. That raises the timely issue of “stimulus” especially as fuzzy dreams of it are being hatched once again as a possible answer to all our economic problems.
Since corporate cash flow is, again, an important economic indication particularly as the nexus between potential labor demand as well as capex and productive investment, it is, I believe, helpful to review this historically unique period in light of all past “stimulus.” During the Great “Recession” itself, there was in the back half, the worst half, a serious rise in estimated net cash flow which is actually quite expected for recessions. That was nothing more than businesses finally seeing past Bernanke’s repeated assurances and reluctantly but unreservedly embracing the far different “dollar” reality; cash flow rose significantly due to mostly mass layoffs (as well as capex cutbacks) as corporations and other businesses aimed to conserve financial resources at low economic levels.
By the time all the “stimulus” was added in the form of QE1, ZIRP, and the fiscal side of the American Recovery and Reinvestment Act (ARRA), cash flow had already rebounded to $1.86 trillion from a low in Q1 2008 of $1.4 trillion. The intent of “stimulus” is to get businesses to think favorably such that they stop “hoarding” internal financial resources and release them back into the economy as hugely positive growth projections that require hiring and productive investment to fulfill. The ARRA, in particular, was supposed to enhance that positivity beyond emotion by injecting directly a huge amount of spending and transfers, further bolstering the idea for businesses that they should go back to normal growth again.
Even if we assume that all the positive economic numbers in 2009 and 2010 could be attributed to combined “stimulus” alone, a preposterous idea, of course, but one that furthers my point, we still find that the “dollar” wins anyway. Whatever positive trends that may have developed because of how “stimulus” was supposed to work were suddenly and quite easily overcome by the events of 2011 – and then again by the events of 2013 that spilled over into 2014 as the “rising dollar.” The result is an economy that goes nowhere though on occasion it seems to be getting somewhere.
Therefore, any assumption about either this “rebound” or the possible “stimulus” that might follow next year that extrapolates into a meaningfully different and positive economy hereafter is one that does not account for the past “dollar” events and thus implicitly assumes there will be no more. That is clearly the biggest problem with interpretation of these periods where the positive numbers get more positive; at each time it is just assumed that there will be no more “dollar” to interrupt them, largely because the “dollar” isn’t ever considered. We have to reconcile the past to monetary reality in order to be realistic about the future.
The corporate profit section of the GDP estimates is compelling in that light all its own, but of course we find the same pattern repeated in so many other US economy accounts as well as those from all over the world. It is a frustrating consistency largely because it is all either unnoticed or intentionally discarded, and because it is we can be quite assured nothing meaningful has changed no matter how positive we see figures sometimes in between.
Stay In Touch