
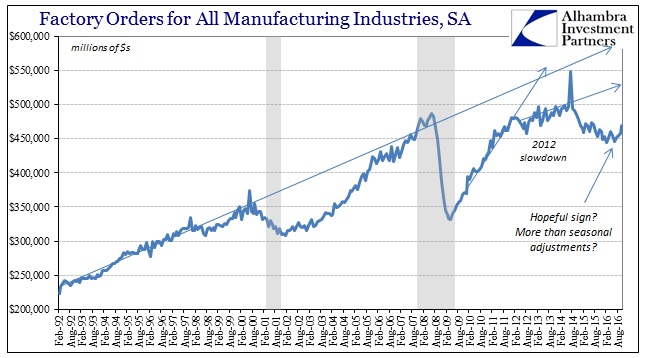
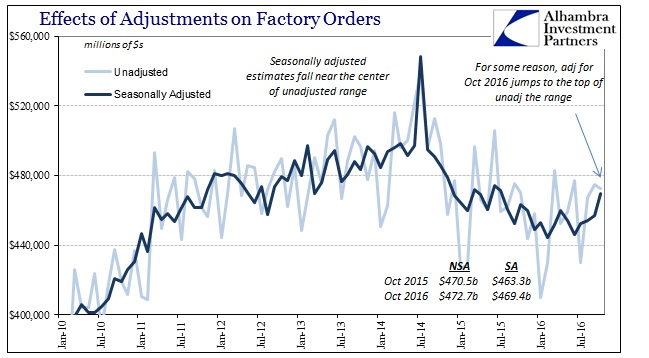
Total factory orders in October 2016 were almost unchanged year-over-year (NSA) from those of October 2015, up just 0.5%. That was the second straight month of no growth, as factory orders in September were down just slightly, -0.1%, after being revised somewhat lower. Combining both September and October together, factory orders in those two months were 0.2% above the same two months in 2015. That would indicate the same weak but not getting weaker economy.
The seasonally-adjusted series, however, has exploded higher. Month-over-month factory orders were up nearly 3% in October, a jump of $12.5 billion. The seasonally-adjusted gain for both September and October was $15.4 billion. That is a drastically different result than the unadjusted series that suggests no growth or rebound.
There are often these kinds of months where the seasonal adjustments lead to a much different interpretation of whatever economic account. Usually those differences are tied to the calendar placement of holidays or the number of weekends in a particular month as different from the number of weekends in the same month the year before. What is going on here is more than number of days adjustments.
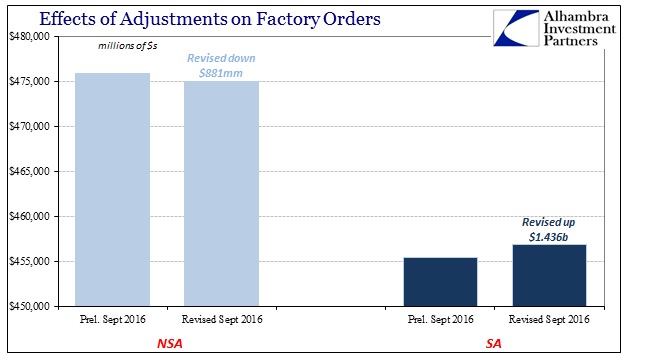
It starts with revisions for last month. The unadjusted figures for September were revised down by $881 million, a change that is pretty standard for the past few years. The adjusted number for September, however, was somehow revised higher by $1.4 billion. That would suggest something had changed between the preliminary estimate and its first revision in the pre-calculated seasonal adjustments?
For October, those seasonal adjustments “expect” a large decrease from September. That makes sense given the Christmas holiday, where factories in the US would run “hot” during the summer to build up product and inventory leading up to the holiday shopping season. By October, whatever marginal production was ordered by the retail sector had been produced and shipped, so factories scale back a bit in the change of season to autumn.
In both 2015 and now 2016, that didn’t happen as much as it had in the past. Last year, factory orders in October were only $4.8 billion less than September, defying somewhat the regular seasonal pattern. Therefore, the adjustments that are looking for the regular seasonal pattern interpreted that much smaller than typical decline as huge organic economic growth for the factory sector. In the seasonally-adjusted series, factory orders were calculated to have been up sharply, +$10.7 billion in October 2015 over September 2015, even though NSA Y/Y factory orders were down nearly 6%.
In October 2011, by contrast, unadjusted factory orders were almost $17 billion below September 2011. That was, apparently, about the level that the seasonal adjustments were mathematically figuring so that in the adjusted view factory orders were estimated instead to have been flat (-$317mm) from September to October 2011.
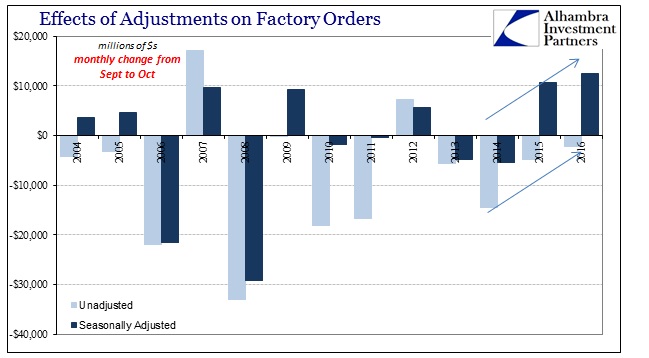
The seasonal change in 2016 was like that in 2015 rather than 2011. Unadjusted, factory orders were only $2.3 billion less in October than September. The seasonal adjustments have turned that small decline into a huge gain (+$12.5 billion M/M) because they are set up to “expect” the regular decline like that of 2011. Therefore, like October 2015, there is a huge difference between what the two series are projecting.
We know that the seasonally-adjusted gain last year was a mirage, as the economy overall and especially manufacturing in particular was nothing like the monthly SA gain, instead perfectly consistent with the year-over-year decline NSA. I believe the problem lies in the mechanics of “seasonal” adjustments that relate to faulty assumptions about their universal applicability.
Seasonal adjustments as a statistical concept aren’t controversial. There is some potential value in isolating organic growth separate from just the arrangement of holidays or weekends. There has also been enormous desire to be able to more closely measure inflections in economic accounts in smaller frequencies than might otherwise be possible with year-over-year unadjusted changes. As the examples above show, there could be some good information in interpreting the significance of what September to October is normally like.
The problem is that seasonal adjustments cannot differentiate where monthly changes might not be due to regular seasonal patterns. If the US economy were to be unusually weak, as in recession or recession-like conditions, there might not be so much difference between September and October because factories during that summer just might not run “hot” at all. In that situation, the decline in unadjusted orders from September to October might not be all that much, leaving the seasonal adjustments to calculate improvement based on an assumption of “normal” seasonal patterns that just don’t apply.
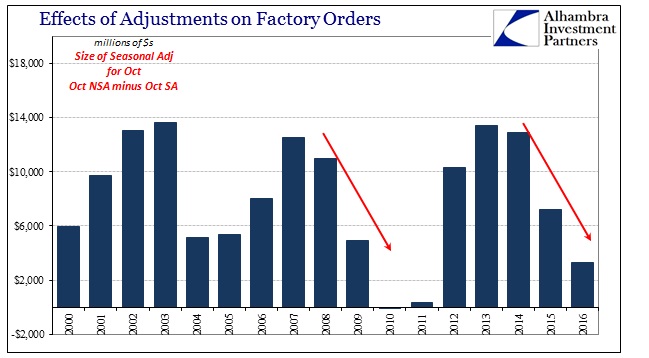
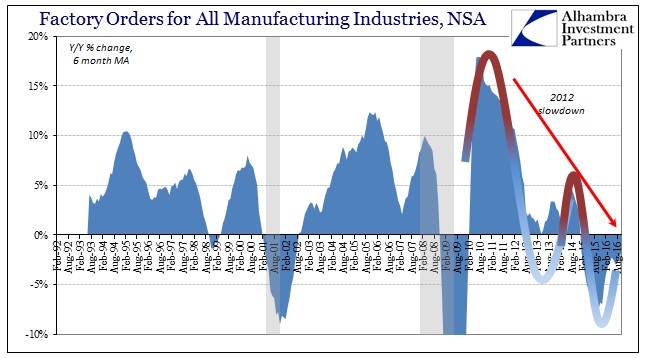
That is, in fact, what we find generally over the past decade. Seasonal adjustments themselves are not supposed to display such patterns, but as you can see above they are unmistakable. In 2009, factory orders for October were actually $198 million above that September, reversing the usual pattern. The seasonal adjustments saw that as a huge gain, $9 billion M/M, even though factory orders were down more than 13% Y/Y. The difference was projected in the distance between the unadjusted level and the adjusted level (for October 2009, unadjusted orders were $373.3 billion, adjusted $368.4 billion, much closer together, meaning smaller seasonal adjustment than they were in 2006, 2007, or 2008).
But in that case, there was agreement as to at least the direction of the economy in US factories; though the Y/Y change was -13.2%, that was a huge improvement from the -19.4% in September and the 30% declines of just a few months before. If factories were seeing slightly more orders in October 2009 than September 2009, that, again, was due to the weakness of September and the prior summer.
In 2015 and 2016, by contrast, there aren’t these huge recession/recovery-related swings with which to suggest the seasonally-adjusted figures are correctly interpreting what in my view is surely a non-seasonal pattern. Again, if the expected seasonal change from September to October is very different in a positive way, absent any mitigating assumptions the seasonally adjusted series will calculate that as a huge positive. It is the role of trend-cycle factors to change that calculation as to reasons beyond the typically seasonal; and we know all-too-well what subjective trend-cycle figures have been doing for the past few years.
Because the weakness in the past few years of the “rising dollar” doesn’t measure up to recession, there is no trend-cycle mechanism by which to reclassify these unusual September to October changes as anything other than huge improvement – which they are not. It is not the fault of the seasonal adjustments, rather it is the faulty logic that statisticians can know what is and is not “normal” and when. We know for sure that was the case for 2015 where the large M/M jump in factory orders was wholly misplaced, and provided yet more opportunity for the mainstream to be led unprepared toward the “unexpected.” It is reasonable to assume the same once again, especially for a weak economy that hasn’t changed.
With inventories high and the economy overall more depressed even in terms of rhetoric and expectations, there is every reason to believe that, as I suggested above, factories in the US did not run “hot” at the margins this year, just like last year. That means there was no usual gain in the summer by which to expect the usual decline from September to October, and sure enough there wasn’t one yet again. It is another example for how the usual statistics have great difficulty in measuring consistently this unusual (meaning consistently weak) economy.
Stay In Touch