
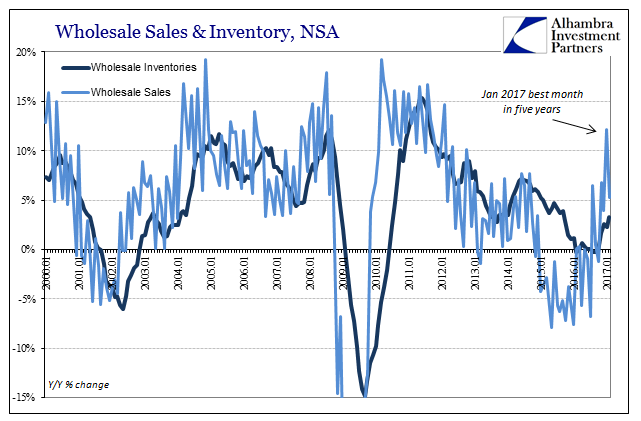
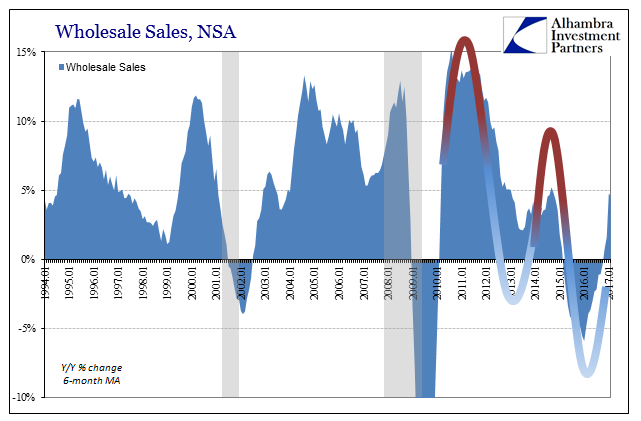
Wholesale sales rose 5.3% in February 2017 year-over-year after jumping by more than 12% in January on oil effects. Like calculated inflation rates, wholesale sales are for now marginally determined by energy price comparisons as well as calendar effects. February 2017 had one fewer day than February 2016, which according to the Census Bureau’s seasonal adjustments played some significant role in February’s number. I think that is overstated, especially as the adjusted series has for several months, more than just February, been toward the high side.
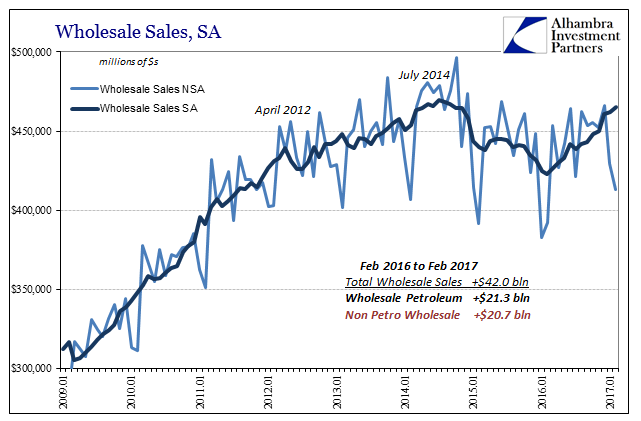
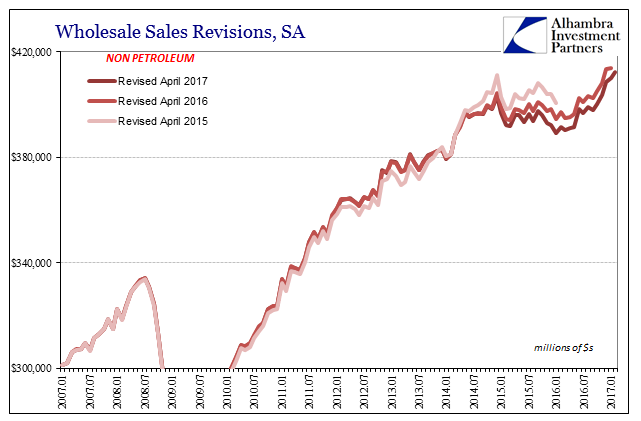
The wholesale segment of the supply chain has clearly improved from 2016’s near recession at its start. As always, what is at issue is not the improvement but whether it is meaningful beyond just the return of positive numbers. One factor to be considered in that judgment is that benchmark revisions released today show that the condition for wholesalers was appreciably worse than estimated over the past two benchmarks.
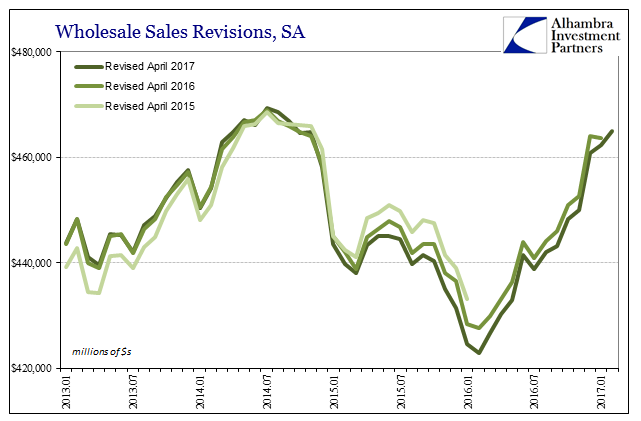
The downward revision for sales was due entirely to sectors outside of petroleum. In fact, crude oil sales across the wholesale space were revised higher in this latest update. Wholesale sales ex petroleum were instead written down by about $6 billion at the bottom in February 2016. January 2016 sales ex petroleum were as of now $11 billion below April 2015’s benchmark.
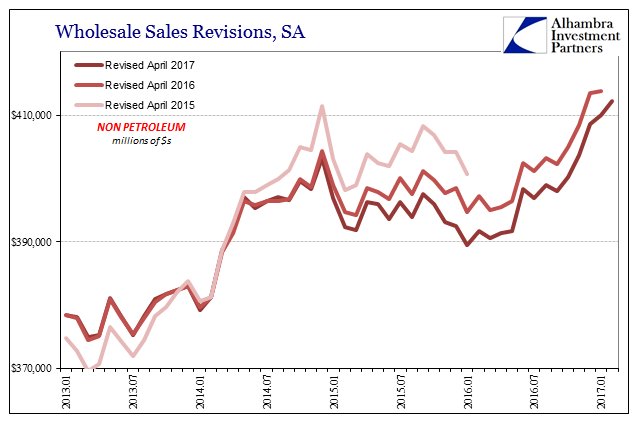
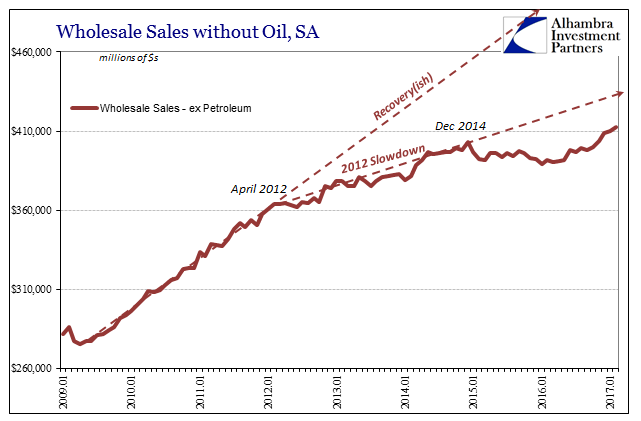
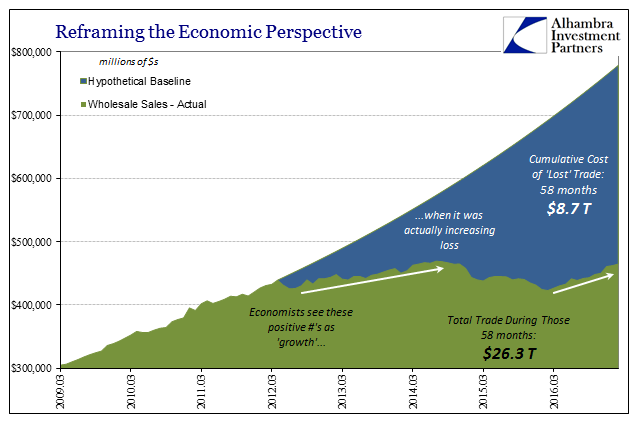
With a greater overall drag in terms of economic performance in the wholesale segment throughout the “rising dollar” period, the total of lost opportunity is that much greater – meaning the growth rate required to get back closer to even the 2012 slowdown trajectory is that much higher. Without the benefit of petroleum effects, there does not seem to be that much momentum by which actual growth might be accomplished.
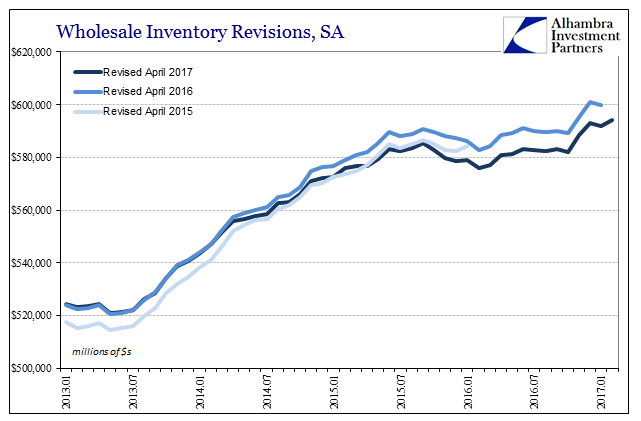
On the inventory side, benchmark revisions have reduced the buildup somewhat especially in 2015. It isn’t unusual but it is still entertaining when you find alterations that go up one year (as inventory benchmarks in April 2016 above those from April 2015) and then right back down almost to the same place the next (April 2017 benchmarks put wholesale inventory right back in the April 2015 trend). The net result is the same pattern as the April 2016 benchmark but beginning instead from the April 2015 benchmark starting point.
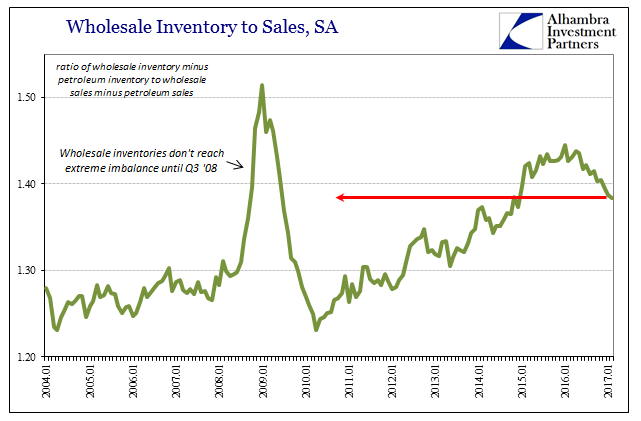
The reduction in sales coincident to the revised figures in inventory leaves the inventory to sale ratio practically unchanged. Excluding petroleum, inventory-to-sales have improved as you would expect given that inventory has remained rather flat while sales have risen at least somewhat. Still, however, the ratio remains to the high side even as compared to just the past few years.
It is quite reasonable this imbalance accounts for some good part of the lackluster rebound in manufacturing thus far. It is especially the case in the auto sector, where wholesale inventory of motor vehicles and automobiles remains very high and well out of historical alignment. The inventory-to-sales ratio, seasonally adjusted, for autos was 1.76 in February 2017, practically unchanged from 1.80 (revised) in February 2016 and still above February 2015.
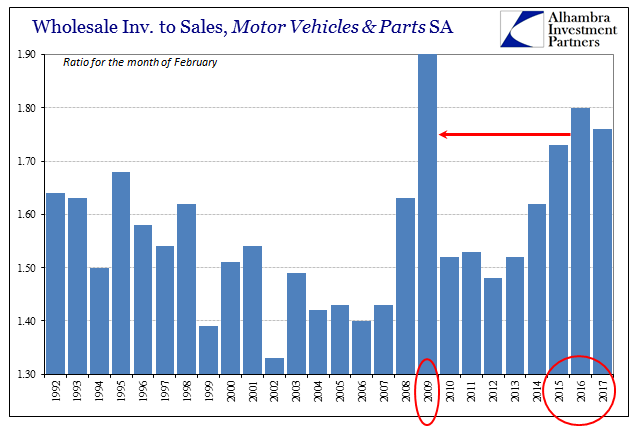
Since auto production accounts for, or did, a good deal of marginal manufacturing momentum, the distinct lack of progress on auto inventories (retail level inventories, too) is a negative signal for future production. These lingering effects, as well as those recounted above, from what was certainly a near-recession under the “rising dollar” might further explain the lack of impetus in the labor market where a turnaround has yet to even take shape.
As oil price effects fade, it will be interesting to see by how much overall sales and to some degree inventory growth recedes from the current pace. The 6-month average for sales was 4.6% in February, just about where it was in the early and middle part of 2014. It is therefore easy to project the repeating (depression) cycle from here, and so far nothing in wholesale sales or elsewhere suggests why that wouldn’t be the case.
Stay In Touch