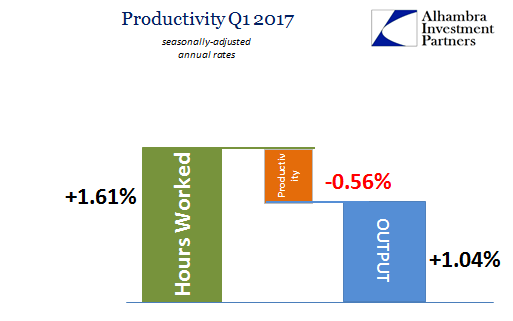
As much as even the major labor market statistics have picked up on slowing, they wouldn’t have in the first quarter of this year presented enough of it to keep productivity positive. With a very low level of output, once again, calculated labor productivity was for the fourth time over the last six quarters negative. According to the BEA, total private output was 1.04% Q/Q (annual rate) in Q1, added to the BLS’ estimates of 1.61% Q/Q (annual rate) growth in total labor hours, productivity as the remainder was left to work out to -0.56%.
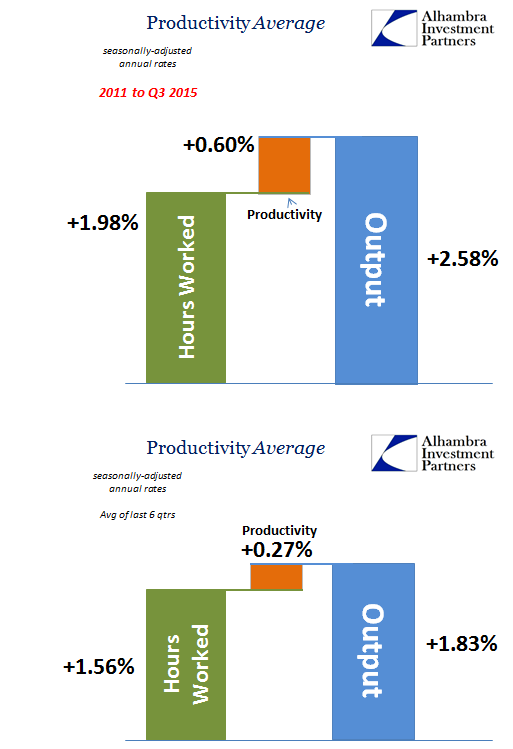
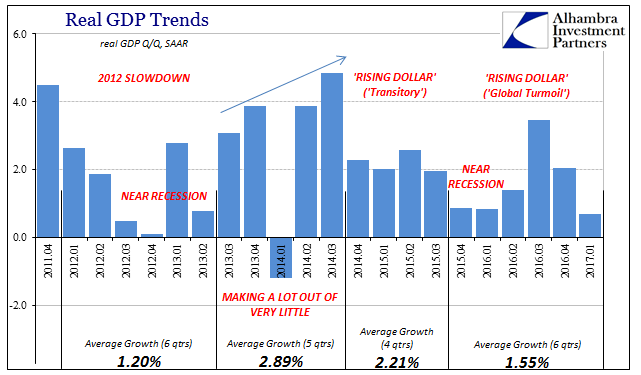
The average over the last six quarters, those following the eruption of “global turmoil” traced to the “rising dollar”, is for just +0.27% in productivity after 1.56% growth in hours subtracted from 1.83% in output. All those levels are down from the already reduced average 2011 to Q3 2015. It represents one possible element demonstrating both the slowdown over the last six quarters, including within the labor market, as well as the ongoing and chronic state of the overall economy the past six years.
Without any sustained advance due to productivity, there isn’t any room to generate necessary wage gains no matter how low the unemployment rate falls. That ratio has signified, to economists anyway, a level beyond full employment for nearly two years now and still the whole system remains subdued at every level – wages in particular. If we applied historical levels of productivity to the Q1 results (or the averages for the past 6 quarters and more) we can see why:
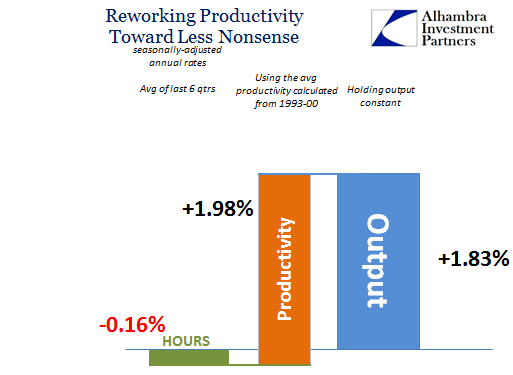
Using the average rate of productivity from the 1990’s, total hours would have to be negative by virtue of the persistently slow advance in output. But because of the way productivity is calculated, it is that measure which takes on the minus sign. In truth, they are both likely to be to some degree inaccurate, where the BLS is in my estimation still overestimating labor gains to a significant level. The resulting negative productivity is the statistical way of suggesting it as a possibility, the inability of the BLS data on labor, being robust, to reconcile with BEA estimates of output, which are far from it.
This sour view of the labor stats would seem the more likely result given the state of output, for it truly doesn’t make much sense to simultaneously find the “best jobs market in decades” even if it slowed down during a period of substandard growth followed by 6 quarters (so far) of weaker growth still; all within an overall economic trajectory absent any recovery from the largest economic dislocation since the 1930’s.
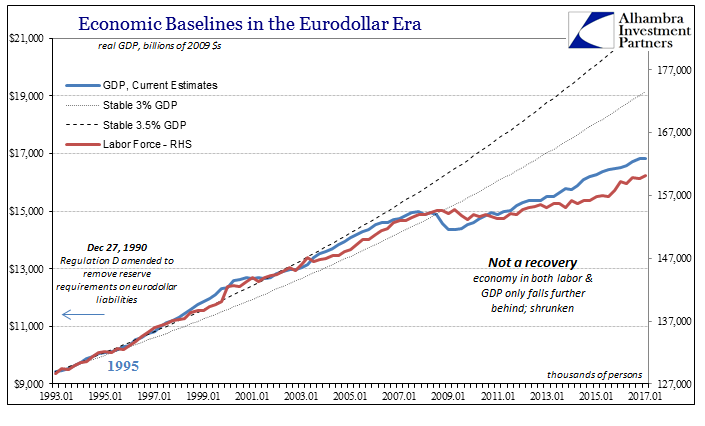
That is why economists and policymakers like Janet Yellen can only hint at what full employment is supposed to bring, rather than being able to point directly at the evidence for it. Instead, all the related data in terms of productivity suggests very little difference now as last year or the year before; again, no matter how low the unemployment rate falls.
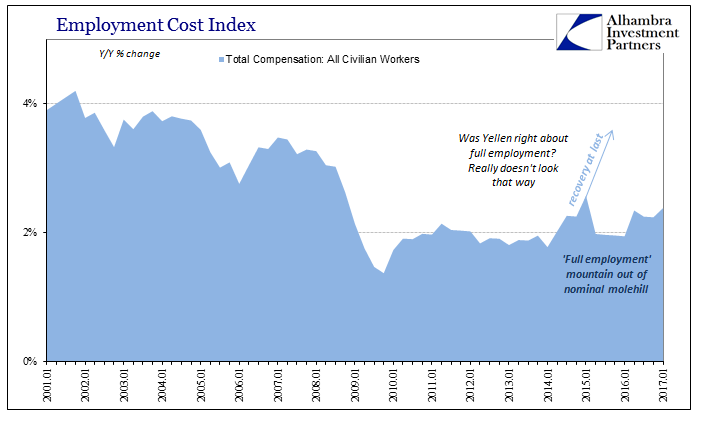
The Employment Compensation Index ticked up to a 2.4% year-over-year gain, which outside of Q1 2015 was the highest since 2008. And yet that only sounds substantial within that narrow context of just the recovery-less post-crisis paradigm. That rate should be closer to 4% (and reached long before now) given the indicated condition of the unemployment rate.
The same discrepancy of recent trend is found also in nominal compensation, the point where actual labor gains at actual full employment would actually matter first. Nominal compensation rose 3.9% in Q1 compared to Q1 2016, and the 4-quarter average is up to 3.2%. While better than in previous years, it is still considerably less growth than found during prior (actual) cycles at the same point in the employment process (as represented by the unemployment rate). At 5% unemployment in the 1990’s, this measure of nominal compensation was growing by an average of nearly 6%; at the same point in the mid-2000’s, 5%.
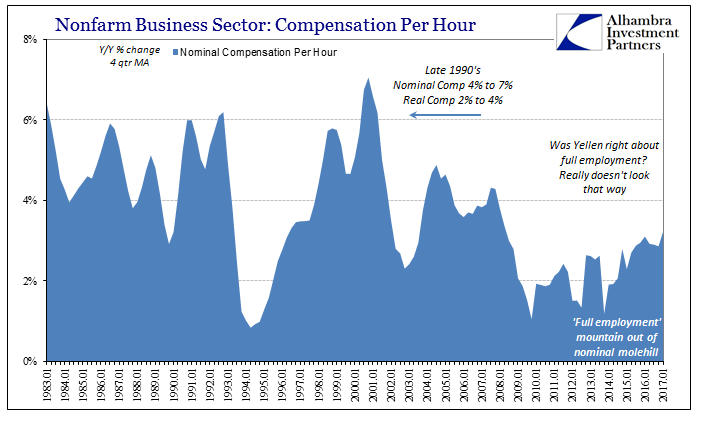
At 3.2%, the current “improved” rate of nominal pay growth is still very near to the level reached during the trough of the dot-com recession. Not only is that an unfortunate comparison, it understates the real damage or economic cost in terms of time and lost compounding; a deficiency better stated below in the related terms of spending.

What all these factors have in common is the same as we find everywhere else – stunted and often inconsistent calculations that confound all comparisons to the pre-crisis era. This is unsurprising given what has really transpired; the economy in late 2008 and early 2009 shrunk. The implications of that are what you see here, from productivity that is either alarmingly low year after year or incompatible with BLS numbers (or some of both), as well as pay and compensation levels that refuse to match the unemployment rate for several years now.
The low level of output in Q1 2017 simply continues this unfortunate tradition, both as a matter of calculation as well as common sense.

Stay In Touch