
Is it already priced in? Depends, of course, on who you ask and more importantly which market is carrying out the presumed discounting. Stocks surged on the idea that though this is epic in its misery we’re already getting past the worst. Short run disruption, a big one, but nothing more.
It’s almost preprogrammed at this point: the data for April is going to be the worst of it. That’s when the heaviest part of the disruption struck, where the condition was at its apex and totality. The data from here, all data, won’t be nearly so negative.
But does less negative starting with May necessarily mean the same thing as legitimately getting better?
The bond market, obviously, isn’t seeing things that way. Safety yields have held their spot near and at record lows. Such demand for the most liquid instruments, especially at the long end, isn’t at all consistent with the “V” currently illuminating NYSE screens.
These figures are simply historic, and as such I fervently hope we never, ever see anything like them again. Non-economic dislocation or not, short run or not, this is a ridiculous amount of pain (increasingly it looks unnecessary, too).
The BLS’ Current Employment Situation report says that 20.5 million payrolls (Establishment Survey) were lost last month. Since this was modestly better than the 22 million which had been expected to be shed, a small dose of presumed positivity at the trough. The estimate for March was reduced by a whopping (or it would’ve seemed that way before the recent numbers) 199k, bringing the prior month’s decline to an even 870k.
The Household Survey, by contrast, had already suggested nearly 3 million fewer employed persons in March followed now by another 22.4 million less. That brings the two-month loss total up to 25.4 million, which looks like this:
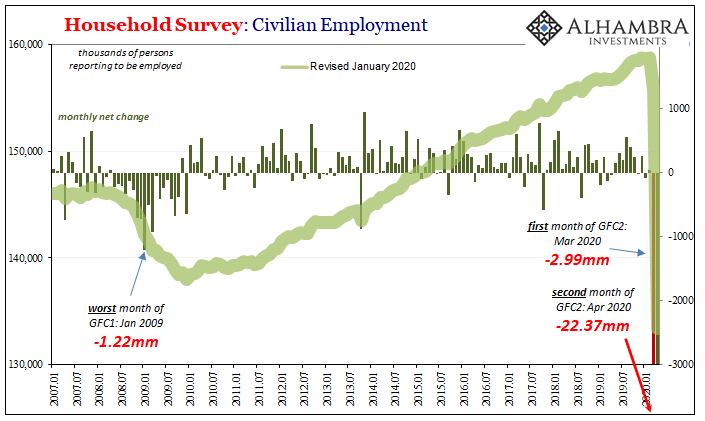
The last time the Household Survey indicated 133 million Americans reporting to be employed it was 1999.
With widespread job losses, the unemployment rate (which is linked to the Household Survey) jumped from a 50-year low of 3.5% in February to 4.4% in March and now 14.7% in April. But, as noted last month, once more this statistic understates the true level of devastation just as it has since 2009 – only more so now.
Starting with:
The number of persons not in the labor force who currently want a job, at 9.9 million, nearly doubled in April. These individuals were not counted as unemployed because they were not actively looking for work during the last 4 weeks or were unavailable to take a job.
That number had been 4.96mm in February, meaning that 5mm as of today former workers report wanting a job in April but have given up looking for one. They are then, by definition, removed from the labor force entirely (the unemployment rate’s denominator).
Worse still are those who are no longer employed and tell the BLS they aren’t even looking for work anymore. This cohort is the essence of the participation problem that has stripped the labor force down to utter barrenness, allowing the unemployment rate from the top (numerator) to inappropriately dominate.
The BLS says that the labor force declined by another 6.4mm (including those mentioned above) in April after having suffered a massive 1.6mm loss in March.
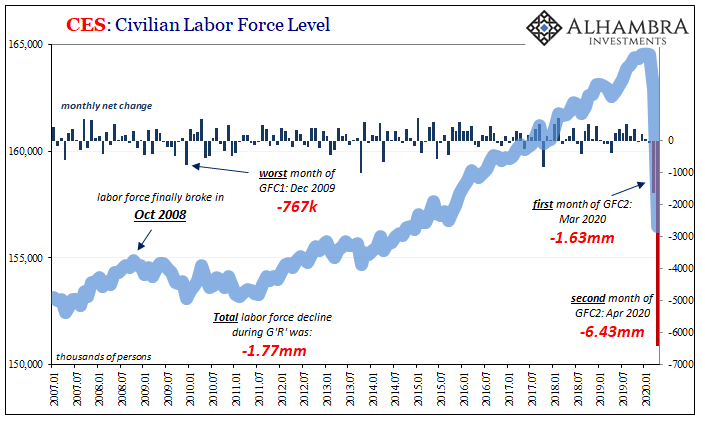
Out of all the estimates and numbers included in the CES, these are, I believe, by far the most stunning as well as relevant. As I wrote a month ago, declines in the labor force are a relatively new phenomenon. It wasn’t until October 2008 (why October 2008 is no mystery) that one was first witnessed, a dark portent of the economically awful years which followed.
Once those workers are laid off, they continue to look for work. They may be jobless but they never leave the labor force. Why would they? Everyone understands the nature of the business cycle; even when you become unemployed, as painful and nerve-wracking as that may be it won’t be a permanent situation…
American workers understand the situation far better than [Bernanke] ever did (or pretended not to). They saw that this was different, GFC1 represented a long and painful road back. Companies pushed to the very edge of survival by liquidity pressures, very good companies that just weren’t going to be the same because the Federal Reserve, for all its bluster and showmanship, had failed at its first job…
Americans could tell how it had all changed. They knew what their employers were up against and what that would mean on the other side of GFC1. Workers reacted naturally; hundreds of thousands, nearly two million left the labor force altogether knowing full well there wasn’t going to be much of a recovery.
Five million (FIVE MILLION) have already told the government they’re not bothering to look for work even though they also report to the BLS they’d rather be employed.
Undoubtedly, once things open back up, several million of them will begin looking for work again. But how many millions will find it, and how many millions might not try? Even if the number is a couple million (rather than eight currently), that would put the economy on par with 2008-09 – hardly anyone’s rational idea of a purely non-economic V-shaped triviality.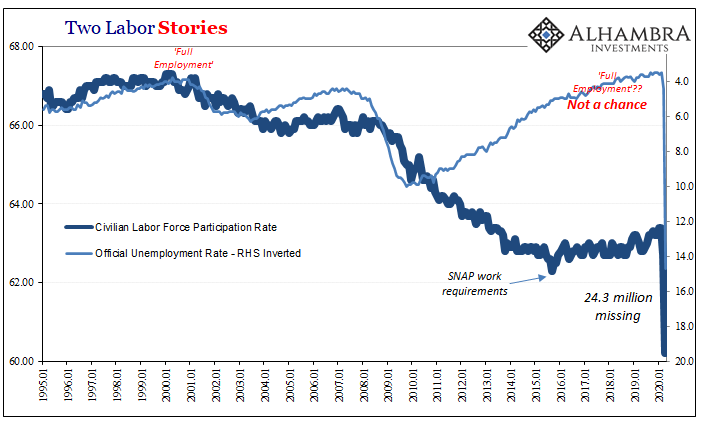
Switching places with the unemployment rate, the labor force participation rate, by virtue of so many former workers giving up, is now the lowest in almost 50 years (1973). Unfathomable apart from the payroll losses which, given the situation, are at least understandable.
These are symptoms of a weak economy buckling under extreme pressure. The underlying labor data, contrary to the headlines, had indicated how given Euro$ #4’s persistent drag on the global economy (globally synchronized downturn) the implied level of labor usage (hours) was the lowest it had been since GFC1; companies already struggling had to cut down on growth in what they used of their labor.
Just in time for GFC2:
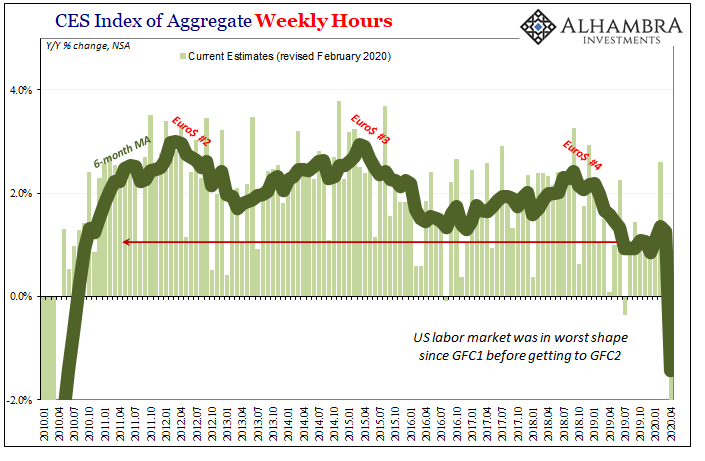
And the figures you see above for March and particularly April are skewed since they are averages. What that means is that this statistic is only meant to measure the number of hours worked by workers who are working.
Therefore, in addition to so many tens of millions not working, and the eight million who now aren’t even in the labor force, for those who are left lucky enough to still hold on to a job through last month they have, on average, worked a lot less themselves.
How many fewer average hours? Fifteen percent in April. The worst prior month had been June 2009 when those who made it the whole way through the Great “Recession” with their job in hand still had worked, on average, 8.9% fewer hours than they did during the same month the year before.
Even if you believe that there’s only the COVID-19 shutdown at work in these historically bad figures, it still leaves you with a numbers game to consider. What I mean by that is the sheer volume; that with so many big ones spread across all these important categories, the chances that it all just goes smoothly from here are exceedingly small (if not nil).
Before you ever get to factoring GFC2 and second, third order effects.
I think that’s why, intuitively, so many millions of workers just up and left the labor force. This is no one-month or two-month disruption. There’s a long-haul deficit yet to be discovered, one that will more likely bend the “V” into a more recognizable “L.”
Another.
Stay In Touch