
As a follow-up to the post-October correlation in Treasuries, it’s worth reiterating how much more compelling the flattening curve has been given the full range of circumstances otherwise all lined up directly opposed to it. There has been:
1. Accelerating CPI.
2. Higher oil prices.
3. Looming rate hikes.
4. Outwardly favorable labor data turbocharging expectations for even more aggressive rate hikes (and QT).
5. Taper – meaning the Fed buying fewer USTs of all kinds, putting “too many” Treasuries back on mainstream the menu.
6. US fiscal recklessness only partly slowing down after gross federal debt reaches $30 trillion (marketable debt more than $28 trillion), indicating insanity when it comes to assessing credit risk.
With regard to specifically the last two of those, this is where former Dallas Fed Richard Fisher’s reaction to a proposal for Operation Twist in 2011 is again helpful:
MR. FISHER. In summary, I want to mention that, as I said earlier, most of these variations that have been suggested are very un-Bagehot-like. And what I mean by that is, twisting [or QE and yield caps] entails purchasing assets that investors are fleeing toward, not assets that they are fleeing from. [emphasis added]
In other words, the bond market begins piling into safe and liquid assets long before the Fed comes in later (after much illiquidity and dollar shortage damage) to buy the same securities. Thus, why even Fed or orthodox Economists remain unable to attribute much at all to all this central bank “bond buying”, though they’re absolutely desperate to do so.
The failure to establish anything more than truly trivial effects speaks to the purity of long-term yields (in particular). The less of any verified QE-effect, the more you can depend upon the yield curve signal.
And the former has become increasingly ridiculous, as I described last week.
This did not stop Esther George, the Fed’s Kansas City branch President, just days ago from improperly (and risibly) extrapolating the alleged 15 bps effect from any $600 billion LSAP into claiming the Fed’s QE6 and its “$6.9 trillion holdings of federal agency and longer-term Treasury debt is depressing the 10-year Treasury yield by roughly 150 basis points.”
The 15 bps was offered by recent scholarship which arguably (and there’s a lot of room to argue) credited every $600 billion of QE with reducing, say, the 10-year UST yield by a truly underwhelming volume.
Six hundred billion buys the Fed only a questionable and puny 15 bps?
Ms. George, in her despair, sought to conjure a better case by just tallying together all the QE’s since the very first one way back in ’09 and nearly straight-line extrapolating her 150 bps from it. Which, as anyone who as basic knowledge of statistics knows, is a no-no.
In other words, poor desperate Esther is claiming that cobbling together the activity for all six QE’s she might then presume a cumulative impact spaced out over more than a decade altogether has subtracted 150 bps from the 10-year Treasury yield.
That’s not how this works; that’s not how any of this works.
For one thing, are we really supposed to believe a more than 11-year-old QE (#2) of $600 billion still has its alleged -15 bps over the 10-year Treasury rates of today? She obviously wants us to.
My point in writing all these dubious assertions under the context of the broke-federal government surpassing $30 trillion was that even if you concede to Esther George’s ridiculous terms it still doesn’t change anything. So what if the Fed did manage -150 bps on the 10-year?
It wouldn’t change much or anything.
It is so indelibly and thoroughly underwhelming, even when giving LSAP’s and “monetary” policies every ridiculous benefit to every appropriate doubt. In any sort of rational sense, QE hasn’t left any mark on Treasury prices.
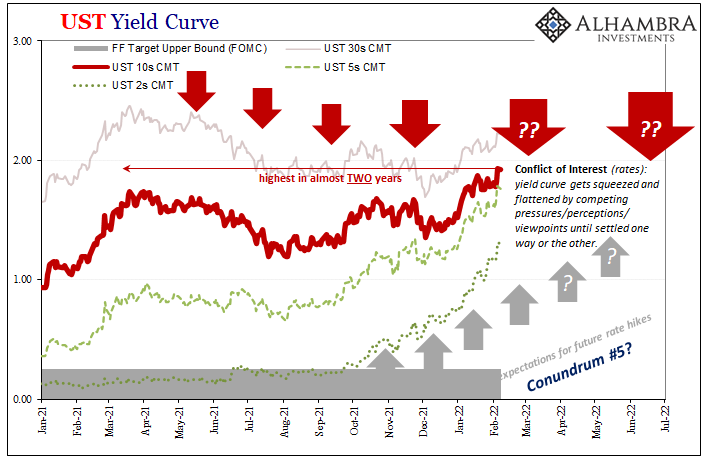
Which means the market wants them at almost any cost even as our broke government goes broker by the minute, by the second. As this continues to be the case (see: yields in 2022 despite QE being tapered and rate hikes looming in a matter of weeks), even though public debt itself moves toward $30 trillion, what of this discrepancy?
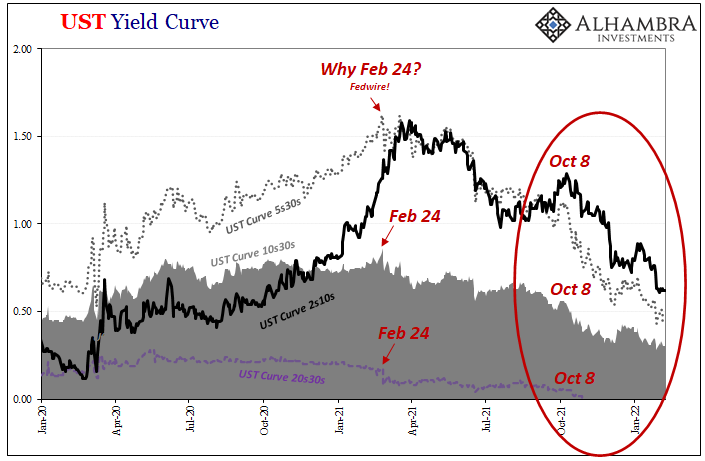
The answer to that question is the flat yield curve despite all those items listed at the start. Thus far, to early February 2022 (almost a full year following Fedwire), the yield curve’s signal holds up even as the Fed is buying fewer of whatever it buys because the Fed buying (or not buying) doesn’t matter, nor does the feds’ credit risk.
Safety and liquidity remain in far more long run demand relative to rate hikes, CPIs, $30 trillion, QT potential, etc.
Right now, investors are not fleeing toward LT Treasuries by any stretch; yields are up, pressured into selling by the short end priced on potential rate hikes. However, the market is not – despite every proclamation – wildly fleeing from them, either, which is what would be happening if bond buying had had any real impact.
And that’s just what all the studies, “their” own studies, really show. Careful wording aside, for all the sound and fury, QE is all hat and no cattle; lots of sizzle, never any steak. If LT yields go low, it’s because safety and liquidity; and if yields stay relatively low, it’s because safety and liquidity not the Fed.
The price is the price, so…yield curve post-October.
Stay In Touch