
NOTE: This post was written on Thursday, February 10.
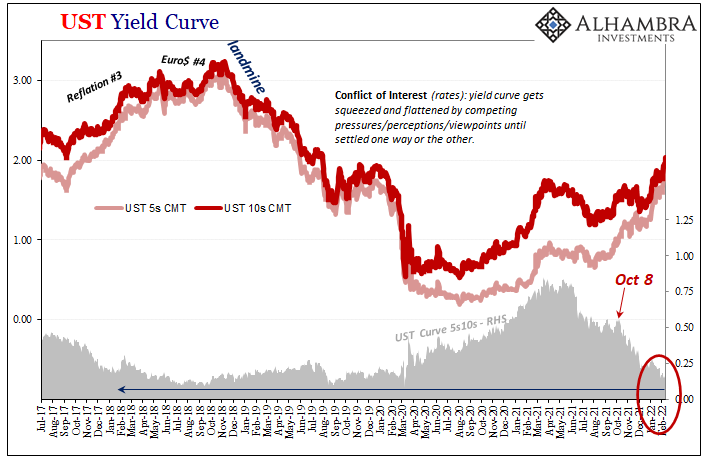
This isn’t typical. Both the speed at which this has come about and the depth to which the it has now sunk, the yield curve’s wild flattening is simply breathtaking. Today’s accelerating CPI print accelerated the distortions all over the Treasury market such that it has taken a shape along key parts of it unseen in very, very long times.
To start with, the yield for the 7-year Treasury note (7s) is now dead even with the yield for the 10-year benchmark (10s). Perfectly flat, fractions of a bps from inverting. We haven’t seen anything like this since February 2007.
Yep, this is fine. Nothing to see here. Completely normal. Jay's got it all under control.
— Jeffrey P. Snider (@JeffSnider_AIP) February 10, 2022
[actually, it suggests very high probability 'inflation' itself has already choked off growth potential as well as, well, 'inflation', therefore it's not inflation] pic.twitter.com/g4Xp1xf6J2
The crucial space between the 5-year (5s) and 10s dropped to a mere 7 bps spread. The curve didn’t get that low either in 2018 or 2020. The last time the 5s10s was close, first on August 14, 2019 (remember the recession “scare” that wasn’t a scare?) and then again on March 9, 2020 in the thick of GFC2. For each of those the 5s10s never went less than 8 bps.
You have to go back to June 2007 for when the 5s10s had last dropped to just 6 bps.
Obviously, none of these are very favorable comparisons; you can go back further in time to prior economic contractions and you’ll only find similar results on the yield curve before them, too. Flattening has never, ever been a good sign, nor has it meant anything like real inflation.
What is going on here? 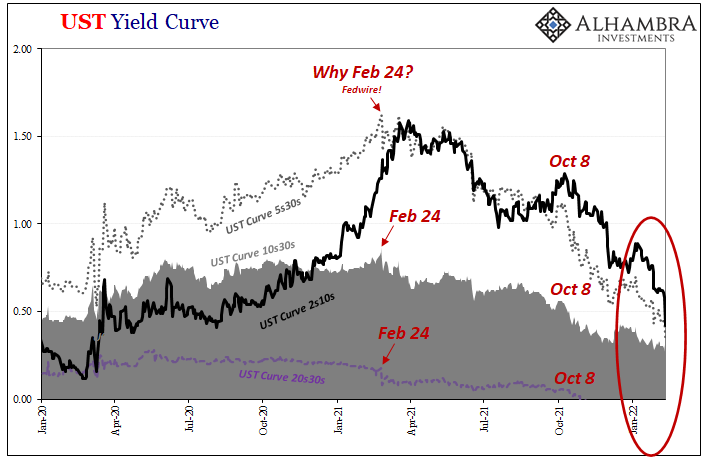
For one, the Fed. The higher the CPI goes in the interim the more policymakers are forced into rate hikes. They’ve brought this on themselves. Not only is there certainly political pressure to appear to be doing something about “inflation”, mainstream Economic theory (since there’s no money in it) looks at these same CPIs worried over the potential consumers might normalize to them (unanchored “expectations”).
Add to those the low unemployment rate, and it’s a recipe for possibly rapid rate hikes. Therefore, the short end of the yield curve.
At the long end, where flattening has gone nuclear, nominal rates are rising but even as they go higher they are outright resisting the rate hike-inspired pricing of ST yields. Today’s trading is another perfect example (as was last Friday’s payroll-inspired mess of statistics). The 2-year note rate jumped by 15 bps, compared to the 10s rising by “only” 9. The 2s10s curve space is now down to just 42 bps, and you can see why and it isn’t growth and inflation expectations rising at the 10s.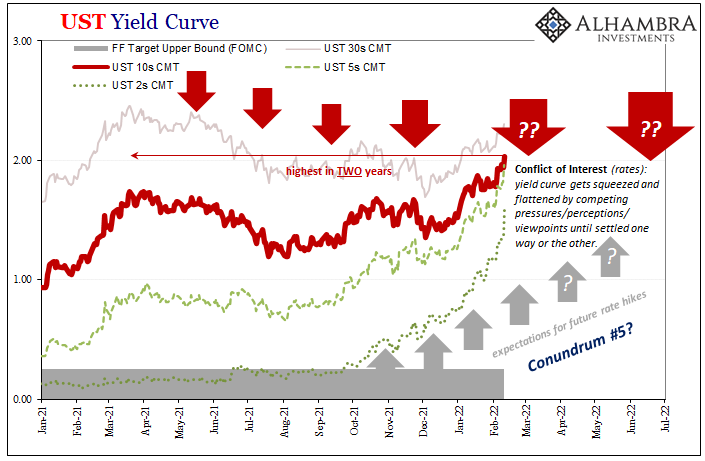
The 2s10s at 42 bps is June 2018 territory.
The latest CPI along with last week’s payrolls each will serve to justify Jay Powell’s likely super-charged hawkishness; therefore, ST rates. The implications of each, the possible real economic situation as very different from those justifications, are in lower future growth and inflation expectations which have been decline for almost an entire year.
Even inflation breakevens in the TIPS market haven’t moved, and are actually well off their late 2021 highs despite indicated consumer price acceleration in the very index that pays out for TIPS.
What these together indicate is the growing downside case of any classic supply shock, amplified to a great extent by difficulties in shipping goods.
The hashtag #emptyshelves trended several times in January for a reason, and it wasn’t money printing. Nor was it because the goods don’t exist or haven’t been made. Outside of autos and oil production, there’s inventory, a lot of inventory, which still isn’t cleanly and efficiently distributed to where it needs to go. Therefore, prices.
Because it isn’t monetary inflation (thanks, Emil), supply shock “inflation” will only redistribute economic activity, taking away from some parts of the economy in order for consumers to “pay for” others where prices must be met out of necessity.
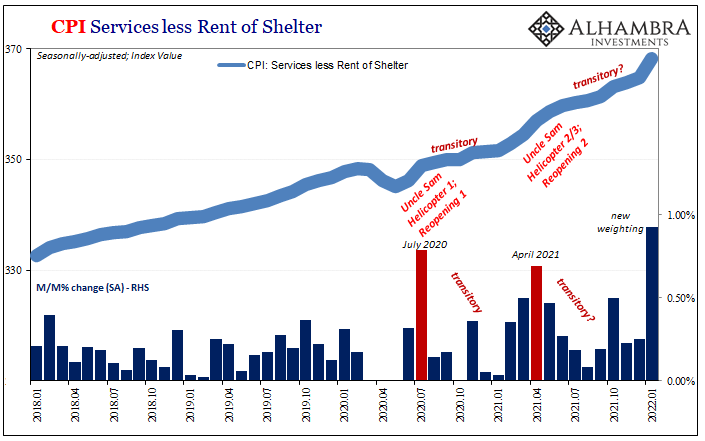
That has meant gasoline. January saw now-energy goods prices (core) up as they went missing from store shelves. It now means rent. Even services prices got in on it during January (even if some of it is the changeover in weightings; don’t ask). 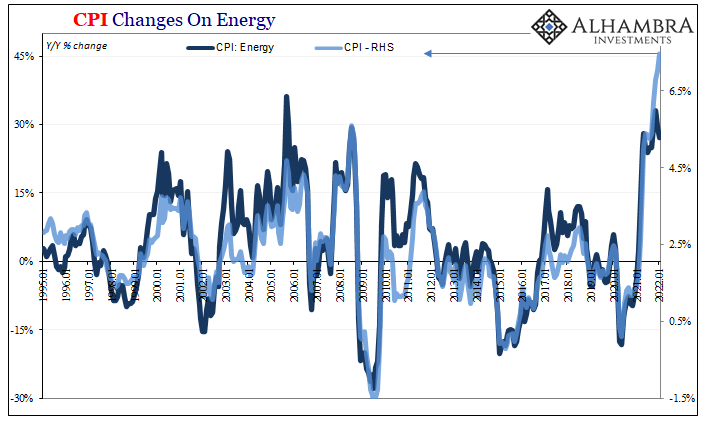
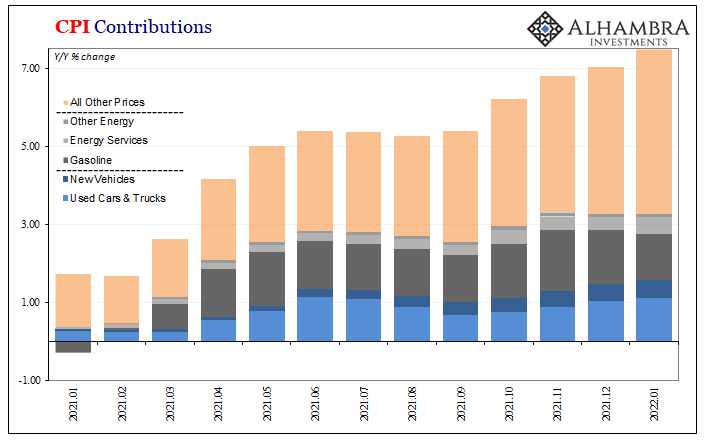
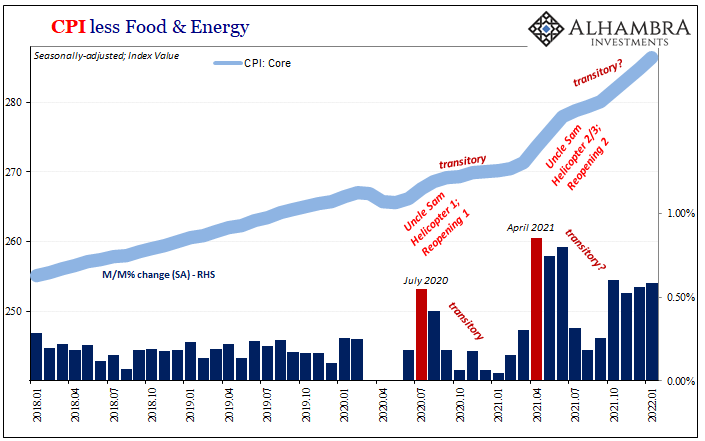
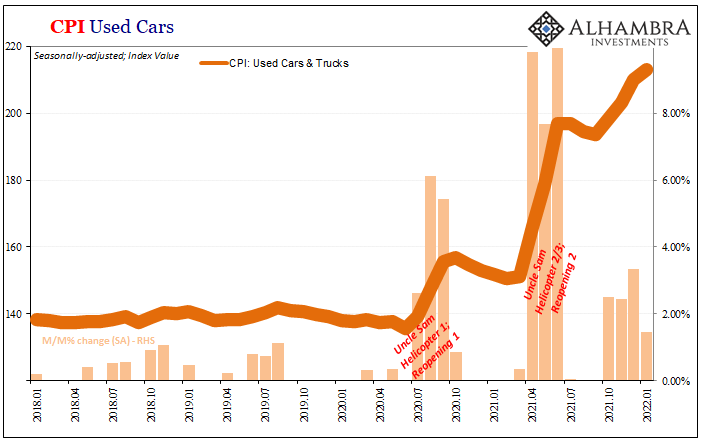
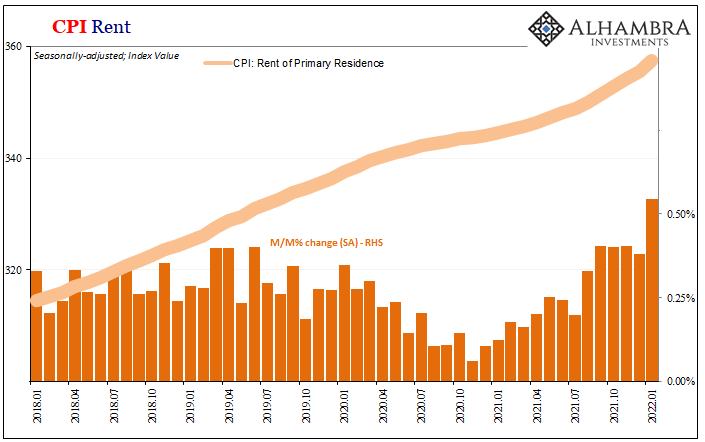
Today’s January 2022 CPI demonstrated these effects. Right where it hurts consumers the most: gas and shelter, to go along with food prices still rising more than they had pre-COVID.
It has become an even more toxic mix in the consumer bucket where it can do the most harm to an economy that hasn’t been doing all that well (see: payrolls and labor market still many millions behind February 2020 let alone the many millions more jobs that never happened). This is the dirty little secret behind the inflation numbers in 2021, now 2022: the price illusion obscured and obscures and economy that is not recovering (even the seasonal adjustments couldn’t erase the slowdown). 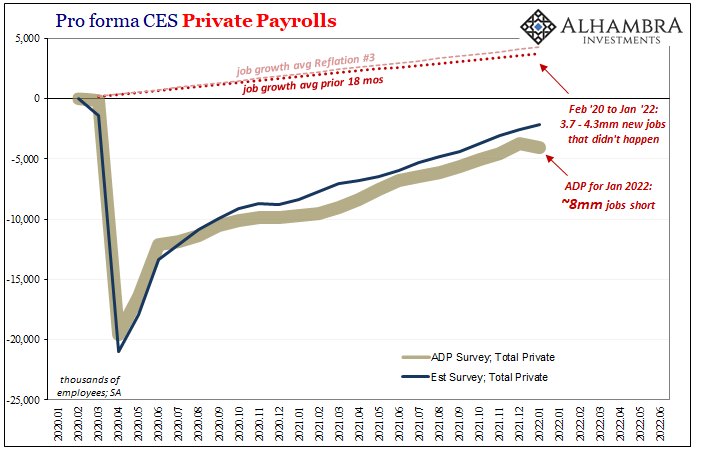
Jay Powell and the FOMC – largely because of expectations theory – cannot help but focus on the headline CPI rate (another 40-year high, this time 7.48% unadjusted year-over-year) rather than the implications of the rest of the data. With the core rate also accelerating, in good part due to rent prices, up 6.02% year-over-year unadjusted, policymakers really have left themselves with no options.
It doesn’t matter for rate hikes that the possible end of the supply shock may already be in sight (see: Mærsk). Since there isn’t yet any alternative for the FOMC but those hikes, therefore the short end of the yield curve prices a more aggressive Fed the more aggressive headline CPI rates go. The path of least resistance, for now, is for higher up at the front.
The fallout of weak economy plus “inflation” pain has now produced the classic back-end result, too, the collision of ST yields with the skeptical long end. These new low calendar spreads all over the yield curve which are comparable only with prior obvious downside cases is itself a warning in opposition to the Fed’s position. 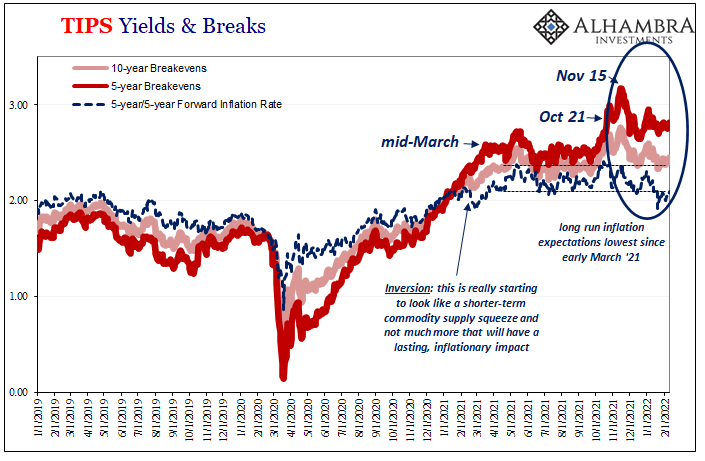
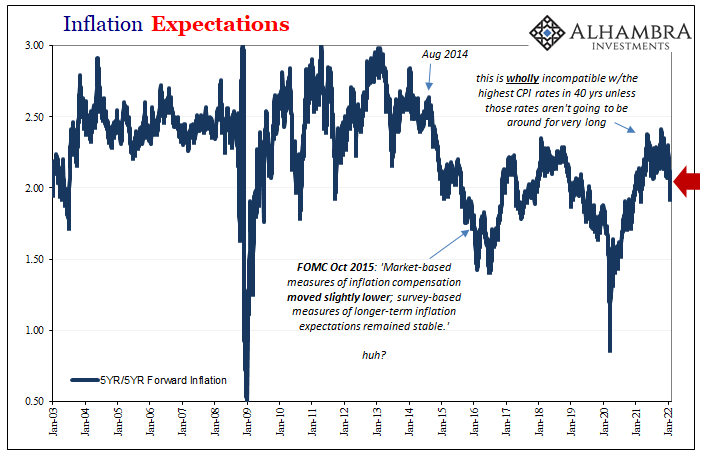
You’d think on a day when the CPI edges yet closer to something like the Great Inflation, the TIPS market especially long run inflation expectations (the very thing “expectations” policy is concerned about becoming unanchored) would trade at least in that direction. Instead, just like the long end of the yield curve, it’s far more consistent with growing potential for the supply shock downside.
Conflict of interest (rates). Conflict of “inflation.”
Stay In Touch