

Remember, your goal in investing isn’t to earn average returns; you want to do better than average. Thus your thinking has to be better than that of others – both more powerful and at a higher level. Since others may be smart, well-informed and highly computerized, you must find an edge they don’t have. You must think of something they haven’t thought of, see things they miss, or bring insight they don’t possess. You have to react differently and behave differently. In short, being right may be a necessary condition for investment success, but it won’t be sufficient. You must be more right than others…which by definition means your thinking has to be different….
For your performance to diverge from the norm, your expectations – and thus your portfolio – have to diverge from the norm, and you have to be more right than the consensus.
Howard Marks
That is the best description of contrarianism that I’ve ever run across. The word contrary is used to describe two things that are exactly opposite or entirely different. In the south, where I’ve lived most of my life, it is used to describe someone who argues for the sake of arguing – “He’s a contrary cuss”. In investing, it is more subtle than that; contrarian investing isn’t just about doing the opposite of the consensus because, as Keynes allegedly said, “the market can remain irrational longer than you can stay solvent”. Just to be a little contrary, what he actually said was: “There is nothing so dangerous as a rational investment policy in an irrational world”. Irrational in the investing pundit world is generally defined as any view that is contrary to mine.
So, to generate better than average returns, your portfolio must diverge from the norm – but only when the norm reaches such an irrational state that normally rational people start to think that the irrational is actually quite rational. The perfect contrarian opportunity is one where you are the last rational person in an irrational world – which is, of course, quite irrational. A tricky balancing act to be sure and something that can’t be attained without knowing what the consensus actually is at any given moment. Which is, of course, made more difficult by our own views of what is rational, irrational or just plain nuts. There are numerous ways to determine the consensus from surveys to futures market positioning to mutual fund flows to the covers of magazines. But there is no scientific way to determine the consensus or when to embrace it or fade it.
There is nothing reliable to be learned about making money. If there were, study would be intense and everyone with a positive IQ would be rich.
John Kenneth Galbraith
Personally, I think the only thing that matters in these matters is experience. There is no certain way to know when we’ve reached that point of maximum pessimism (optimism) that Sir John Templeton told us was the greatest time to buy (sell). But when you’ve been doing this a long time, you can sort of sense when we’ve reached that point. And if you’re wrong, you’ve been that way so many times across a long career that admitting it and taking a loss isn’t as painful as it was when you were young and thought you knew way more than you actually did. Of all the things I’ve learned across 40 years of investing, the most important is that an ego is a terrible thing in this business. And if you have a big one, the market will do everything in its power to make sure it is deflated, along with your net worth.
And yes, since I’m writing about being contrary, I am of the opinion that we may have reached one of those points in time that requires us to, at least, start thinking about bucking the consensus. So what is the consensus today? The monthly Bank of America fund manager survey provides some insights (from Bloomberg):
The share of investors expecting the economy to deteriorate is the highest ever, according to the April survey. Stagflation expectations jumped to the highest since August 2008, while monetary risk increased to a historic high, BofA strategists said, after surveying 292 panelists with $833 billion in assets under management in the first week of April.
It probably isn’t news to most readers that people are not exactly thrilled with the current state of the economy. Most of that has to do with inflation but also about the Fed’s response to it. Jerome Powell is about the only person on the planet who thinks the Fed will pull off the ever-elusive soft landing. You can see the same negativity in the University of Michigan survey of consumer sentiment. While there was an uptick in the preliminary April numbers, sentiment has recently been trending lower, hitting 59.4 in March of this year. Readings that low have only ever been recorded during recession. I’ve written before about the political divide within this survey and that persists today, where the current reading for Democrats is 86.5 (good but not great) while Republicans clock in at 48.7 (awful). There has always been this bias in the survey although today does look more extreme than in the past. In another recent survey, only 51% of Americans believed that jobs have increased over the last year. The actual number of jobs added is almost 6.5 million. That’s a political divide that will not be spanned by reality.
But what does a low reading on consumer sentiment actually mean to an investor? Forget whether the survey provides any information about the future economy; what does it mean for markets? Other dates with readings this low were February 1975 (57.6), May 1980 (53.6), April 1982 (64.7), December 1990 (65.1), December 2008 (57.7), and October 2011 (58.7). The lowest reading in 2020 during the worst of COVID was 74.1 in June 2020. While those were not all ideal times to buy stocks, the downside risk on most of those dates was pretty minimal. Some of them were great – not good – times to buy. The lone exception was December 2008 when stocks still had another 25% to fall before making the final low in March 2009. But if you bought at the end of 2008, you were on the plus side by May 2009. In other words, consumer sentiment, which is very negative right now, is a contrarian indicator for investors. I’m not saying you should back up the truck but your inner contrarian ought to at least be doing some window shopping right now.
What else is consensus? The most obvious next choice is commodities which have gone straight up since the April 2020 lows. From the B of A survey:
Investors are very long cash, commodities, healthcare and energy, and materials while they shun bonds, discretionary and euro-area stocks…Investors are now the most net overweight ever for commodities; long oil and commodities is the most crowded trade, followed by short U.S. Treasuries and long tech stocks
That’s pretty much the consensus right there. Investors seem to be scared of inflation and also worried about recession. I guess there is some possibility of stagflation – some would say we’re already there but I’m not one of them – but it isn’t a high probability event. In fact, I’d say we’re missing a pretty key ingredient – a weak and weakening dollar. The primary driver of inflation/stagflation in the 1970s was the weak dollar in the post-Bretton Woods era. The commodity bull market that ran from 2002 to 2008 was also driven by a dollar that fell nearly 40%. That isn’t the case this time and I think that makes the commodity bull market quite vulnerable. With real rates rising recently, the commodity bull may be getting long in the tooth. Anything that brings supply and demand back toward balance could change the dynamic pretty quickly.
Bonds just had their worst quarterly loss since at least 1980 and have continued to fall in Q2. The aggregate bond index is down nearly 9% YTD while 7 to 10-year Treasuries are down nearly 10%. The 20+ year Treasury ETF (TLT), the favorite trading vehicle for the deflation camp, is down 18% while corporate bonds (LQD) are down over 12%. Historically, buying after a drawdown like that has been a pretty successful strategy. Looking at annual T bond returns, there have only been two back-to-back yearly losses since 1928 (1955 and 1956, 1958 and 1959). All other yearly losses were followed by gains. And by the way, during that supposedly awful time for bonds, the 1970s, there was only one down year (1978), and that by a fraction of a percent. So, it probably makes sense to start looking at bonds for some future positive returns. We recently extended the duration of our bond portfolio modestly. Why not extend it more? Well, that consensus negativity about the economy is one reason. If the consensus on the economy is wrong, if the economy isn’t awful and getting worse, then looking for a big gain in long-duration bonds is probably not a great idea. Another reason is that despite that nearly 20% loss in TLT, the fund has continued to draw inflows. There was $19.76 billion in the fund on 12/31/21 and after an 18% drawdown, current AUM is $18.55 billion. Investors are still strongly buying the dip in long-term bonds. That isn’t true of the corporate bond ETF by the way. Just something to consider, especially if the negativity about the economy turns out to be overstated.
The other crowded trades are a mix of commodity-related (energy, materials) and defensive (cash, healthcare, utilities). Both energy and materials stocks look cheap based on current earnings but energy stocks are dependent on crude oil and natural gas prices while materials are more economically sensitive. Utilities look quite vulnerable trading at over 20 times earnings and single-digit earnings growth. I suspect a lot of people are buying electric utilities in anticipation of rising demand from EVs but I think there is considerable room for disappointment on that front. Healthcare, on the other hand, trades for a cheaper multiple than utilities (and the market) with higher earnings growth. And within that sector, pharma and biotech stocks (we own some of both) still look cheap in a field that is still spending considerable dollars on R&D. Consumer discretionary stocks are down over 12% YTD and yet still look overpriced but Euro area stocks might be worth a look if the Euro stabilizes. The Eurozone ETF trades for 13 times earnings (but who knows what they’ll be next year) with higher historical earnings growth. For a more diversified approach, the EAFE value index (EFV, we own) trades even cheaper and reads like a who’s who of non-US multinationals (Top 10: Shell, Novartis, BHP, Toyota, HSBC, Sanofi, Nestle, Total, Glaxo SmithKline and BP). No one wants to own international right now and I understand that with the strong dollar but these stocks are cheap.
Finally, we come to cash which is finally throwing off some return after years of zero. No, it isn’t much and it is a loser on a real (after inflation) basis. But it doesn’t go down and has been an addition to returns this year because of that. But with short-term rates up considerably, it pays to extend the maturity of your cash holdings some. Six-month T-bills currently yield around 1.2% while 1-year paper yields 1.7% versus less than 0.5% for money markets (and considerably less than that at the major brokerage firms). Do you really need overnight access?
I obviously can’t say for sure that we are at a turning point, that the consensus is so consensus that it must be faded. But there are parts of the market today where a dissenting voice is hard to find. The negativity about the economy is pervasive and not supported by the economic statistics, at least for now. The last time “recession” was more searched on Google was in March of 2020. Prior to that, the last time recession surged as a search term was in August of 2019 which you might remember was the month the yield curve inverted. That is probably no coincidence either and I am still wondering how much the publicity about the yield curve will affect its usefulness. Other than that, since 2004 the only other time it was so popular was in 2008. Needless to say, today’s economy is nowhere near as stressed as it was in 2020 or 2008.
——————————————————————————————————————————————————————————————————————————————————————————————————————————————–
Environment
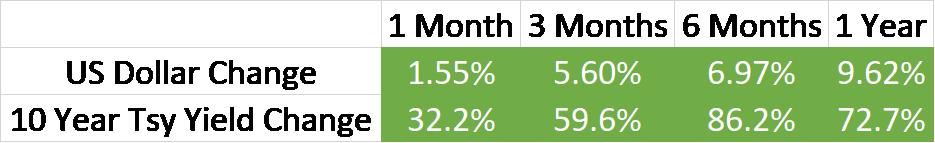
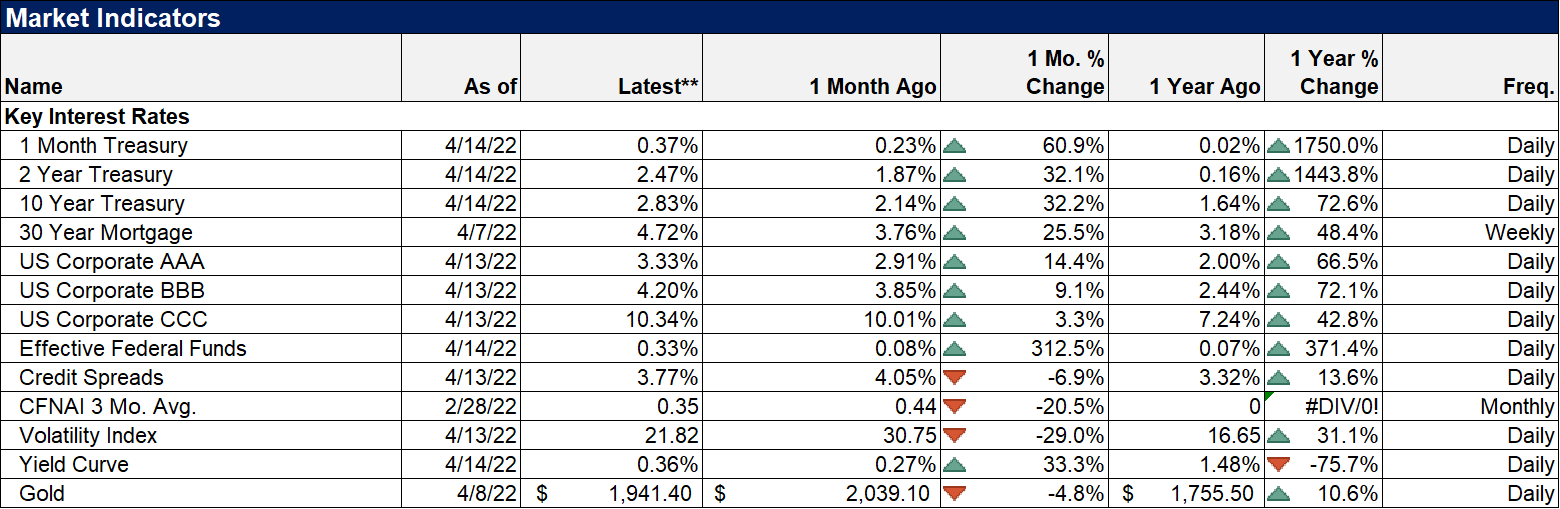
The rising rate, rising dollar environment remains intact. The yield curve steepened more last week as the 10-year yield continued to rise as the 2-year stalled. Since the inversion on April 1, the 2-year yield is up just 3 basis points while the 10-year is up 45 basis points. The 10-year was up 17 basis points in just 4 trading days last week while the 2-year yield was unchanged. This is not the rapid steepening we see just prior to recession when short rates collapse in anticipation of Fed rate cuts. All this means right now is that expectations for the Fed’s rate hiking this year appears to be fully priced into the short end of the market. The fact that the long end continues to rise would seem to indicate the market also thinks that might not be enough. TIPS yields were up last week too but the 10-year was only up 9 basis points so inflation expectations rose slightly.
The dollar had another good week and the Dollar Index closed over 100. We are right at the top of that seven-year trading range and traders are quite long but with ECB last week sounding a tad more dovish, the Euro may take the torch from the Yen and keep the index rising. One good thing is that the EM dollar index isn’t yet following the major currencies. As I said last week though, if Chinese economic weakness continues, the Yuan seems destined to fall. How that impacts other EM currencies will be interesting, to say the least. For now, the rising dollar is primarily a developed market phenomenon and is acting as a headwind for investments in Europe and Japan.
Markets
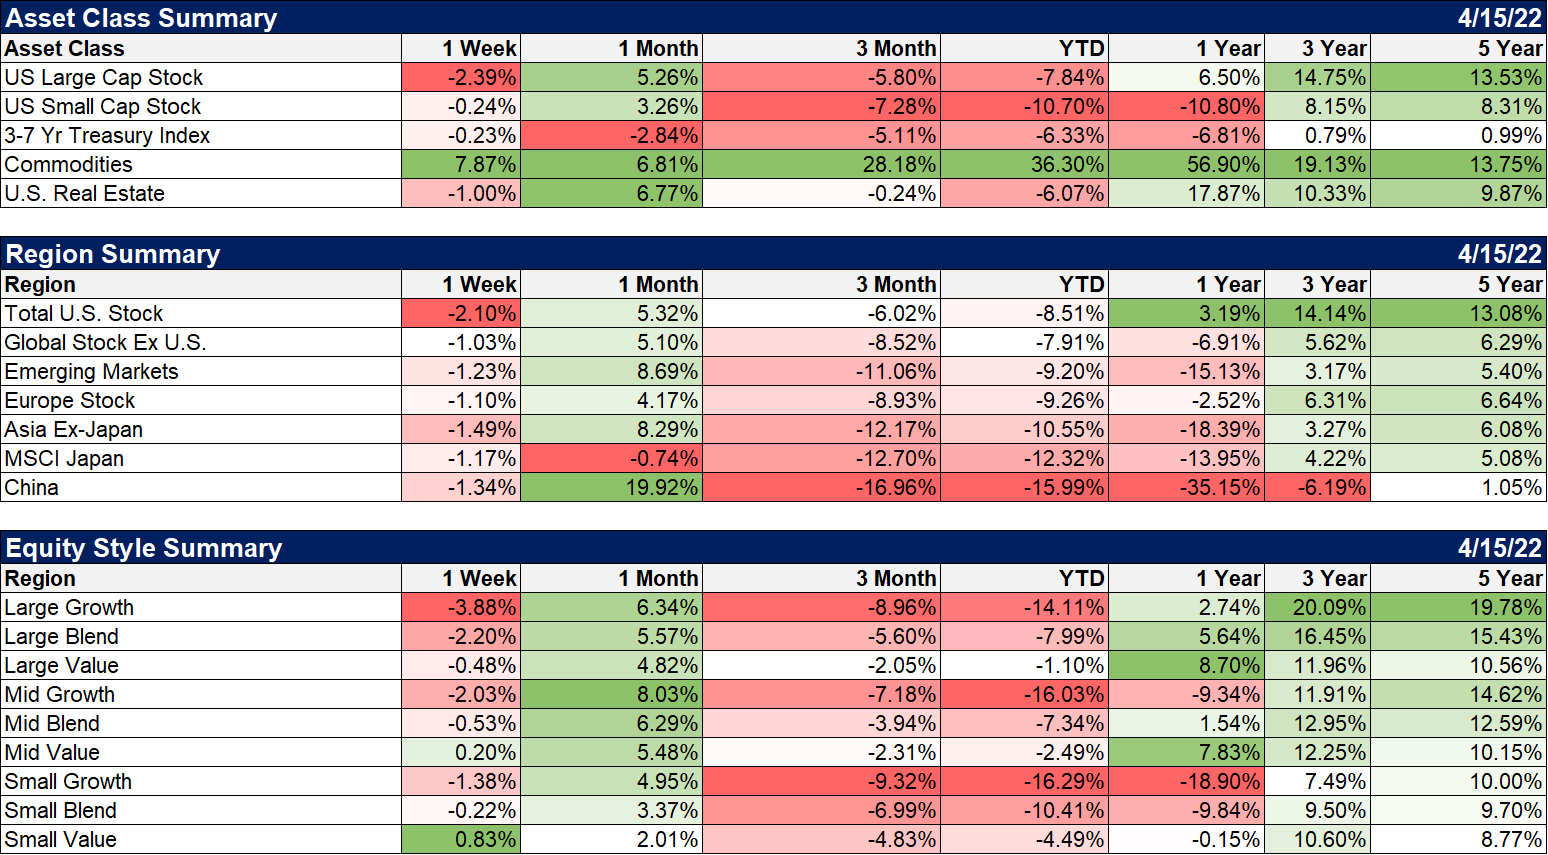
Stocks were mostly lower last week with small and mid-cap value the exceptions. Commodities resumed their run higher but are still below the high set in early March in the wake of the Ukraine invasion. Energy was the big winner with natural gas and crude oil both up double digits on the week. The rally was broad-based though with metals and ags up too. Gold rose a little over 2%. The continued strength of commodities and gold in the face of a higher dollar is impressive but I do wonder how long it can last. If peace breaks out we could get a rapid reversal but that seems unlikely in the short term.
Energy, materials, and defensive stocks are the crowded trades and they continued to work last week.
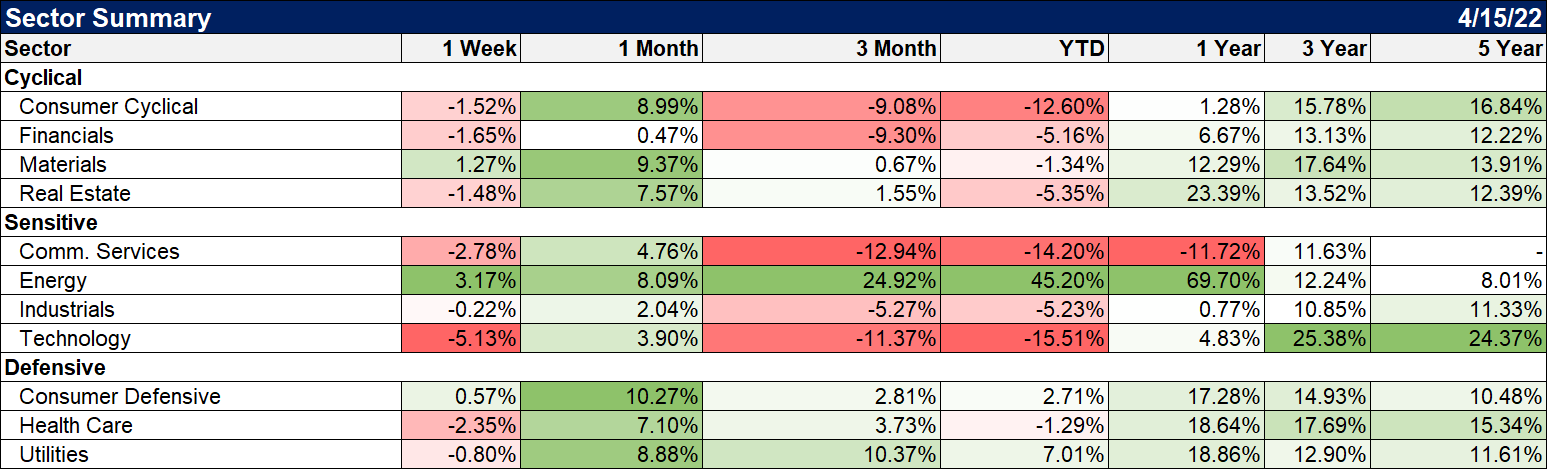
It always feels good to be in the consensus and it works a lot of the time. That’s what momentum is and why it works. But all trends come to an end and the biggest ones end when the consensus reasoning is overwhelming and obvious. It can take a long time to finally break the true believers in a long-term trend. You might have noticed in the B of A survey above that technology is still an area considered a crowded trade on the long side. The sector is down 15% YTD and nearly 20% at the lows and yet the ETF continues to attract new money. Ark Innovation ETF is down 37% for the year and is still attracting new money. I doubt the underperformance of tech is over.
You can’t outperform if you are doing what everyone else is doing. But you also can’t just buck the consensus, be contrary for the sake of it. Some consensus trades will continue to outperform and continue to be the consensus. Separating the two is how you generate those better than average returns. It isn’t easy though which brings me to one last quote for this week:
It’s not supposed to be easy. Anyone who finds it easy is stupid. – Charlie Munger
I’d just add that those who find it easiest at any given moment are the ones who are about to find out exactly how hard it really is. I’d say that the guy who bought the NFT of Jack Dorsey’s first tweet falls in that category. He bought it just about a year ago for $2.9 million. He put it up for sale recently asking for $48 million. Top bid as of last week? $6800. Personally, I think that is still too pricey.
Joe Calhoun
Stay In Touch