

I am changing the format of these weekly updates. Rather than publishing one long weekly note, the weekend note will cover just the market and economic news of the week. The general commentary portion will be published another day during the week. We will also be publishing some new research notes during the week. The Monday email will include links to everything we publish during the week. There’s a sign up form for the weekly newsletter in the right column of the market research page.
Joe Calhoun
Environment
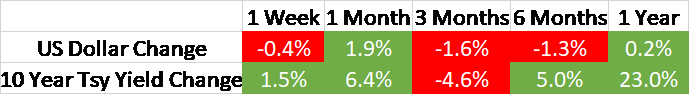
The 10-year Treasury yield was modestly higher last week but the trend – or lack thereof – hasn’t changed. The 10-year rate is still in the same short-term downtrend/neutral pattern it has been in since peaking in October. We may get some clarity on the future trend this week with the latest CPI reading and the June FOMC meeting.
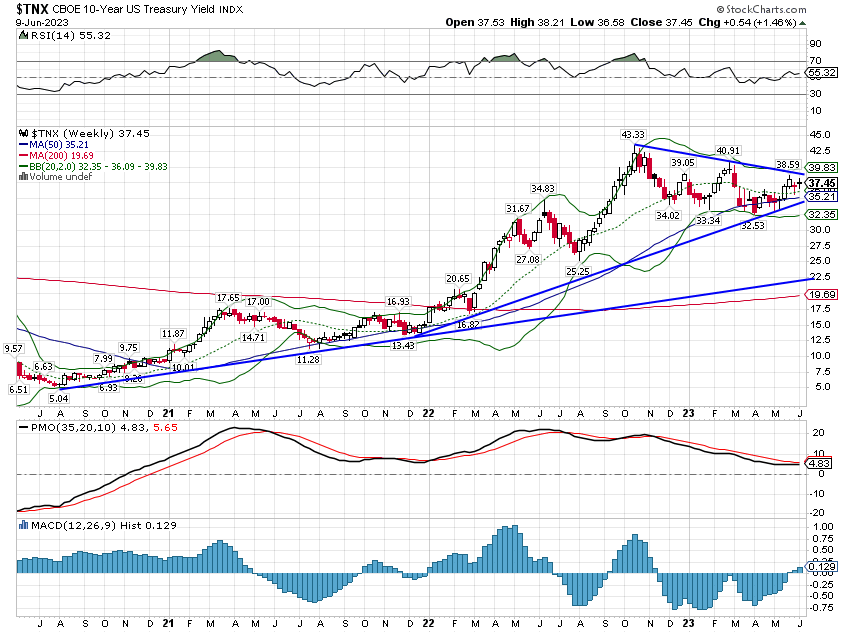
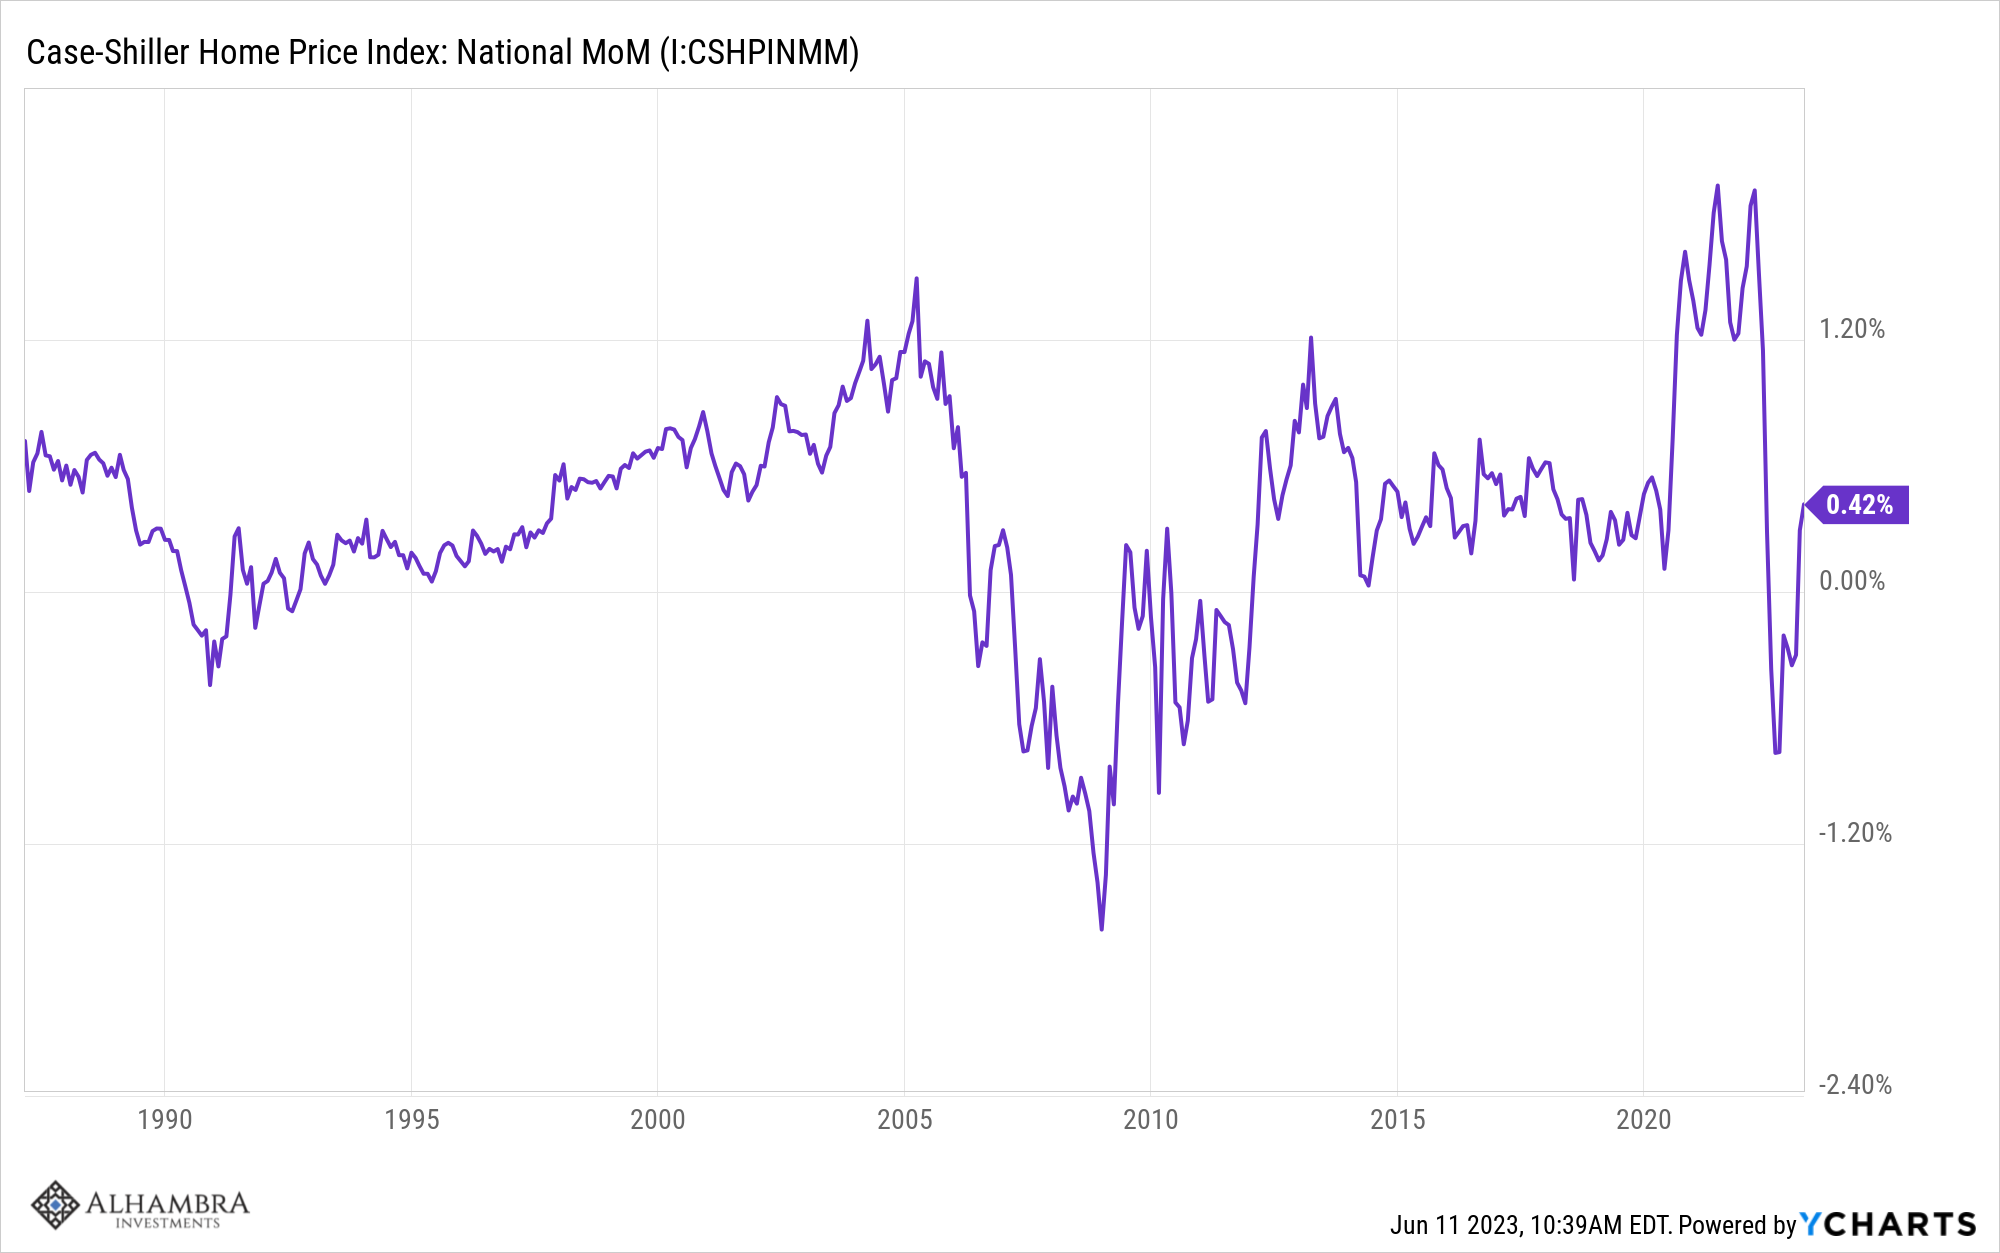
The 2-year Treasury yield was also higher and, like the 10-year, continues to meander sideways. Shorter-term bill rates (1- and 3-month) were a tad lower on the week but no trends have changed. I don’t know which way rates will go from here but there has been a widespread expectation that inflation would moderate this year as lower house prices feed through to lower rents in the CPI. That may prove true in the very short term but house prices haven’t really come down that much so I’m skeptical it would be the start of a trend, even if the release next week shows a slowdown in inflation. The Case-Shiller national home price index peaked in June of last year and the subsequent price drop took prices all the way back to where they were in…March of last year. If you’re looking to real estate for a moderation in core CPI, you might be looking in the wrong place.
The dollar was down slightly on the week but its trend hasn’t changed either. The buck also peaked last October but it has fallen more than rates. For the year the dollar is essentially unchanged, up a mere 0.3%. Like interest rates, the dollar’s trend is sideways.
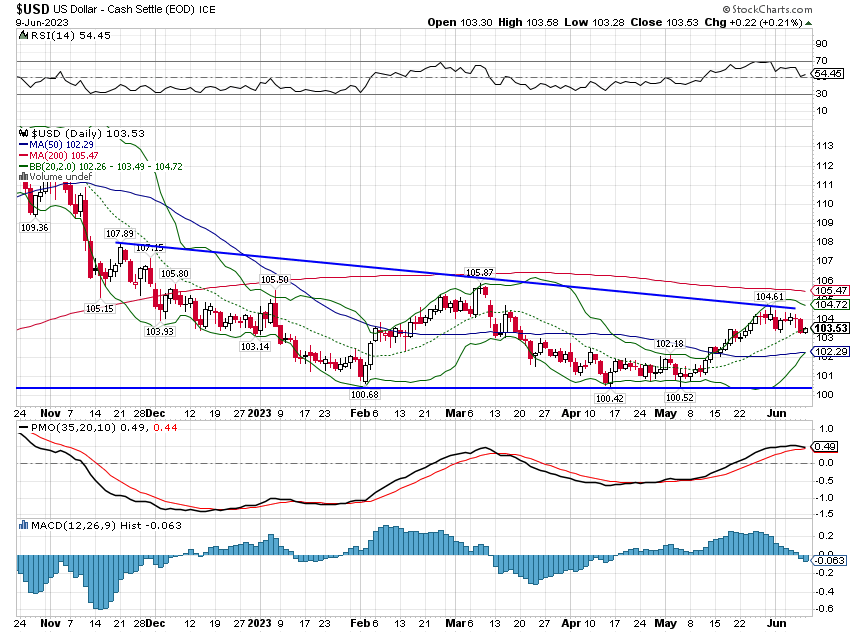
How that changes will be determined by a number of factors but it really comes down to relative growth between the US and the rest of the world. In the US, growth expectations have been remarkably stable despite all the talk of recession. Nominal and real interest rates have barely budged this year and so the difference between the two hasn’t either. The 10-year TIPS yield is down 5 basis points this year and the 10-year nominal yield is down 15 so 10-year breakevens are down just 10 basis points.
Meanwhile, European growth has been weak with a lot of people claiming the continent is in recession. It is true that GDP growth in Germany was negative for two consecutive quarters but with the DAX still near its high, it doesn’t seem to be striking fear in the hearts of investors. Overall, I’d say that European growth has certainly downshifted but so has the US and the relative change is small.
Japan’s Q1 GDP was revised up significantly last week and the perception of Japan is changing rapidly. The gain in Q1 GDP was due to investment (although partially in inventory) while domestic consumption remains weak. That isn’t surprising with real incomes still falling due to high inflation (or what passes for high in Japan). But Japan’s economic future is more about what happens outside Japan than inside. I’ve said for quite a long time that Japan is well-positioned to benefit from any pullback from China and that hasn’t changed. But that also means that a global slowdown will have a bigger impact on Japan than an economy – like the US – less dependent on exports for growth.
With no direction on rates or the dollar, big bets on asset allocation would seem unwise. The assets that perform well when the dollar is rising are quite different than the ones that work with a weak dollar. We have a bias to a weaker dollar in our portfolios for now but that was initiated when the dollar reached an extreme peak last year and the overwhelming consensus was bullish on the buck. There aren’t really any extremes in positioning right now and sentiment is pretty neutral. We’ll wait for a new trend to emerge. Currency trends tend to be persistent so be patient.
Markets
The rest of the market started to play catch up to the large-cap growth segment last week. Small caps, REITs, and commodities were all higher while large-cap growth sold off modestly. But the news of the week was that the S&P 500 rose (briefly) 20% above its October low. That move was hailed by some as the start of a new bull market and sentiment is certainly tilted bullish. Well, maybe a little more than tilted. Here’s the cover of Barron’s this week:

Barron’s covers are a reflection of the mood of the market and there is no doubt the bulls have been winning the battle recently when it comes to large growth stocks. But large growth stocks aren’t the market and how things go from here will depend on a lot of things we can’t predict, like the arrival of the long-anticipated recession. If this is really the start of a new bull market, we would expect to see the rally broaden out and start to include more stocks. We saw some of that last week with small-cap stocks but the perception is still that the advance is very narrow.
Maybe, but I think what matters is the trend. Right now 57% of the stocks in the S&P 500 are above their 200-day moving average (a common dividing line between uptrend and downtrend) so the majority of stocks in the index are in an uptrend. The long-term average is 62% which makes sense as the market rises over time. But, more importantly, the trend is, for now, up.
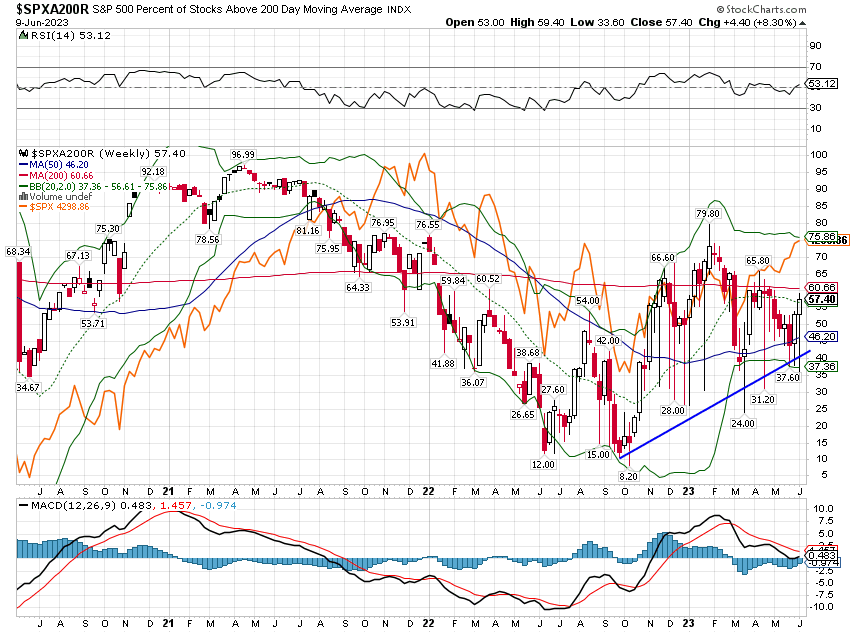
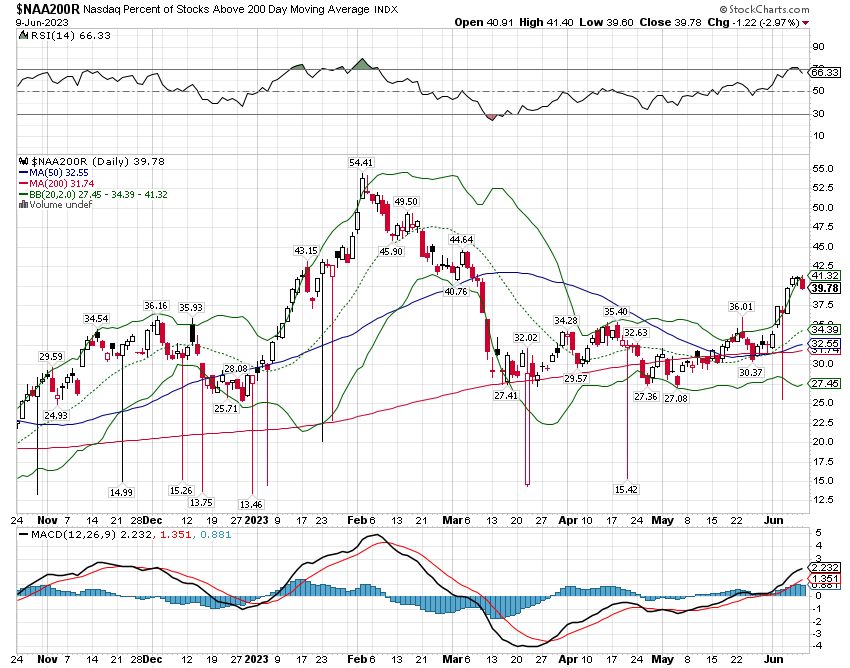
What really matters are the extremes. This metric hit 97% in early 2021 and 8% at the low in October and both were near turning points. There’s an old saying on Wall Street that tops are a process and bottoms are an event and you can see that here. The S&P 500 (orange line) continued higher after the peak but the bottom for stocks was coincident with the bottom for this indicator. The point is that we aren’t anywhere near either extreme right now and it is in a rising trend. The NASDAQ measure of this indicator is even lower at around 39%. So, yes, the advance is pretty narrow. But that isn’t surprising with the bottom of the market just 6 months ago. And more importantly, the trend is up:
We look at sentiment in a lot of ways and there is no doubt that it is quite bullish right now so a correction of some kind would not be surprising in the least. The Barron’s cover could mark some kind of short-term top, but it doesn’t have to be something extreme; the dollar fell after Barron’s ran a bullish cover last October, but it didn’t crash.
Could a correction be confined to large-cap growth? Well, I suppose anything is possible but that isn’t how it usually works. Other parts of the market could and probably will outperform large-cap growth in a correction but they could still fall too. But a return to the extreme low seen in October this soon seems unlikely based on history.
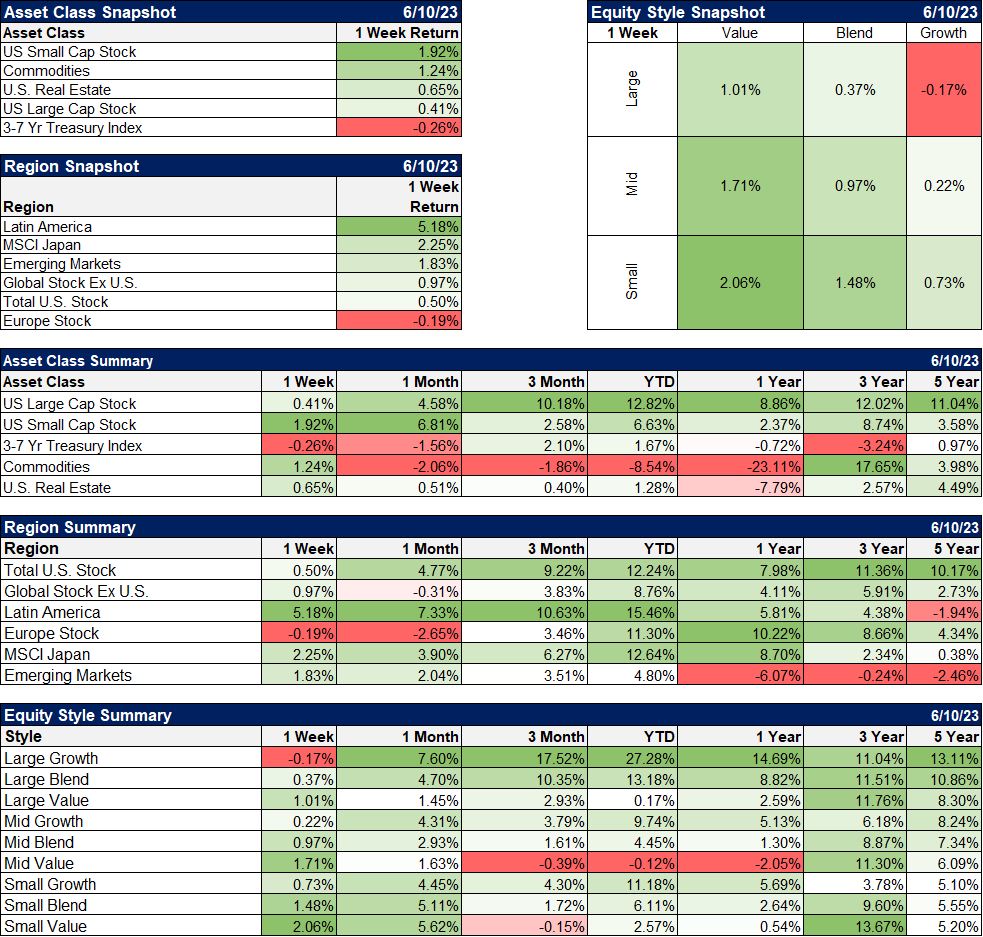
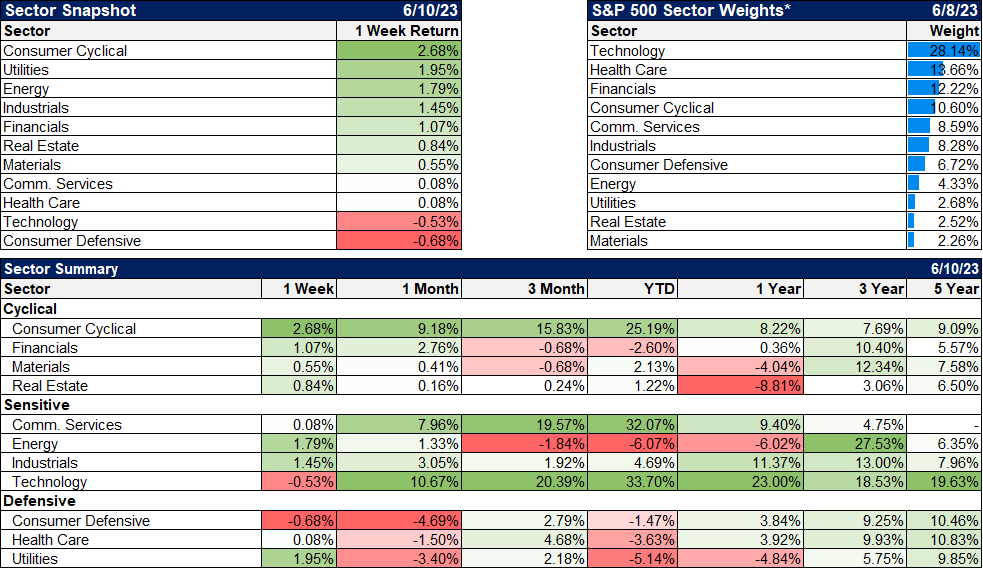
Cyclicals led the market last week but a lot of that was Tesla which makes up nearly 18% of the consumer discretionary sector ETF and rose 14% last week. The other automakers were up strongly too but again, that was more about Tesla as Ford and GM both signed deals for their cars to use Tesla’s charging network. There were some other winners in the sector but overall it was a pretty mixed picture.
On the other hand, the rally was more broad-based than recently with 9 of 11 sectors higher for the week. YTD gains are still concentrated in technology, communications (which is mostly tech too), and cyclicals (consumer discretionary). If this is a new bull market we would expect to see the rally continue to broaden out to include more sectors.
Economic/Market Indicators
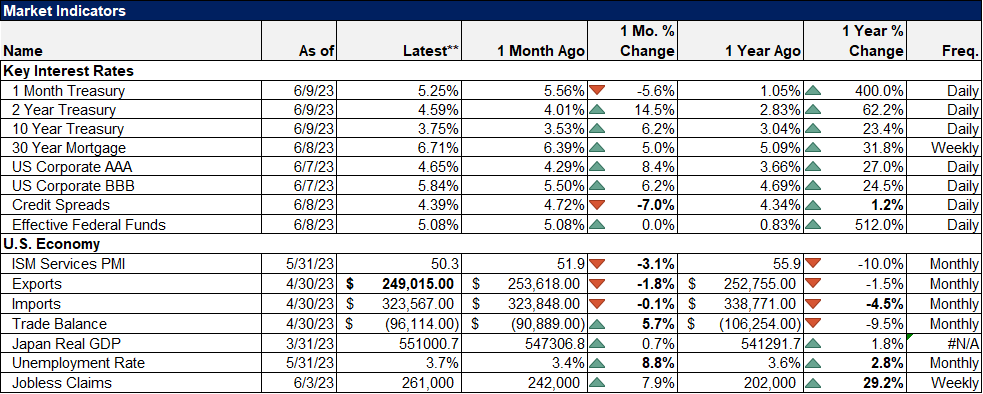
There wasn’t a lot of economic data last week so there wasn’t much change in short-term rates markets. The market is currently pricing a 70% probability of a pause – or skip or whatever you want to call it – at this week’s FOMC meeting and a 38% chance that rates are unchanged by the December meeting.
The ISM services index was weak at 50.3 although the S&P services PMI moved in the opposite direction to 54.9. I am still not sure whether to trust the S&P version of these PMI surveys. It is a broader survey so theoretically it should be better but it doesn’t have the history of the ISM version (although frankly, neither has a very long history). I will continue to place a higher weight on the ISM version until we get some evidence the S&P version is reliable.
We’ve been writing about the contrast between goods and services for over a year and so far it has played out pretty much as we expected. The goods side of the economy has slowed (although much of that was due to inventory from supply chain issues) while the services side continues to recover from the COVID shutdowns. We may be at a point now where these are starting to reverse again. Inventories haven’t risen in months and if sales don’t slow soon, production will have to ramp up. Don’t be surprised if the ISM manufacturing survey starts turning up from here.
COVID was an earthquake for the economy so maybe it isn’t a coincidence that a lot of the economic data charts look like seismographs.

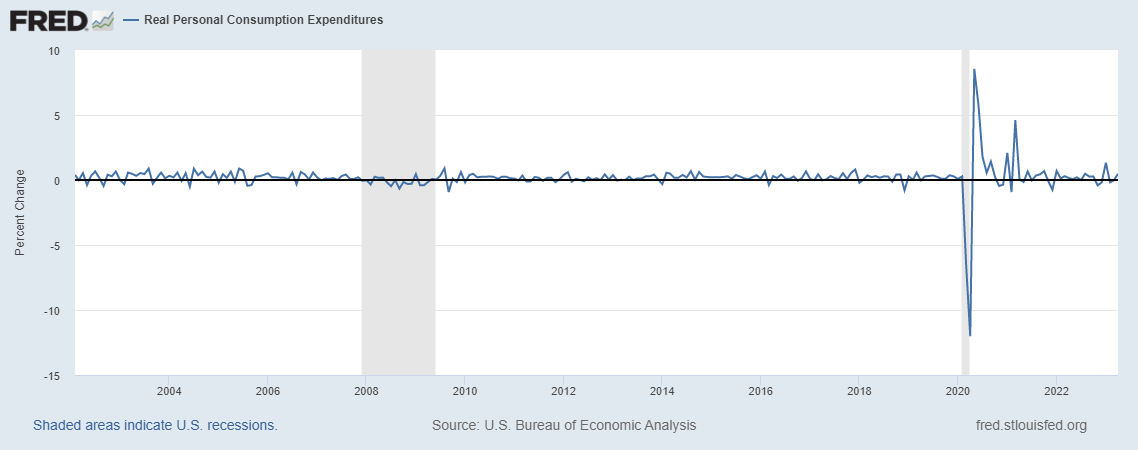
Even now, 3 years after the onset of COVID, we still see higher volatility in the month-to-month data on real personal consumption than prior to COVID. Goods consumption year-over-year is now back in positive territory and trending higher while services is positive but trending lower. The two tend to move together although goods consumption is more volatile.
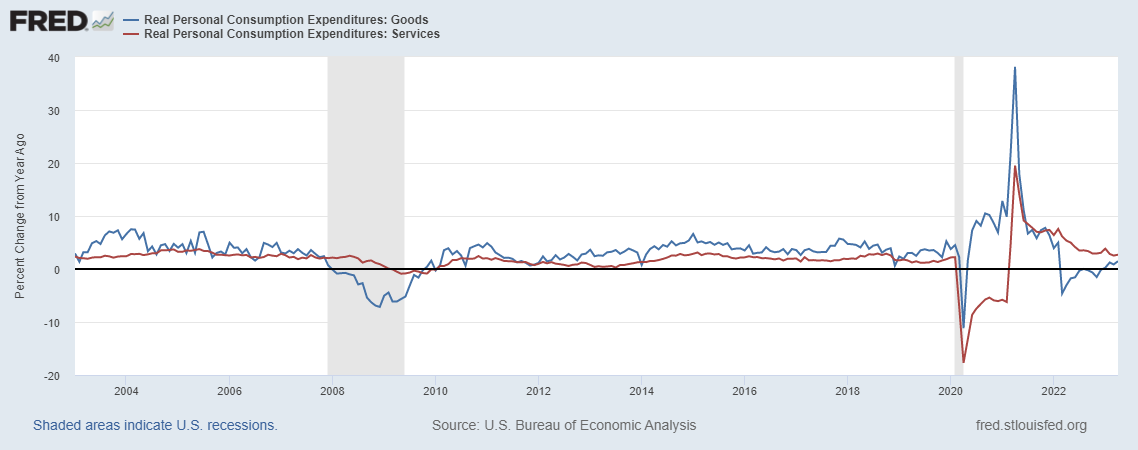
At some point they should sync up again and start moving together but when is anyone’s guess. In the meantime, expect more aftershocks.
Joe Calhoun
Stay In Touch