

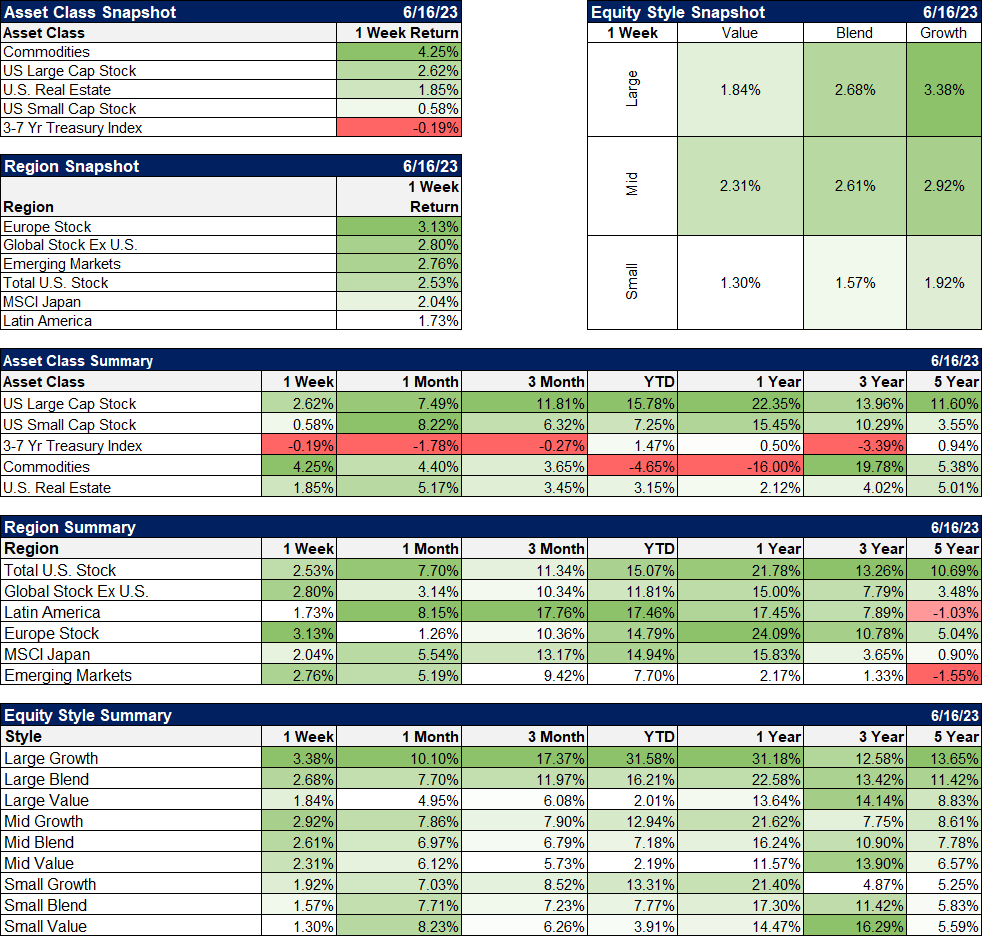
Everyone knows that growth stocks have been on a tear this year but what is more interesting is the divergence in performance between indexes with similar names. The Russell 1000 and the S&P 500, the two main broad US large-cap indexes, are both up about 15% this year. But the growth and value versions of these two indexes have produced very different results. On the value side, the Russell 1000 is up just 4.25% while the S&P version is up 11.3%. Why? Well, the makeup of the two indexes is very different.
The S&P 500 value index, according to Morningstar, trades for 16.5 times forward earnings estimates, 1.6 times sales, and about 11 times cash flow. 26% of the assets in the fund are in the top 10 holdings and 19% of the fund is in technology. The Russell 1000 value index trades for 14 times forward earnings estimates, 1.4 times sales, and 8 times cash flow. 19% of the fund is in the top 10 holdings and technology is 9.5% of the fund. While the headline P/E and P/S aren’t that different – and neither seems all that “value” – the details are very different.
The top 10 holdings of the S&P 500 value include Microsoft, Amazon, Meta, Salesforce, and Netflix. The average P/E of the top 10 holdings is almost 27 times forward earnings. There is some overlap in the top 10 holdings of the Russell 1000 value: Berkshire Hathaway, Meta, Walmart, Cisco, and Bank of America but the average P/E is 14.7.
There are big differences in the growth versions of these two indexes too but in this case, it is the Russell 1000 growth that has far outperformed, 27.6% to 19.7%. Why? Well, the standard valuation metrics are both rich but the Russell index is richer: P/E of 25.5 vs 21.4, P/S of 3.3 vs 2.9, and P/Cash flow of 16.5 vs 12.8. The portion of each fund in the top 10 holdings is high at 48% (Russell) and 46% (S&P). And the average P/E of the top 10 is similar and very high at 37.1 and 36 (Russell and S&P respectively). The top 10 names are very similar with only one difference.
So where’s the big difference? Well, in a fairly narrow market like this, it doesn’t take much but the main difference is in the sector allocation. They both have large technology allocations but the Russell index has more at 45.1% vs 37.3% in the S&P. But the real big difference is in healthcare and energy, both of which are down on the year. The Russell index has 10.6% in healthcare and 1.2% in energy while the S&P index has 17.2% and 6.5%. That difference in sector allocation produced most of the nearly 8% difference in returns.
The large-cap blend indexes have performed in a very similar manner but the constituent value and growth indexes have not. Investors should not forget that these indexes are constructed by humans following a set of rules. And the rules are, apparently, quite different between the two organizations. In this case, I think the two Russell indexes are more true to their names which is why you get a large difference in returns.
You can’t just read the labels on funds and assume you know what you are getting. You have to do the research to know what you are buying. Caveat emptor.
Environment
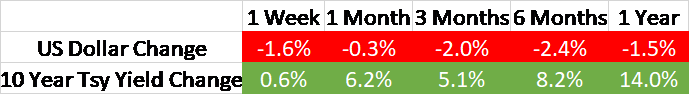
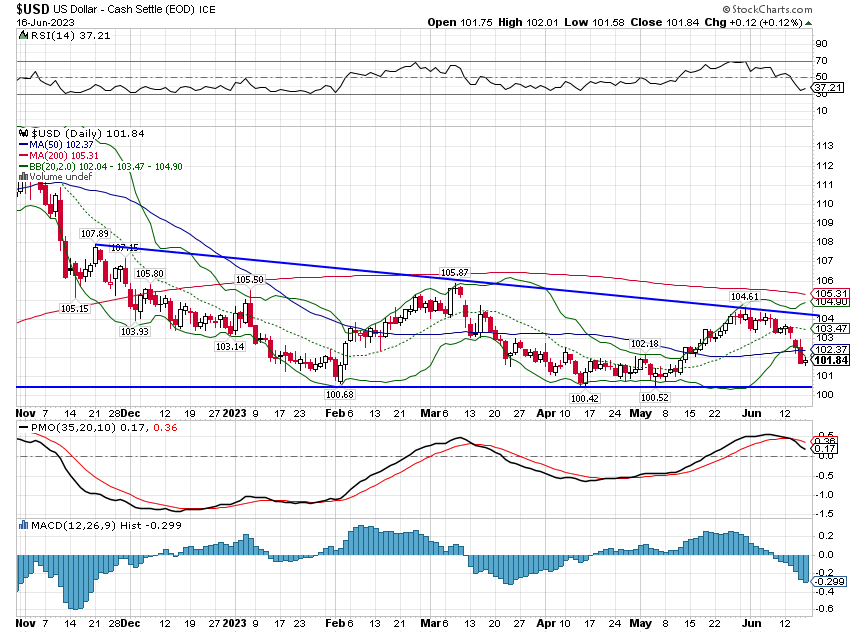
The dollar was down last week, presumably on the Fed pause, but the trend is still neutral over the short term. The rampant dollar bearishness of a couple of months ago has dissipated and positioning is largely neutral. The recent rally took the buck right to my 104 target and it has now turned lower, heading for the low end of the recent down-sloping range. If it breaks out of the bottom of the channel, the next target would be in the mid to upper 90s. Nothing all that exciting but direction is more important than magnitude.
The speculators continue to press their bets against the Yen but BOJ policy is supportive of weakness so there isn’t much pressure to cover. At some point the BOJ will change their tune – annual inflation is down from 4.3% but is still running at 3.5% – and with real incomes falling for 13 consecutive months, it might not be as far off as the betting crowd currently believes. There’s also a decent-sized long on the Euro but it isn’t extreme just yet.
The commodity currencies (A$, C$) might see some more upside. Specs are short (although they’ve been shorter in the past) and the commodity rally of the last couple of weeks moved the currencies off their lows. The commodity indexes are down 20% over the last year so there is plenty of complacency and little expectation of a sustained rally. These aren’t going to move the USD index though; the C$ is only 9% of the index and the A$ isn’t in the index.
Historically, the dollar has had a negative correlation with commodity prices (dollar down, commodities up, and vice versa) but that relationship, like so many others in the post-COVID era, may be changing. Why? The short answer is oil and the fact that the US is now a net exporter. We’re also exporting large volumes of natural gas as well. This may be changing the US terms of trade in a way that makes the dollar more positively correlated with commodity prices. Or maybe it is a short-lived phenomenon distorted by the Russia/Ukraine tiff. Hard to say yet but one should never assume these relationships are permanent. It is a complicated world.
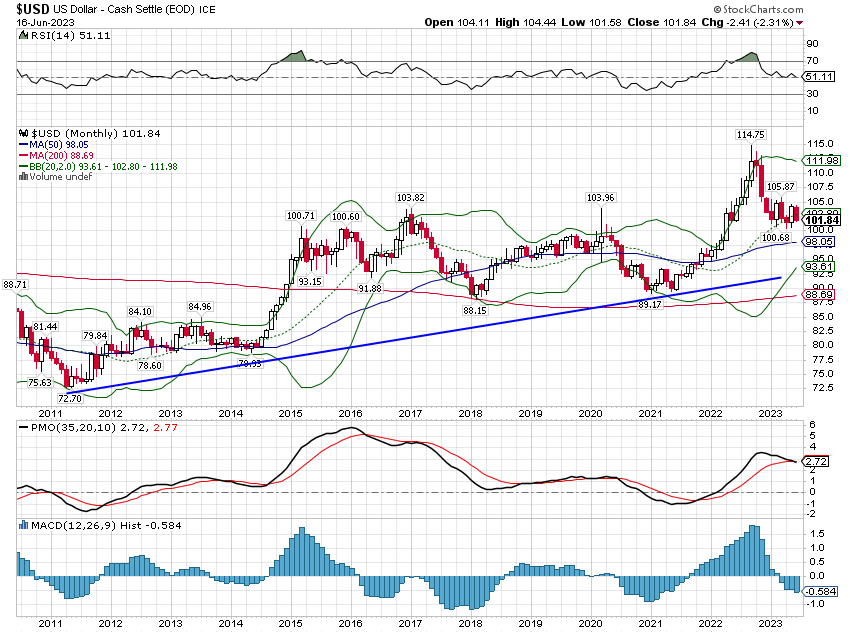
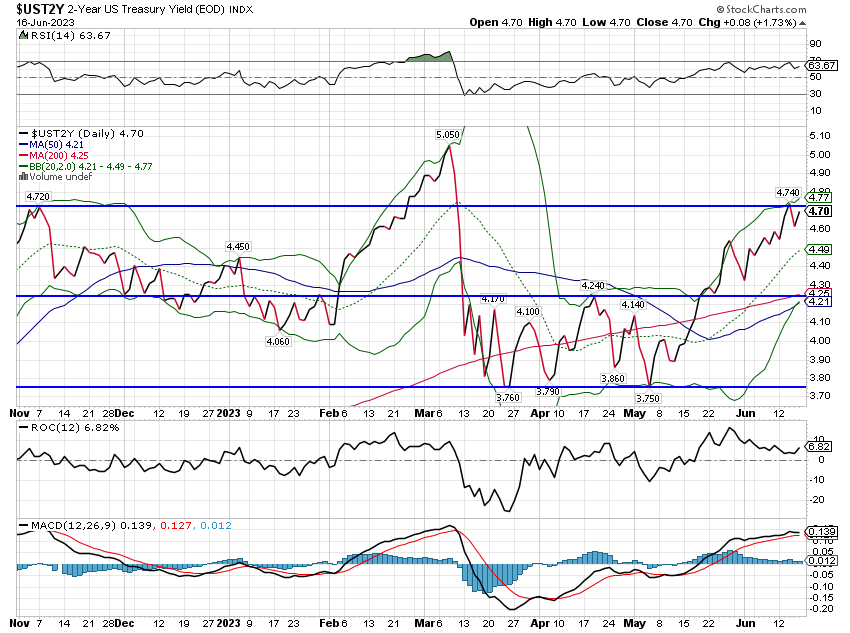
The 10-year Treasury yield trend is also unchanged…still. The FOMC meeting last week produced little change in rates. The 10-year and 2-year yields moved up just modestly while T-bill rates were generally slightly lower. Fed funds futures shifted a little but overall the meeting was a big nothing. I don’t know if the Fed is data-dependent but the market certainly is. The data last week just wasn’t enough to move the market out of its recent range. Inflation continues to moderate and inflation expectations, as released with the University of Michigan consumer sentiment survey, seem to indicate that reality is seeping through to the general public.
I continue to think interest rates have likely peaked for this part of the cycle but my conviction on that is low. And even if the 4.3% we saw on the 10-year Treasury last October proves to the cycle high, a return to or near that level can’t be ruled out. As I point out below in the Market/Economic Indicators section, the goods side of the economy may be making a bottom. If the inventory correction is over and goods consumption resumes its uptrend, rates are probably going higher. But that is speculative on my part so I’ll wait to see which way rates go from here before making any big bets.
Markets
Commodities had a big rally last week and usually, we’d be pointing to crude oil as the catalyst but this rally was much more broad-based. Crude was higher (+2.5%) but it was well down the list of best performers. Natural gas was the leader, up 16.8% for the week but agriculture was also up big on the week. Palladium and copper were higher but platinum lagged while gold and silver were down slightly.
The consensus seems to be that this move in commodities was driven by the talk of more Chinese stimulus but there were lots of reasons for the rally. Natural gas was higher due to the announcement that the Netherlands plans to close the largest natural gas field in Europe later this year. It isn’t official yet because the cabinet still hasn’t voted on it but if it does, it would be a year sooner than previously expected. And if Europe doesn’t get lucky with the weather again this winter, then US LNG is probably going to be in high demand.
Agricultural commodities rose as the drought in the midwest continued and fears about the potential closure of the wheat corridor through the Black Sea also spiked. The destruction of the dam in Ukraine a couple of weeks ago didn’t help either.
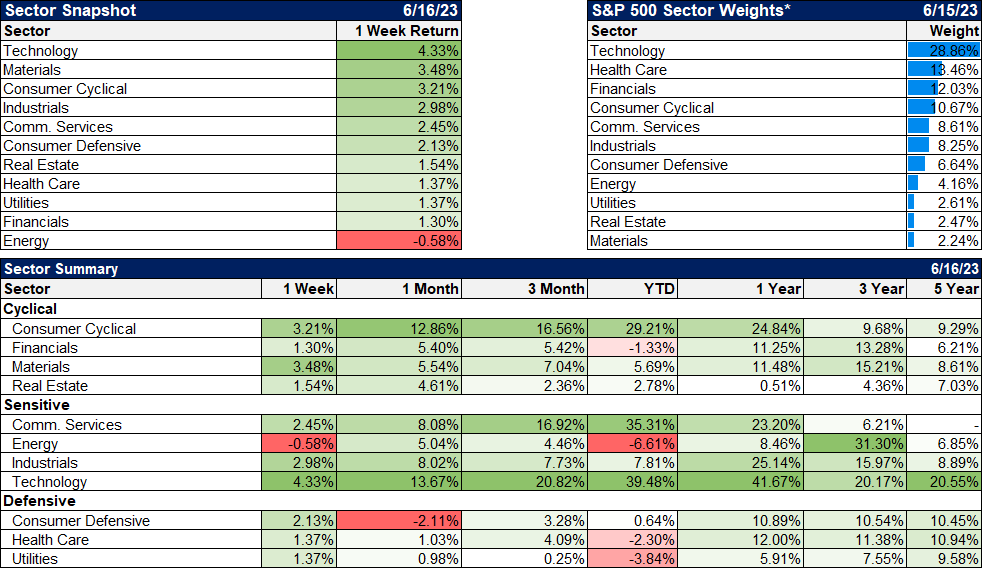
Commodities are still down on the year but the loss is less than 5% and all the other major asset classes we use in our portfolios are higher YTD. In stocks, it is still largely a growth index phenomenon but there are signs the rally is broadening out. 10 of 11 sectors were higher last week and 7 of 11 for the year. Some of the year’s laggards are starting to play catch up too including real estate, materials (which are commodity-related mostly), and industrials.
International markets have also performed well this year but it isn’t mostly a currency effect as it so often is. The Euro is up 2.2% but European stocks (in dollars) are up nearly 15%. The Yen is down 7.5% but Japanese stocks (in dollars) are still up 15% as well. EM currencies are up nearly 6% as a group, which accounts for most of the gains in that index (+7.7%). But the Brazilian Real and the Chilean Peso are up 9.3% and 6.4% respectively, driving the Latin American index up 17.5%.
The rally in large cap this year is starting to look ripe for a correction as sentiment is quite bullish. Of course, it can stay that way longer than seems possible so it doesn’t mean stocks are about to fall out of bed tomorrow but put/call ratios are low, the VIX is at a 3-year low, the AAII poll is majority bulls for the second week in a row (and above the long-term average) and the NAAIM exposure index is at 81. Those can all get more extreme but bears are getting scarce so you might want to check your enthusiasm for now. A 5-10% correction right now would not be surprising at all.
For diversified investors, the year-to-date may seem a little frustrating because a multi-asset class portfolio isn’t keeping up with one that is heavily weighted to growth stocks. A diversified portfolio never keeps up with its best-performing asset. But it also doesn’t keep up with its worst-performing asset and that is the point. That’s the trade-off we make as diversified investors and it is often forgotten at times like this. The temptation to abandon your risk profile and chase performance is strong. Before you do, remember how you felt in July and October of last year when stocks were hitting their lows. And try to think about how you would have felt if you had all or most of your money in growth stocks last year.
10 of the 11 economic sectors were higher last week. The rally has broadened somewhat over the last couple of weeks but it is still concentrated in technology which led on a sector basis again last week. Materials had a particularly good week as many of those stocks are commodity related. Cyclicals and industrials also performed well as investors seem to be warming to the idea that recession isn’t on the 2023 dance card. Maybe, maybe not but I wouldn’t put much faith in short-term stock performance as a forward-looking indicator.
Market/Economic Indicators
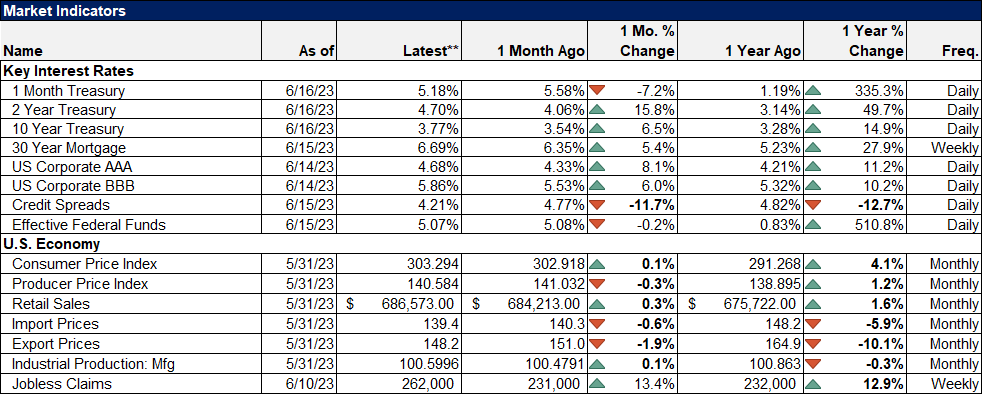
Credit spreads continue to tighten, now by nearly 13% over the last year. Yes, we will have a recession eventually but it won’t come with tightening credit spreads.
Inflation continues to moderate and the widespread expectation is that it will continue to do so. There are good reasons to believe that and I think it is likely as well. But we should never assume we know anything about the future. NGDP growth (inflation + real growth) is not going to come down easily with all the “excess” cash sloshing around. On that note, we may be starting to see some early indications that goods production is bottoming out. Industrial production was down for the month and 4 of the last 8 months (with another at zero). But manufacturing production was up for the 4th time in the last 5 months. Business inventories were up for the first time this year as well.
The Empire State and Philly Fed surveys also showed some improvement. The NY Fed survey has been positive for 2 of the last 3 months. The Philly version headline was down but the internals were generally better with Business Conditions, Employment, and CAPEX all improving. There were some negatives too with prices paid up and new orders down so it isn’t clear sailing but nice to see some improvement.
The point is that if the goods economy picks up again, inflation may not come down as quickly as everyone – including me – is expecting. It’s okay to analyze and have an opinion about the future but never assume you are going to be right. The market and the economy have a way of smacking down anyone who dares to think they have things figured out.
Jobless claims have been ticking higher in recent weeks but claims are not generally a very good leading indicator. They are up about 20% year-over-year but we’ve seen many similar moves in the past that were not recessionary. We’ve also seen recessions start with almost no rise in claims (1970 and 1973). The level doesn’t tell you much either. Yes, claims have risen prior to the last few recessions but there is no correlation between the level of claims and recession. It would probably be wise to consider too that the jobs market is quite a bit different today than it was even a few years ago. That happens when you have a pandemic.
Stay In Touch