
The stock market was down a little over 2% last week in what may be the start of a larger correction. Or not. Technically it is easy to make a case for a little more downside to the 50-day moving average, a total pullback of about 5%, and then a resumption of the uptrend. That’s what happens in bull markets. You get normal down movements, pullbacks, that are less than 10% with the 50-day moving average usually acting as a lower boundary. Those happen every few months in a bull market. You get corrections – over 10% but less than 20% – every 12 to 18 months and those are usually bounded by the 200-day moving average.
So, if this is a bull market, a pullback would stop at the 50-day MA, just a few percent below Friday’s close. It could still be a bull market and correct down to the 200-day MA, which would put the total correction at about 11%. The other possibility is that this is the beginning of a bear market, one that takes the market down more than 20% as it did in 2022. But for that, I think we’d need a change in current economic expectations which right now call for a benign environment with no Fed rate changes until early next year.
With long-term interest rates rising, it seems unlikely that we are on the verge of recession and so I don’t think many people have that on their radar. Since the 90s we have become accustomed to long-term rates peaking and declining prior to the onset of recession. The yield curve steepens prior to recession too as short-term rates fall faster than long-term rates but both are falling. Markets are said to be anticipating recession and Fed rate cuts. But that isn’t the way it has always been.
In the 1970 recession, rates rose right until the onset of recession and hit a new high for that cycle during the recession. In the 1973/74 recession, the 10-year yield did peak about 4 months before the start of the recession. But rates resumed rising at the start of recession and didn’t peak until after the recession ended. Rates were also still rising at the start of the 1980 and 1981 recessions. What were those bond markets anticipating? Not recession, that’s for sure. The yield curve wasn’t any help either. In all of those cases, the yield curve was still inverted at the beginning of recession; the steepening of the curve came during recessions.
I don’t know how this cycle will end, if bonds will give us a warning about recession. That will depend on how growth and inflation expectations evolve in the coming months. Right now, the economic outlook is pretty rosy, with growth expectations rising and inflation expectations – at least in survey form – falling. Better growth and lower inflation is pretty obviously good for stocks.
It is also good for bonds if lower inflation is really what we get. If not, the growth narrative will eventually fall apart too because rates will be seen as going higher still and eventually causing a recession. As they did in the 70s and early 80s. Ask yourself, is today more like those inflationary 70s and 80s recessions or more like the last 4 recessions when inflation and interest rates were both falling? I know how I answer that question.
Environment
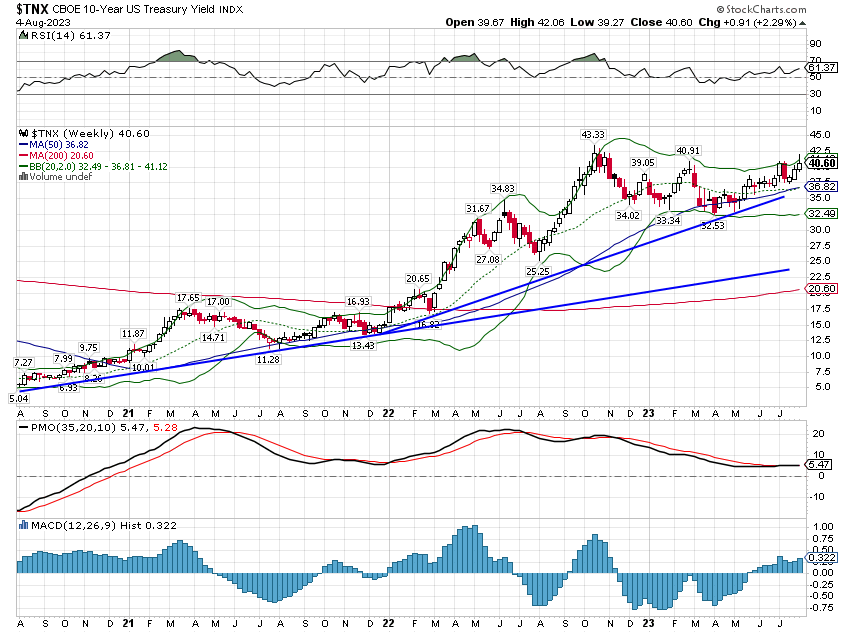
The trend of the 10-year Treasury yield remains up and last week’s high was the highest since late February. Bonds rallied hard on Friday in the wake of the employment report which was viewed as confirming weakness in the labor market. I would dispute that since the 3-month average of monthly payrolls remains firmly above the pre-COVID trend. The labor market, like the rest of the economy, is just trying to normalize – to whatever the new normal in fact becomes.
Regardless of the semantics of the labor market discussion, the trend of the 10-year yield is obvious and probably presents a more accurate view of the economy than any of the economists arguing about it. Rising nominal yields mean that nominal growth expectations are rising. How much of that increase in NGDP expectations is inflation and how much is real growth is what matters for investors. And we can look across markets to see how that rise in NGDP expectations is allocated.
But first, a little foray into bond market lingo. You may have heard or read the phrase “bear steepener” recently. It sounds bad – it has bear in the very name – and I suppose it is if you own long-term bonds. The “steepener” term has been used recently because we’ve seen a steepening of the yield curve and that can be a sign that recession is imminent or nearly so. But the type of steepening we see just prior to recession is known as a bull steepener. What’s the difference?
The difference is nothing more than how the yield curve steepens. If short-term rates fall faster than long-term rates, that steepens the curve and is called a bull steepener. Why? Because bond prices are rising during the steepening; it’s bullish for bonds. And it is generally not a good sign about the economy because it implies the Fed will be cutting interest rates soon and they usually only do that when things are getting worse.
If long-term rates rise faster than short-term rates, that also steepens the curve and is called a bear steepener. Why? Because bond prices are falling during the steepening; it’s bearish for bonds. And that is what we have now. It is an indication that nominal growth expectations are rising but the Fed is not expected to raise rates in response. That could be interpreted positively or negatively I suppose. But the truth is usually in the middle with these things and that is the case here.
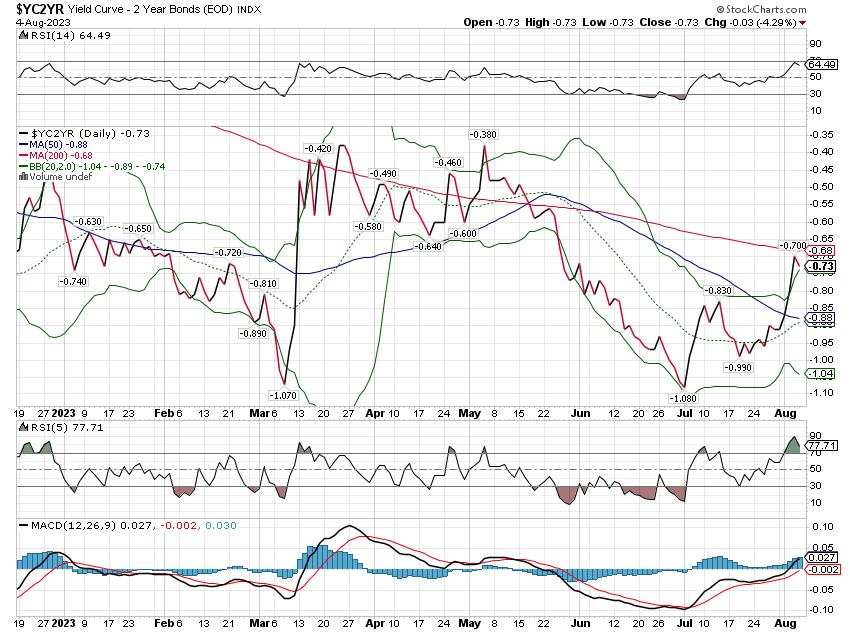
Since the beginning of July, 2-year Treasury yields are down about 9 basis points, while 10-year yields are up 24 basis points.
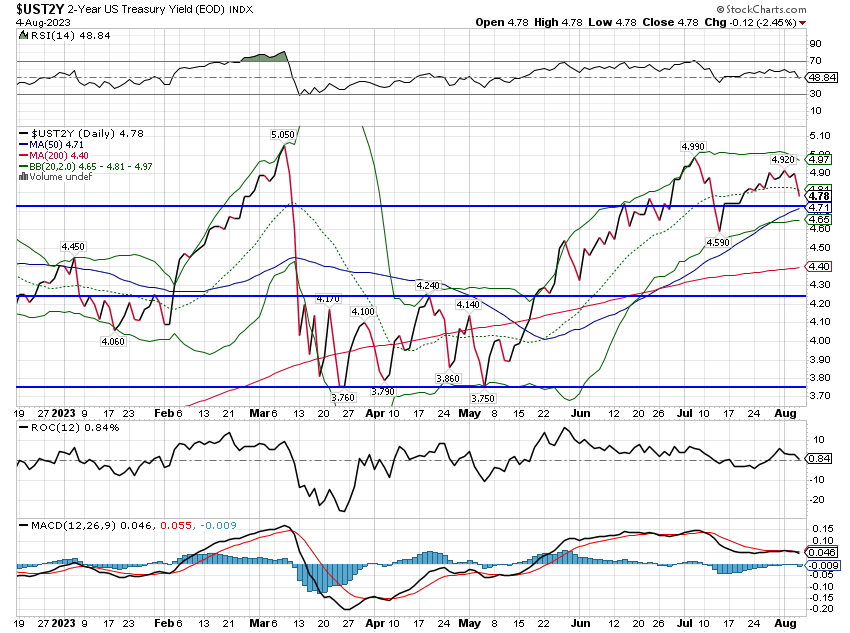
That means the spread between the two has shrunk from -1.06 to -0.73%, i.e. the curve has steepened because long-term rates rose while short-term rates fell. It’s a bear steepener. But what does it mean? That can be determined by looking at the TIPS (inflation-protected bond) market. The 10-year TIPS yield rose along with the nominal 10-year yield but less, about 9 basis points. That means that of the 24 basis points rise in the nominal 10-year yield, 15 basis points was due to higher inflation expectations while 9 basis points was due to higher real growth expectations. More importantly, those are such small movements that it probably isn’t worth your time to figure out what it means. It could all be reversed in a couple of trading sessions.
As I said, a mixed bag but somewhat negative with 10-year inflation breakevens at 2.38%. We’ll get reports on CPI and PPI this week and those seem likely to impact the curve. The surprise here would be a set of hotter-than-expected inflation data.
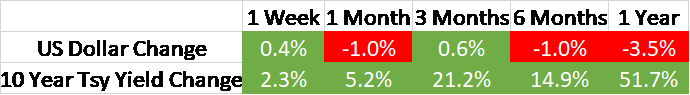
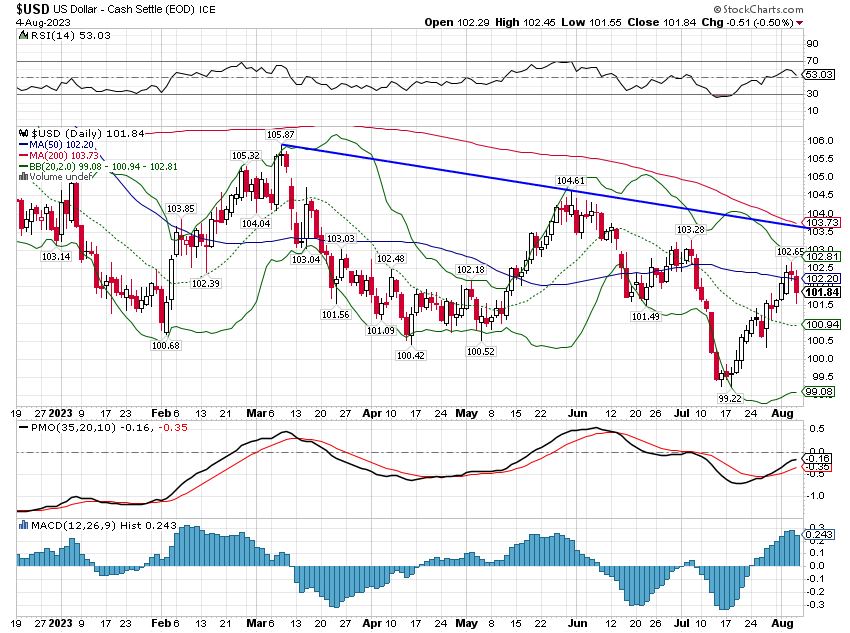
The dollar was up last week but remains in a short-term downtrend. The employment report seemed to confirm to investors/traders that the Fed is on hold and likely to stay that way. I’m not so sure but that is what the market is expecting. Anything that upsets that Goldilocks outlook – a hotter-than-expected inflation report maybe – would have a big impact on markets.
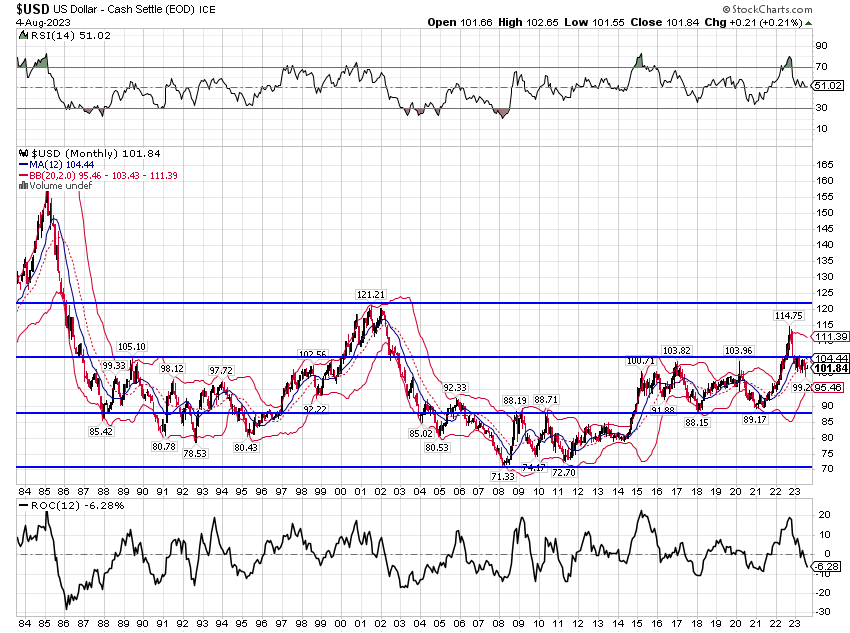
I think it’s important to remember where we’ve come from too. The dollar’s downtrend has stalled lately and that breakdown under the 100 level was short-lived. But the trend is still down. 9 months ago the buck was nearly 115 and today it sits just under 102. That is a downtrend just about any way you slice it. Will it continue? I can’t say for sure but a very strong dollar does cause some problems around the world and has in the past been reversed by the market (2001/2 and last year) or through international agreement (Plaza Accord, 1985).
The environment remains one of rising yields (rising nominal growth expectations) and a falling dollar. History shows that certain types of investments work well under those conditions. The most obvious is international, non-US dollar-denominated investments, particularly stocks and within the stock universe, emerging market stocks. But a falling dollar environment is a big adjustment from the pre-COVID trends so, assuming the dollar continues to weaken, the transition isn’t going to be smooth. Unfortunately, we can’t say for sure whether the dollar downtrend will continue or reverse. All we know are the trends today and what investments worked previously in those conditions. Invest accordingly.
Markets
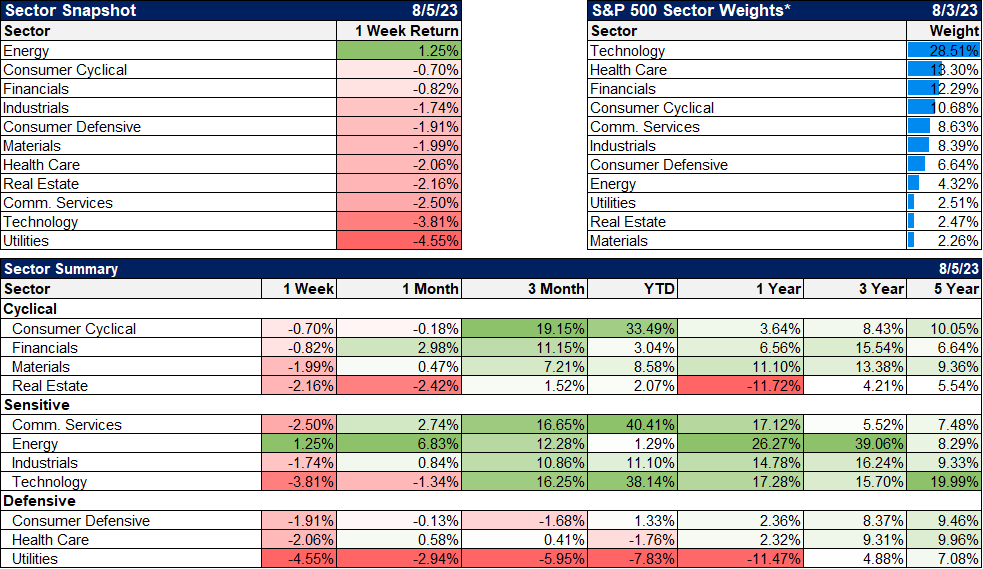
Shorter maturities in the fixed income space managed to squeak out a gain for the week but longer maturities were down (bear steepener). Most everything else was down, with real estate (again) and large-cap stocks (finally) down the most. International markets were down as well as the dollar was in rally mode for most of the week before a good down day Friday after a lot of overseas markets were closed for the week.
Value outperformed last week but that is only because it fell less than growth. Growth still has a large lead so far this year but the year-over-year gap has closed considerably. And value still has a good lead over the last 3 years. What you’re really seeing in those YTD and 1-year numbers is the much greater volatility of the growth stocks. Over the last year, the performance of growth and value are pretty similar but the path of that return was wildly different.
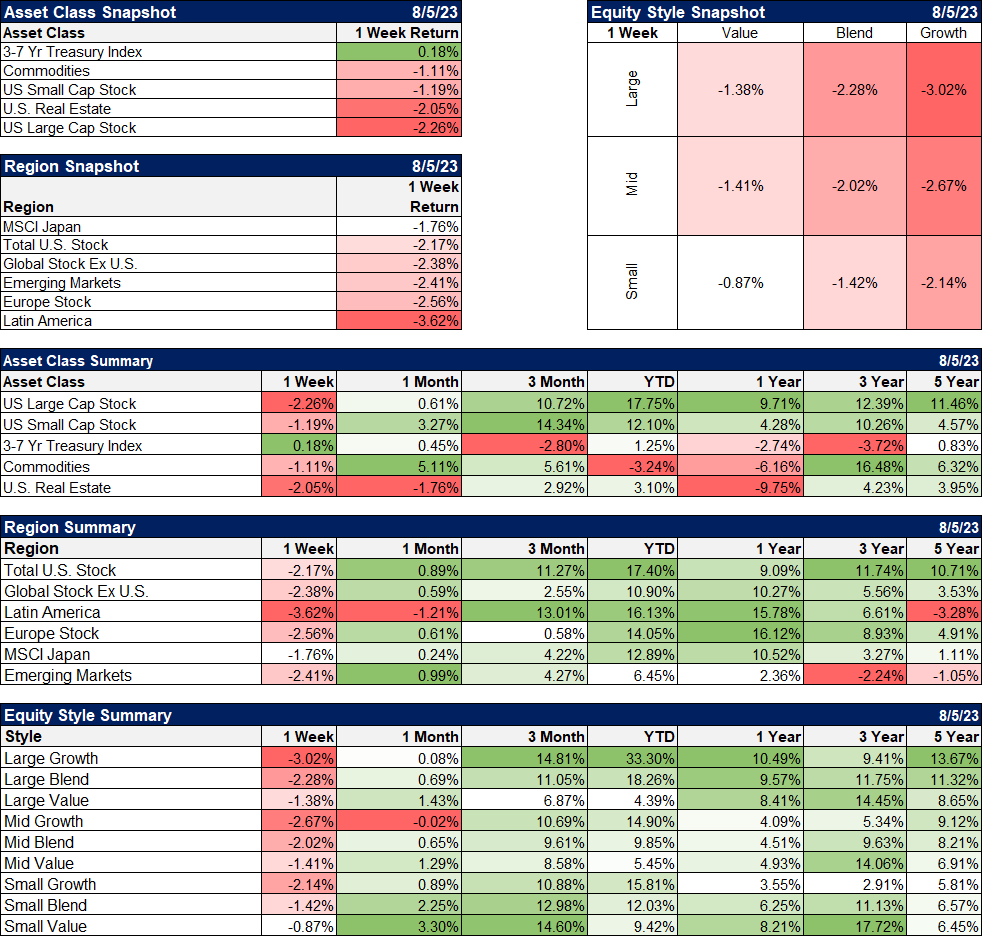
Energy was the only sector that managed a gain last week on the back of a 2.8% gain in crude oil. Crude oil is overbought short term and may be ready for some kind of short-term correction but the longer term trends are turning (or already have turned) bullish. The same is true of the oil stocks as a group. Note: Alhambra and/or its clients are long IEO (iShares US Oil and Gas exploration ETF) and various energy stocks.
Economic/Market Indicators
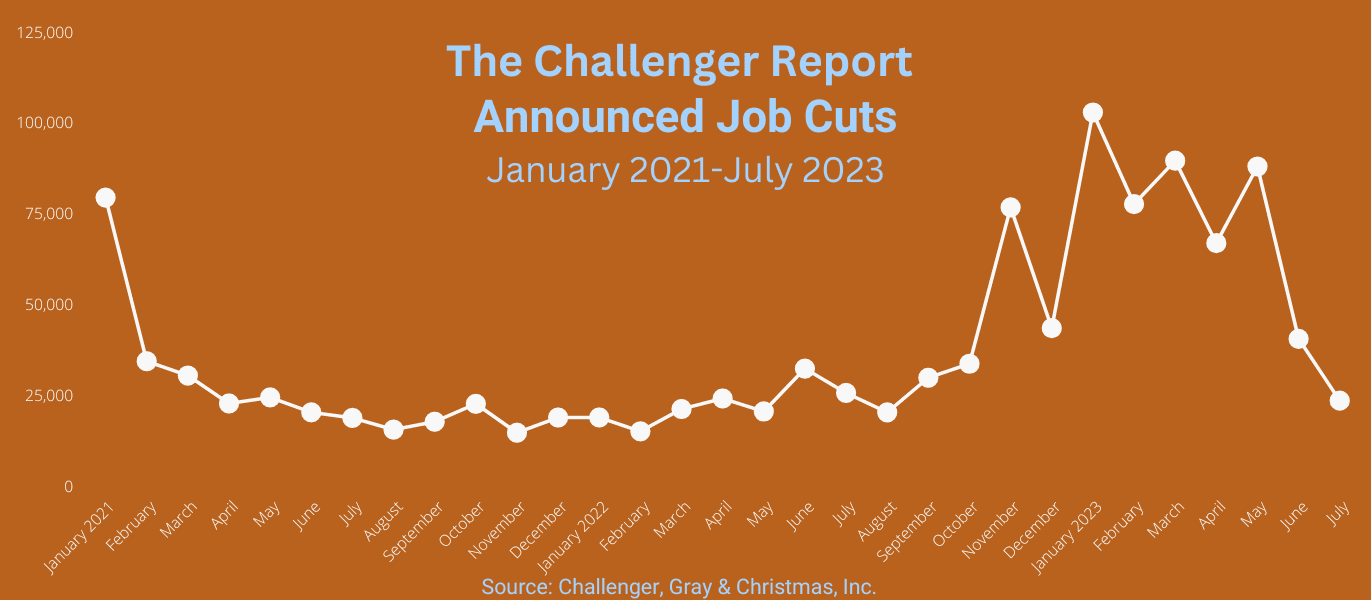
With all the talk of soft landings, the economy doesn’t look to be landing at all. If anything, some of the data seems to be pointing to an acceleration of growth. Whether that comes with lower inflation is yet to be seen but there were some encouraging signs last week in the reports not listed below. Challenger, Gray and Christmas produces a job cuts report based on announced layoffs. It fell to 23.7 thousand in July, the lowest in 11 months.
We also received good news on productivity, up 3.7% in Q2, the best gain since September of 2020 when we were just coming out of the worst of the COVID shutdowns. Higher productivity also showed up as lower unit labor costs, up just 1.6% in Q2. Unit labor costs were up 4.9% in 2022 but are only up 2.4% over the last 4 quarters.
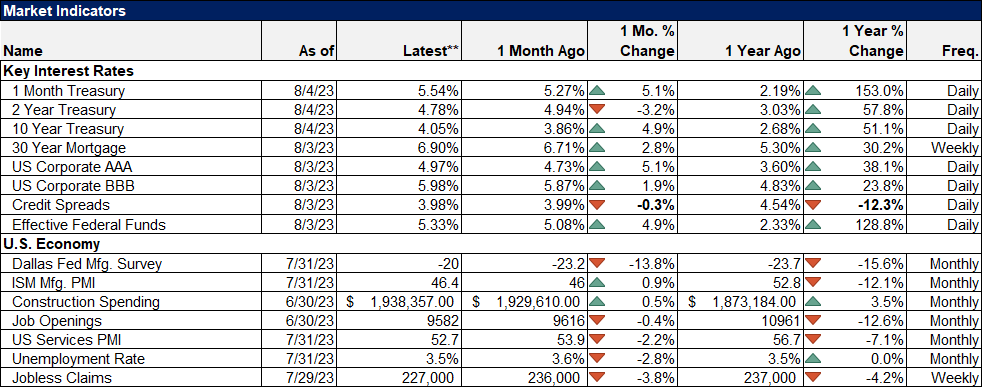
It also seems that manufacturing may be bottoming. The ISM manufacturing survey has stopped falling and new orders are still negative but improving. The last time the new orders index was above 50 (indicating expansion) was in August of 2022 at 51.3. It rose to 47.3 in July, up 3 months in a row and the highest reading since October of last year.
From our market indicators below I will continue to point to credit spreads which are back under 4%. That is below the long-term average of 5.4% and way below the 10% we routinely see in recessions.
Right now the economic outlook seems pretty good and it may be. But we shouldn’t assume that the tools we’ve used for the last 40 years to identify recession in advance are going to work again. This is not the same world we’ve lived in since interest rates and inflation peaked in the early 80s. The key is inflation, whether it moderates or surges anew. History says the latter is more likely but unlikely is this economy’s middle name. In the post-COVID economy, it is best to expect the unexpected.
Joe Calhoun
Stay In Touch