

Stocks are now down from their late July peak by about 5%. It has been a very orderly pullback with most of the major averages shaving off about the same amount. The exceptions are the NASDAQ, which peaked a little earlier than the S&P, and REITs, both down about 7.5%. The NASDAQ is more volatile than the S&P so it isn’t surprising it’s down more. It also isn’t surprising REITs are down more since the pullback was driven by higher interest rates. Small cap and foreign stocks are down a little over 6% which is, again, about what we’d expect from those indexes given a 5% pullback in the S&P 500.
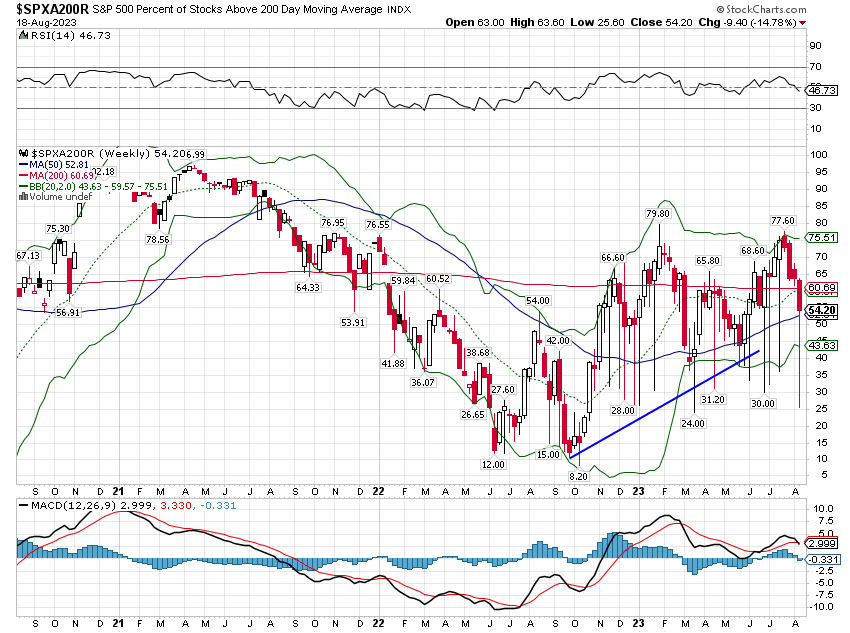
So, is that it? There’s no way to know for sure but sentiment has certainly turned more negative. Put/call ratios have risen with the equity-only ratio rising above 1 last week, a level usually associated with the bottom of corrections. The index level ratio isn’t in overly bearish territory yet but that doesn’t always happen in a short, sharp pullback. The percentage of stocks in the S&P 500 above their 200-day moving average has dropped to 54% which is right around the 50-week moving average for that statistic, a level we’ve visited repeatedly – and held – since the bear market low last October:
This pullback/correction, like the bear market last year, was driven by higher rates, specifically real rates. TIPS yields are now above 2% for the 5-, 7-, and 30-year maturities and very close for the 10- and 20-year. Those levels are the highest since 2009 and are near “normal”. It was the period from mid-2011 to 2022, when the 10-year TIPS yield rarely poked its head above 1%, that was abnormal.
The average real return of the 10-year Treasury note is 1.88% since 1928 and 2.63% since 1973. Real returns were a lot higher in the 80s and 90s but that was during a period when rates and inflation were falling rapidly; that isn’t where we are right now. So a 10-year, inflation-protected bond today gets you very close to the long-term average real return; normal in other words.
I would also point out that the nominal 10-year Treasury note yield is pretty normal at these levels too. The geometric average return since 1973 is 4.34% (as of the end of 2022) and today’s yield is what you’d get for the next 10 years if you bought it today. So, a return of 4.25% over the next 10 years for owning a 10-year Treasury would be just about average for the last 50 years.
Of course, averages often obscure as much as they reveal so I’m not saying the rate rise is over for sure. Average 10-year note nominal returns by decade have varied from 0.83% in the 1950s to 12.6% in the 1980s to 4.35% in the 2010s. The average return over the last 3 years is -3.64% and if we close down this year, it would be the third year in a row, something that has never happened. Expecting rates to keep rising for the rest of the year is arguing for an extreme. It could happen but I’m not sure I’d bet on it.
So, have rates peaked? I don’t have a crystal ball but the market seems to be saying yes. The 10-year nominal yield is still in an uptrend but shorter maturities have stopped rising. The 2-year Treasury note yield has not moved up with the 10-year:
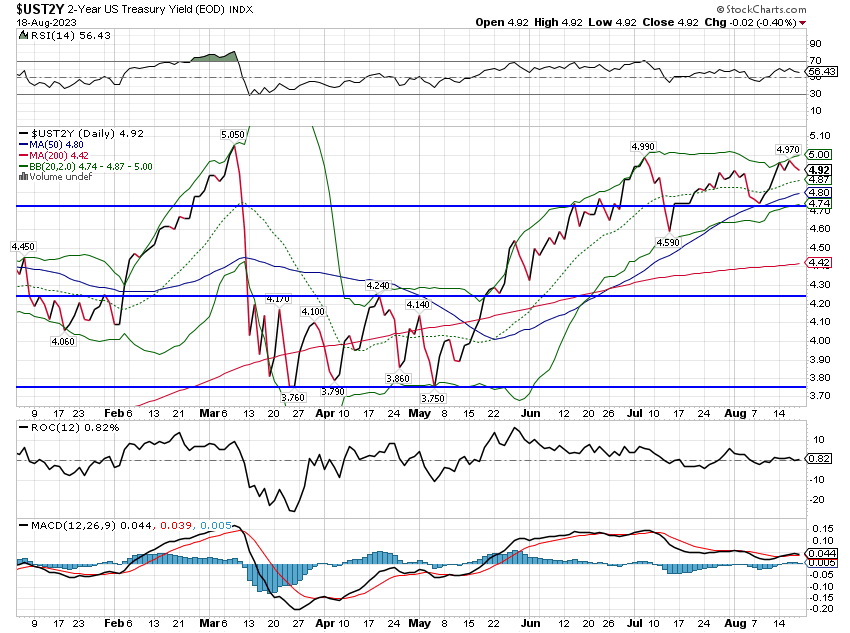
That is an indication that the market believes the Fed’s rate hiking campaign is essentially over. Other markets, such as SOFR (short-term rate that replaced LIBOR) and Fed Funds agree. Expectations for the Fed Funds rate show it essentially unchanged until May of next year. Of course, the market could be wrong – the crowd may have wisdom but it isn’t infallible – so maybe this just means the Fed is behind the curve and will have to hike more. But for now, that is the best guess you are going to get. And if short rates have peaked it is likely that long rates have too.
If that is true, what it means is that earnings are now the key metric for stock prices, not interest rates. And, as detailed below, quarterly earnings are already rising, up 15% since the low in Q2 last year. That is a key difference between this year’s rise in rates and last year’s. Last year, earnings were falling while rates were rising. This year rates have risen but only back to where they were last October while earnings are already higher and expected to rise more. BTW, it probably isn’t a coincidence that the market made its initial low at the end of last year’s second quarter when earnings hit their nadir or that stocks started to rise in October as Q3 operating earnings were being reported 7.4% higher than Q2.
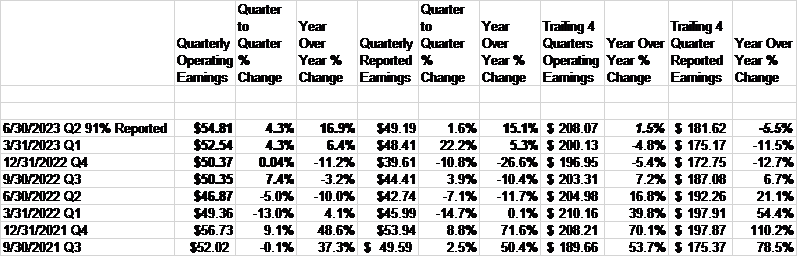
The reporting on earnings this quarter that I’ve seen has all shown a decline in earnings year-over-year. That’s the top line at the far right in the chart above that shows a decline of 5.5%. Think for a moment though about what that decline represents. It is the sum of Q3 ’22 + Q4 ’22 + Q1 ’23 + Q2 ’23 compared to Q3 ’21 + Q4 ’21 + Q1 ’22 + Q2 ’22. The year-ago figure includes earnings from Q3 and Q4 2021, the peak of the post-COVID earnings rebound. Those earnings were produced with near-record profit margins of over 13% (before wages really started to rise). Is it any wonder that earnings have declined from those levels now that margins are more normal (11.8% this quarter)?
If you look at the quarter-by-quarter figures you get a much different picture. Operating earnings hit their low a year ago in Q2 while reported earnings bottomed in Q4. If earnings estimates are right for the next two quarters, the year-over-year change in Q4 reported earnings will be 32%. And, oh by the way, earnings estimates are still rising. If you’re waiting on earnings to bottom out, you already missed it.
I don’t know what interest rates and earnings will do in the future. No one really does. But if rates have peaked and earnings haven’t, what do you think stock prices will do?
Environment
The uptrend of the 10-year Treasury yield continues unabated. Last week it reached up to 4.328%, just a bit below the October peak of 4.333, but fell back on Friday to close at 4.25%. This recent surge in rates is a little extended so you might see a continuation of that pullback, maybe even as low as 4%, but the trend is still up and obvious. This latest move up in rates is not about rising inflation expectations though. Since rates bottomed on April 5th, 10-year TIPS yields have risen by 90 basis points while the 10-year breakeven inflation rate has only risen by 9 basis points. This is about rising real growth expectations and with good reason. The economic data for the first part of the 3rd quarter has been quite good as reflected in the Atlanta Fed’s GDPNow:
I’ve seen a lot of bad takes on this chart over the last few weeks so just to be clear this isn’t a forecast of Q3 GDP by the Atlanta Fed. At this date, most of this “Nowcast” is based on data from only the first month of the quarter. GDPNow is actually most accurate a few weeks after the end of the quarter but before the official release of the GDP figures. By then almost all the data from the quarter has been released and a fairly accurate estimate of GDP can be calculated; this isn’t ever a “forecast” per se. What this does tell us though is that the data from the first part of the quarter has been very strong.
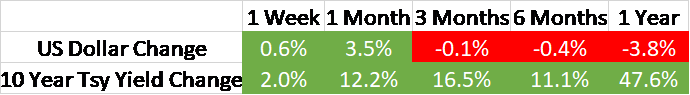
This uptrend in rates is now 3 years long, what we think of as an intermediate-term trend. The short-term trend is also higher as you can see from the matrix above.
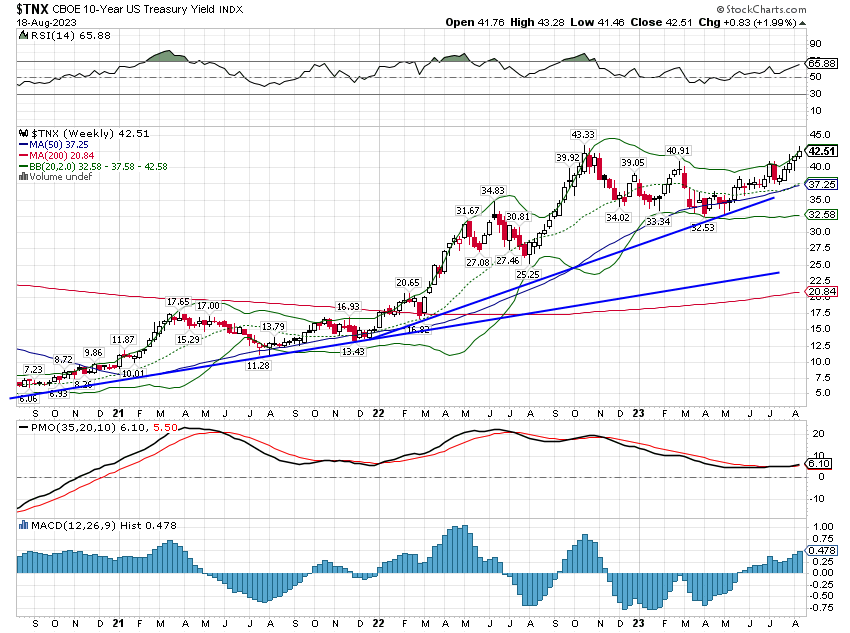
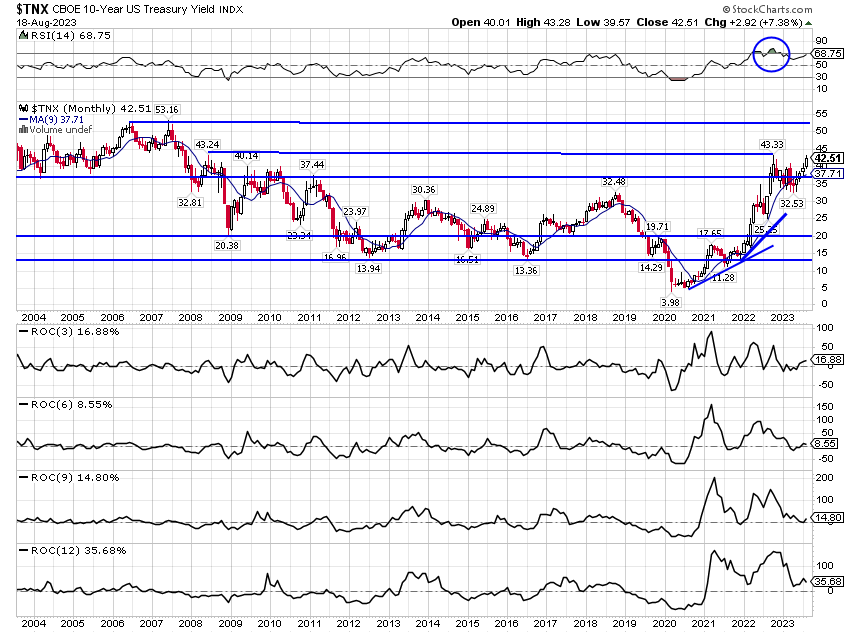
I would call the long-term trend now neutral. Interest rates have been falling since the early 80s but are essentially unchanged over the last 20 years. Today’s rates are only “high” in relation to where they’ve been over the post-2008 period. In fact, today’s rates are just below the average of the 10-year yield since 1928 (4.77%).
The dollar remains fairly trendless, challenging a short-term downtrend line on the daily chart. I guess you can still call this a short-term downtrend but frankly, it doesn’t mean much.
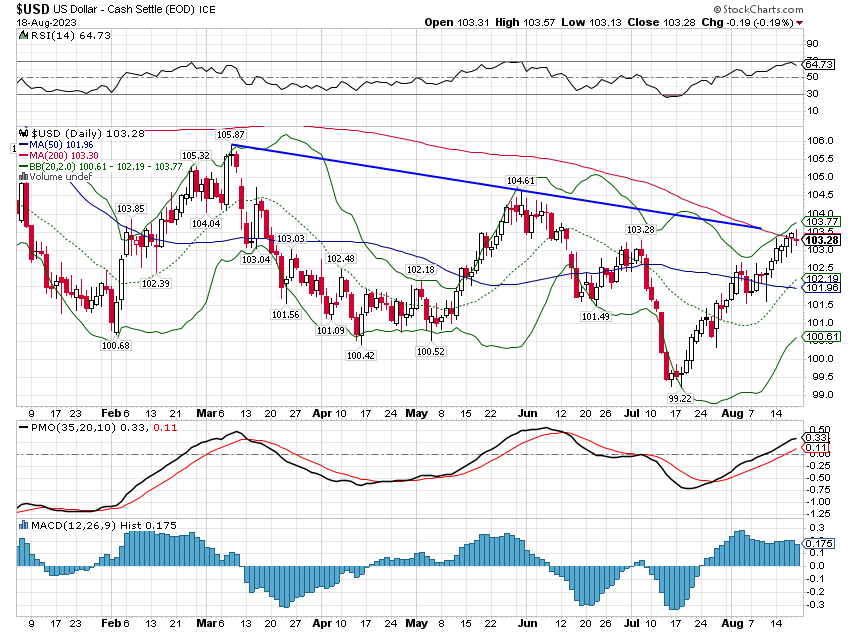
The intermediate-term trend is also neutral, although as I’ve noted before it is still higher than it was at the beginning of 2021. But, as with the short-term lack of trend, there is more noise than signal here.
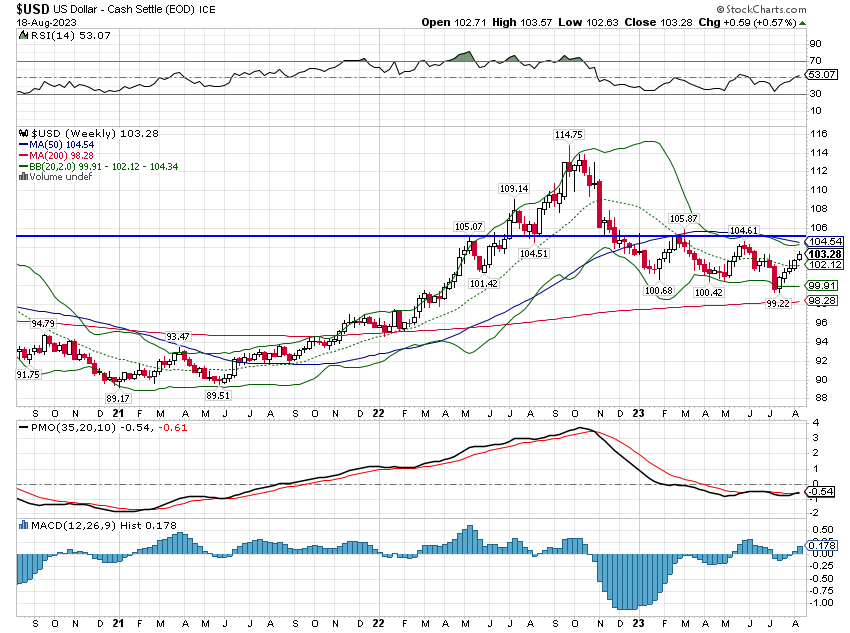
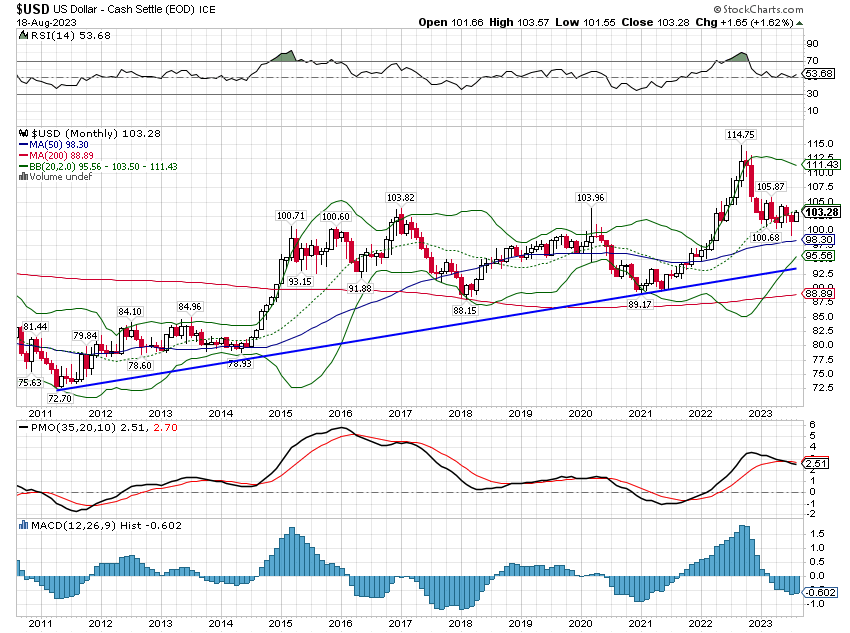
The long-term trend, stretching back to 2011, is up but I still think it is likely the buck will fall back to at least the uptrend line somewhere in the mid-90s. Even that wouldn’t mean much either by the way, but it would be mildly beneficial to non-dollar investments.
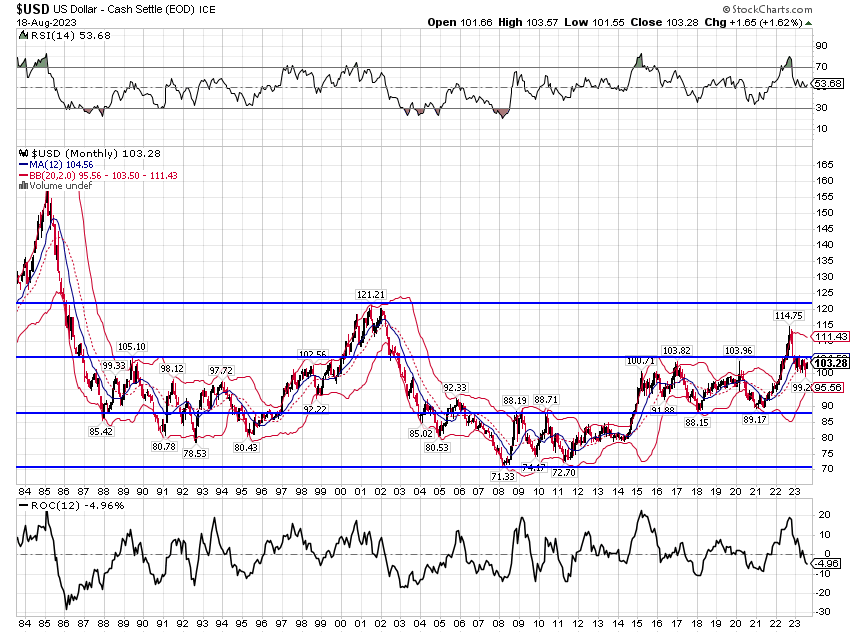
And as I’ve shown before the really long-term trend of the dollar is neutral, although today’s level is at the top of the middle range. A return visit to the bottom of that range seems perfectly reasonable. Something more, that pushes the dollar down into the lower range, is possible but likely isn’t happening any time soon. For now, I think of the dollar as neutral with a downward bias. That means tilting some toward the weak dollar playbook but not too much.
Markets
Last week was down across the board, something we don’t see very often. There’s almost always something going up but over such a short time frame, anything can happen. The markets were driven, as they have been for over a year, by interest rates. Rising real rates means other asset valuations have to adjust and since TIPS yields are just now making 14-year highs, that process isn’t complete. I don’t expect real rates to rise much more though as current levels are, essentially, back to normal finally. If that’s correct, then the critical variable for stocks will start to shift to earnings.
And earnings actually look pretty good. You may have read that earnings in Q2 will be down about 5% and that is accurate if you are talking about trailing 12 months of reported earnings this year versus trailing 12 months of earnings last year. But if you measure Q2 reported earnings this year versus Q2 reported earnings last year, they are up 15%. In addition, Operating earnings Q2 vs Q2 are up 17% and that might be a better measure since unrealized stock losses in Berkshire Hathaway’s earnings reduced reported earnings by $4.74.
And this is always the way it works when earnings are reaccelerating and it’s why a lot of investors miss the turning point. (The same is true of economic data by the way.) This will be the fourth consecutive quarter of rising quarter-to-quarter earnings for the S&P 500. And margins, by the way, are also reaccelerating, to 11.9% this quarter versus 10.9% in Q4 last year. With consumer prices still rising and producer prices falling, that shouldn’t be a surprise to anyone.
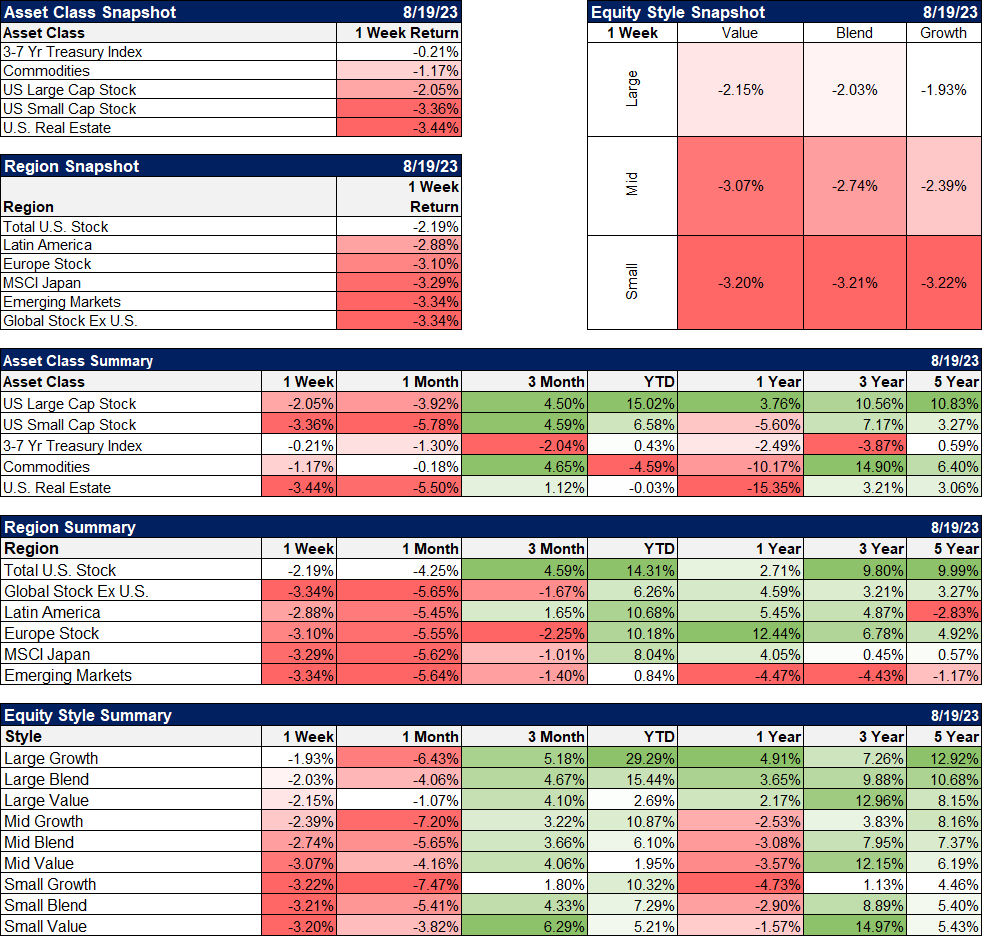
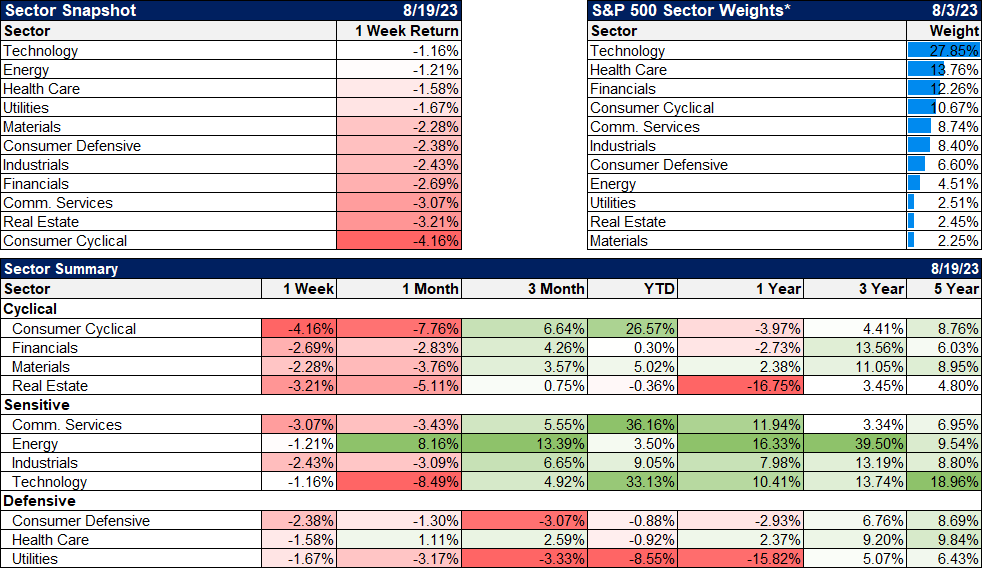
Again, nothing positive from a sector standpoint last week but tech, energy, healthcare, and utilities did outperform. The best-performing sectors YTD are technology, communication services (tech-heavy), and cyclicals. But over the last 1 and 3 years, energy is the clear winner. And those stocks are starting to reaccelerate, up over 13% in the last 3 months.
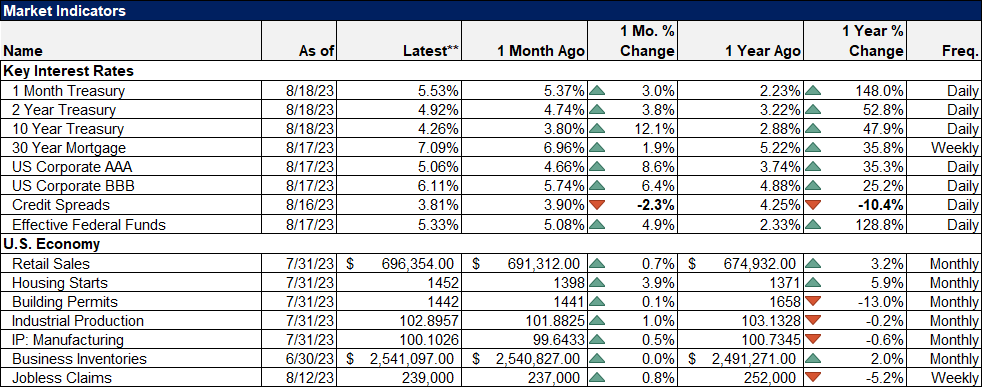
Retail sales, housing starts, and industrial production were all up in their latest reports and better than expected. There is little doubt right now that economic growth accelerated in the first month of Q3. It appears that the goods side of the economy, which has been flatlining over the last year, is reaccelerating; retail sales are up 4 straight months and 5 of the last 7. The year-over-year change is just 3.2% so a lot of that is just inflation. But sales are up 2.2% since March and 3.4% since December of ’22 so we’re starting to see an acceleration in volume now too.
The rise in industrial production may be confirming the improvement in the goods side of the economy. There was a lot of commentary last week that the rise in IP was mostly about utilities and autos, the first just due to hot weather. Why the latter is dismissed I don’t know. But in looking through the report, it is a lot more broad-based than that. Durable goods were up 2.7% month-to-month and a lot of that was automotive products (+4.8%) but home electronics (+1%), appliances, furniture & carpeting (+1.1%) were up while Misc. was down (-0.5%). Non-durables were up 1% but that was mostly about energy (+3.7%), although paper products was also higher (+0.7%).
Business inventories were flat for the second straight month and 4 of the last 6 (and the two that were up were just +0.1%). The inventory correction may be over although we won’t really know until we get full sales figures for July how inventory/sales ratios are. I expect businesses to carry higher inventories relative to sales than prior to COVID – for obvious reasons – and if that is true production needs to start ramping up now.
An accelerating economy and rising earnings sounds like good news because that’s exactly what it is. If long-term interest rates have peaked in the context of better growth and slower inflation that’s good news too. We can’t claim victory on the latter just yet but short-term rates are a pretty good clue. Is that Goldilocks I hear at the door?
Joe Calhoun
Stay In Touch