
There were some very smart people a year ago saying that you couldn’t kill inflation without a big rise in unemployment. Last October, Larry Summers – former Treasury Secretary and President of Harvard – said we’d need a recession and an unemployment rate of 6% to kill inflation. In the summer of last year, he said we’d need 5 years of 5%+ unemployment to kill inflation. He may be right someday but right now this is looking like…well, it’s looking like what I’ve come to expect from people like Larry Summers.
The revision to Q2 GDP last week showed that real GDP rose by 2.1% annualized while the GDP deflator (a measure of inflation) rose 2% annualized. While the GDP deflator isn’t the Fed’s preferred inflation gauge, if I were them I’d declare victory and send a Bronx cheer to Larry Summers. There are lots of economic policies I’d change if I were in charge but it is hard to argue that this isn’t a pretty darn good outcome. And no, I don’t think the Fed had a lot to do with it even if they do, at some point, claim credit.
The bigger question is, of course, whether this little nirvana period can be maintained or improved upon. I can’t say I have much insight on that except to say that I’m not much of a fan of industrial policy or crony capitalism or whatever moniker we’re giving it this week. Government spending is the perfect economic tool for politicians. It looks like economic growth while it’s happening and the day of reckoning is somewhere after the responsible parties have trotted off into the sunset. Well, that used to be true. Today Congress looks a lot like a remake of Weekend at Bernie’s.
I’ve been reading for over a year about how Americans are spending the “excess” savings that was built up during COVID. There’s been another spate of these articles over the last few weeks because the SF Fed put out a paper saying that it is likely to be depleted by the third quarter. But one thing I’m sure of is that Americans will spend given the income and/or savings and time. Last I checked, the amount of cash on the American household balance sheet was still substantially higher than it was pre-COVID. And Americans will continue to spend when this mythical “excess” savings is gone. Remember when we managed to do that prior to COVID? You know, prior to the existence of this made-up metric of “excess” savings?
Personal consumption rose in July by 0.8%, outstripping the gain in personal income (+0.2%) and well in excess of inflation (+0.2%). This time it was goods spending that drove the gain with real PCE of goods up 0.9% and real PCE of services up 0.4%. I’ve been writing about the normalization of the economy, and more specifically consumption, for over a year now. The COVID period first saw a surge in goods spending which then moderated and stagnated for a year while services spending caught up. Now, services growth is falling back and goods spending is picking up again. This is the seismograph economy and the oscillations around “normal” apparently aren’t done yet.
To be even more specific, it is the growth of durable goods spending that is driving the gains. That certainly isn’t what the narrative has been – “experiences over things” – but that’s what the numbers say. Durable goods are up 5.8% over the last year while non-durables are up just 0.9% and services 2.0%. Amazing what you can find out if you just look rather than assume. 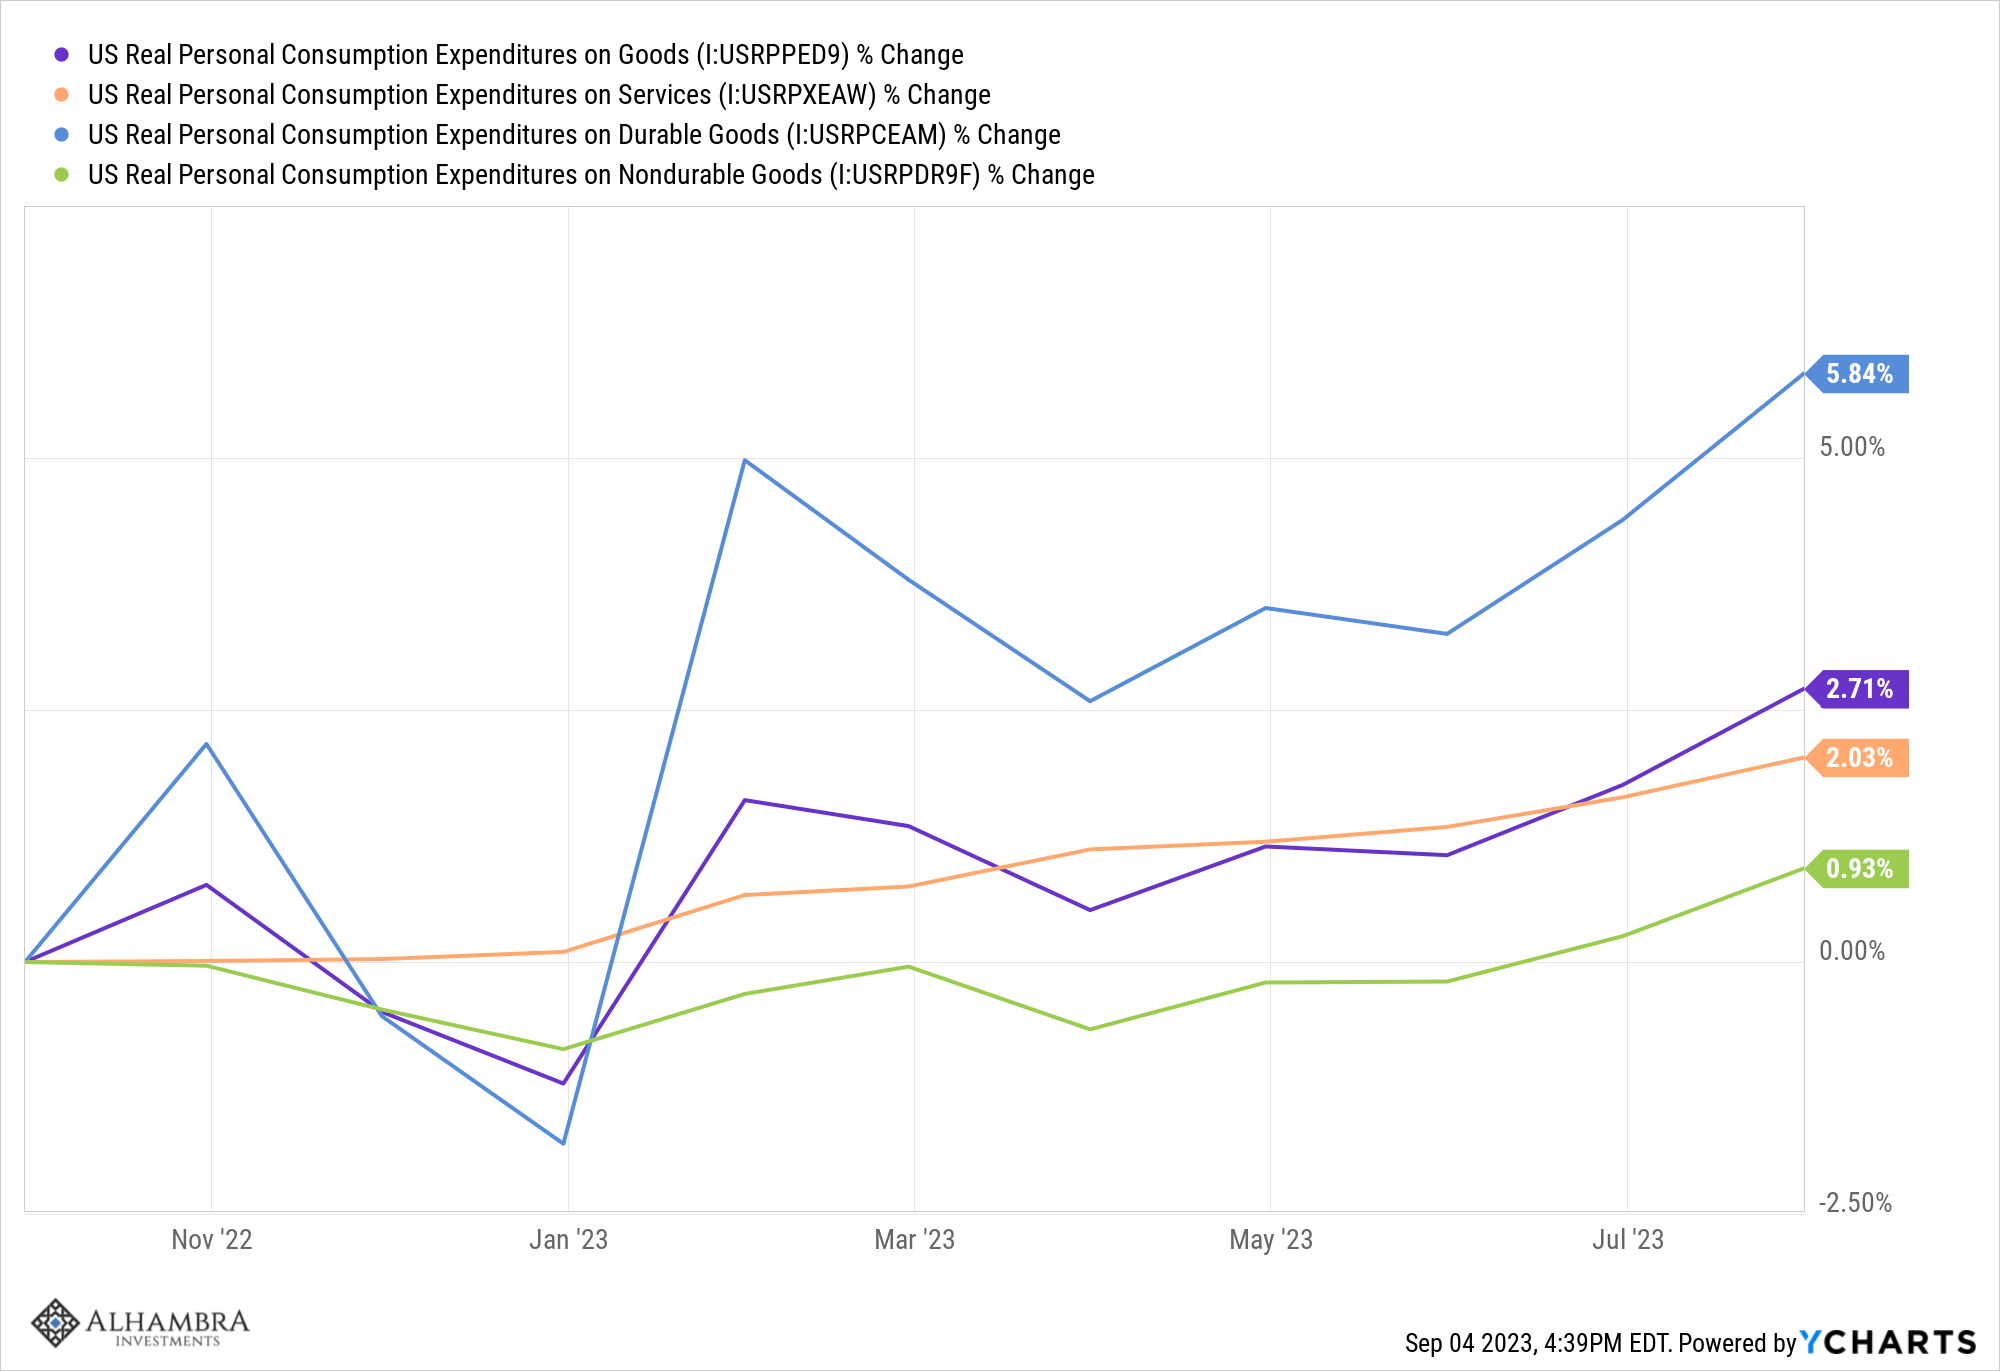
Of course, consumption isn’t the root of economic growth but rather the consequence of it. The production side of the economy is still struggling some as the COVID inventory shock is still being worked off. But if this rate of growth continues, production will have to pick up at some point. We may be starting to see the early signs of that in the PMI and regional Fed surveys. The Dallas Fed manufacturing survey reported an improvement last week while we’ve also seen better readings recently out of the KC Fed, the Richmond Fed, and the Philly Fed. The ISM manufacturing survey also improved along with the Chicago PMI. Most of these readings are still in contraction but improved from their worst levels. And it is usually rate of change that matters for economic growth and therefore stocks and other risk assets.
The economy has defied the naysayers for over a year now and it looks like, for now, it will continue to do so. We will get a recession at some point but there is nothing currently that points to an imminent contraction. With growth at trend and inflation back down to 2%, there is good reason to be optimistic right now. The emphasis should be on “now” though because things can change quickly. The old rules, like the inverted yield curve, may seem like they’ve failed but I suspect it is only the timeline that has changed.
Environment
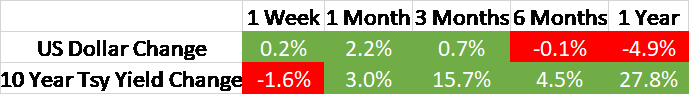
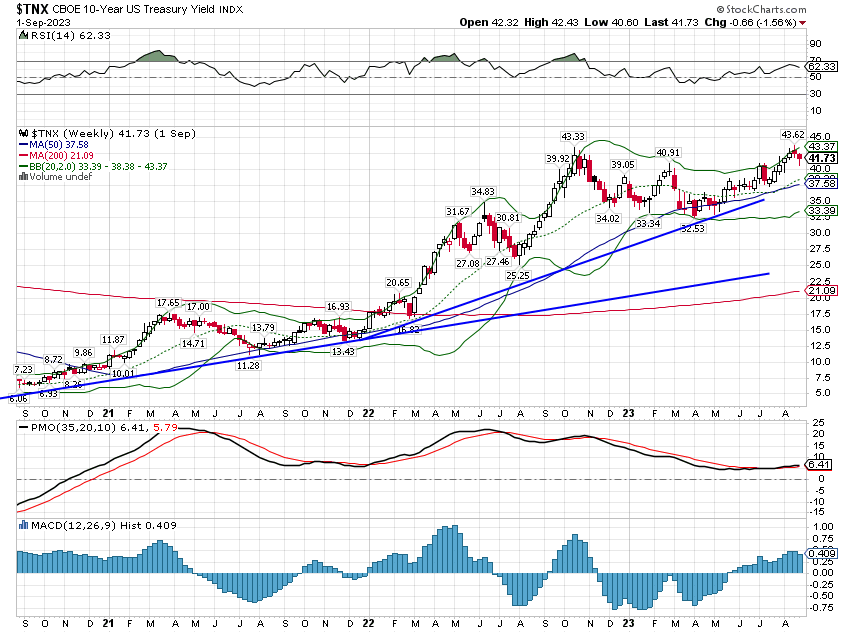
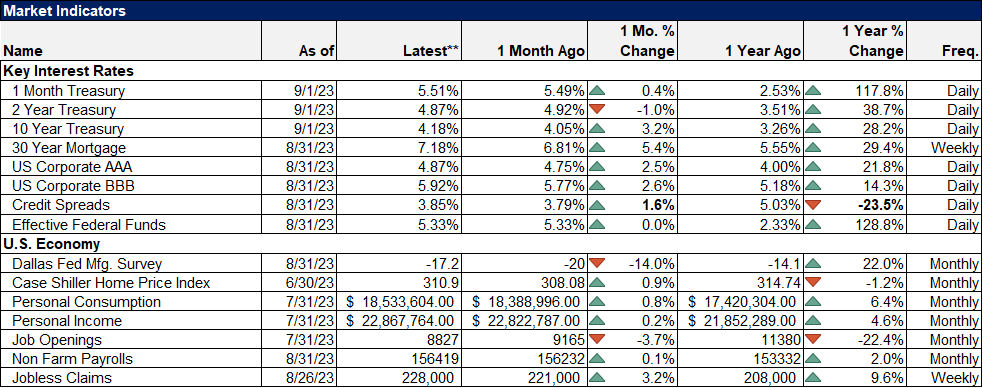
The trend for the 10-year Treasury note yield remains up but I think it is important to note that the yield today is no higher than it was last October. That’s almost a year of rates going nowhere so while there’s been a lot of talk about the Fed being on hold, the market is already there, on hold for nearly a year.
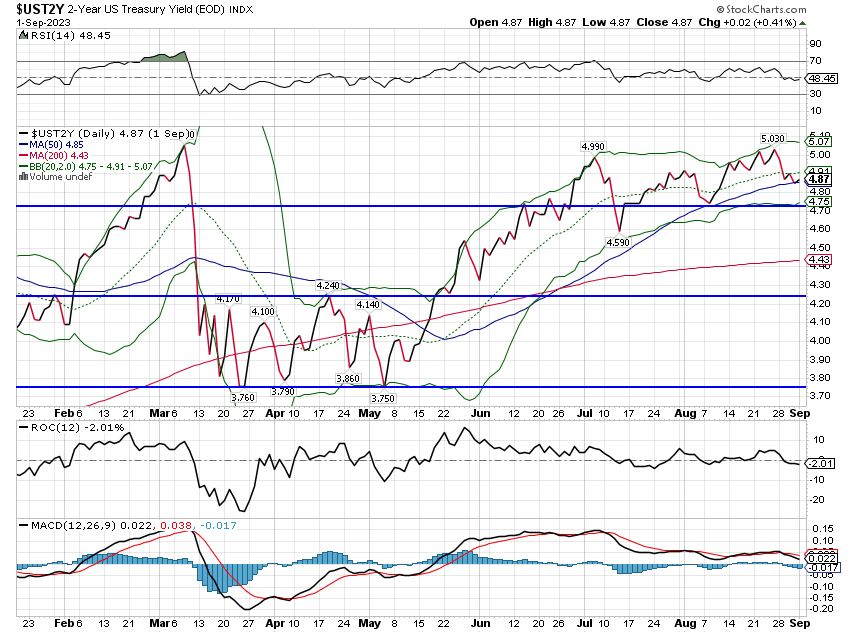
The 2-year note yield trend is also up but less pronounced than the 10-year. It is no higher today than it was in March so it hasn’t been on hold as long as the 10-year but that is still nearly 6 months of sideways action. Bond investors, short and long term, have been collecting coupons for nearly a year with no price change. At current yields that isn’t bad for a nearly risk-free asset.
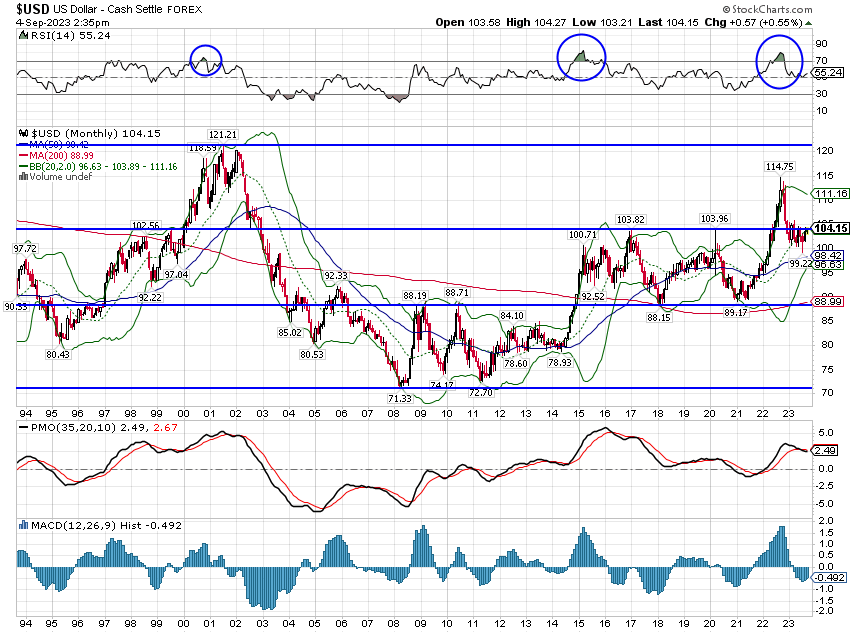
The dollar was essentially unchanged last week and like the 10-year yield, is essentially unchanged for nearly a year. Even more interesting, to me at least, is that, outside that move up to nearly 115, which I would argue was driven by the Russia/Ukraine war, the buck is unchanged since May of 2022. And if you look back further, the dollar’s change since its 2017 peak is negligible. There are smaller cycles within that time, from a low around 88-90 to a high of 100-104, but the fact is that with all that is going on in the world, the dollar has been pretty stable. I continue to believe that it will ultimately revisit the low end of that range again but the timing is impossible to know in advance. For now, the dollar is still in a long-term uptrend since 2011 and a neutral trend on an intermediate and short-term basis.
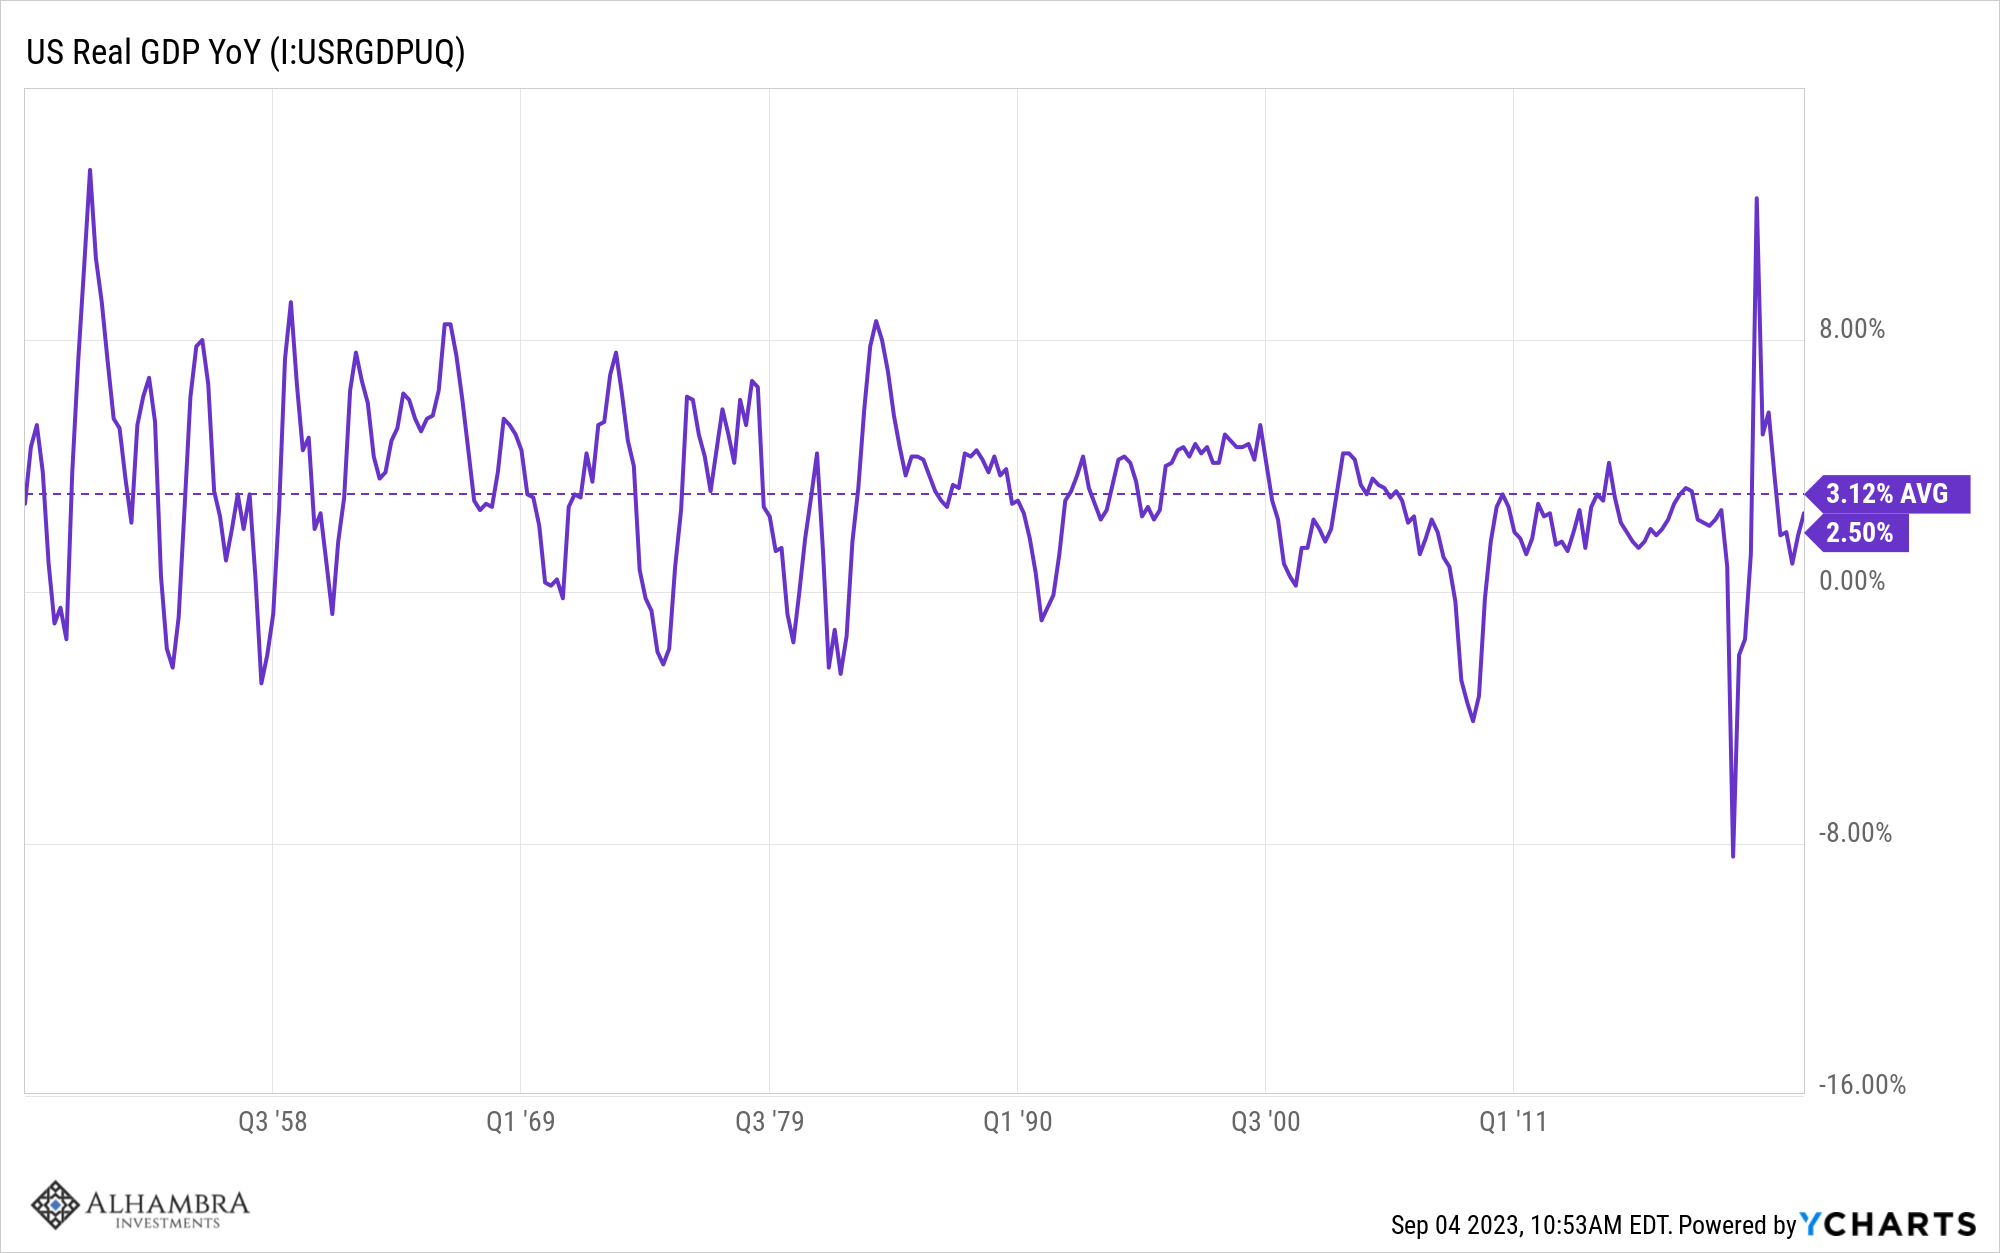
From an economic standpoint, I think these trends reflect the underlying truth about the US economy, namely that it is growing at trend and outside of the COVID period, has been for quite a while. Whether that is good, bad, acceptable, or unacceptable is probably a political conclusion rather than an economic one. I would just point out that the average year-over-year change in real GDP since 1990 is 2.4% and as of last quarter we’re at 2.5%. You can go back further but for the entire post-WWII period the average is just 3.1%. And that includes the immediate aftermath of WWII when we were about the last economy standing. Real US GDP expanded by over 4% per year from 1948 to 1969. With population growth today a fraction of 1%, we’re almost entirely dependent on productivity growth so I’d say this is about as good as you’re going to get from a GDP standpoint.
Markets
We had a number of weeks during August where everything was down and in the first week of September we got the opposite. Everything was up last week with US Small Cap stocks leading the domestic issues and Japan leading internationally. Actually, China performed even better than Japan but we don’t generally track China separately, only as part of EM which was dragged down last week by Latin America.
Stocks are still below their July highs but with sentiment moderated since then and interest rates off the boil, we may well see those again soon. Earnings have been quite a bit better than expected and estimates for 3rd and 4th quarters are rising. If S&P 500 earnings come in as expected for the second half (a big if, I suppose), full-year operating earnings would be up about 12% for the year and reported earnings by 16%. Yes, the index is expensive but double-digit earnings growth in large company stocks usually is.
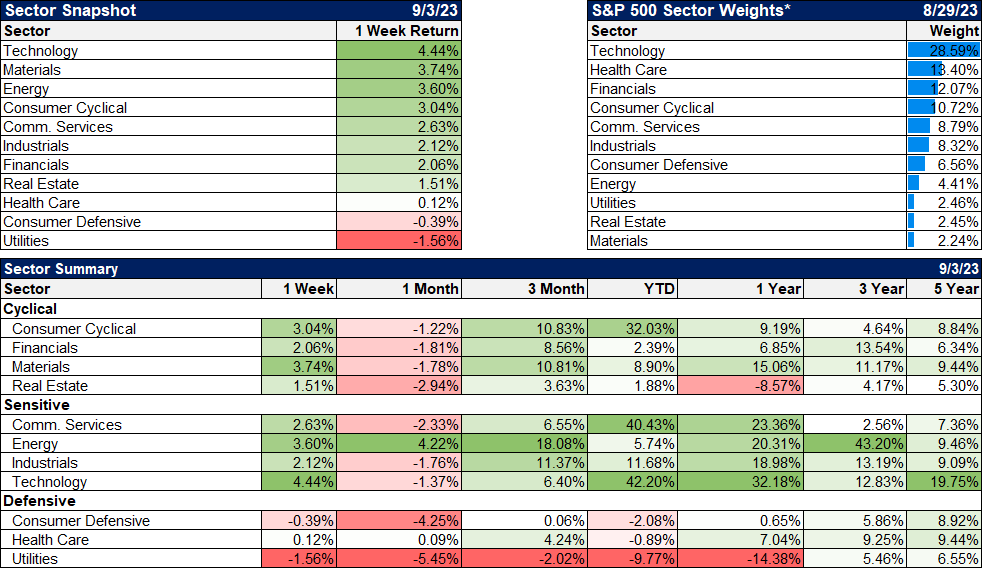
The more interesting – and under the radar – development may be in commodities. They have underperformed the S&P 500 this year but have outperformed over the last 3 months and especially since the beginning of July when crude oil started to rally. I don’t think a lot of people are aware of it but commodities have actually outperformed stocks over the last three years by a wide margin. They spiked after the Russian invasion of Ukraine but that wasn’t sustainable so they’ve spent the last year digesting those gains. And now it appears the bull market in commodities may be resuming. Crude oil was up 7% last week and natural gas tacked on 4%. Copper and platinum were also higher and so was much of the ag complex.
Growth outperformed last week by a small margin but as I keep saying, value is still winning over the last 3 years. That may not last if the dollar stays well bid but so far the buck is just back up to the top of its recent trading range. A break higher, over 105, would probably flip the script and put the dollar in bull mode. If that happens, growth stocks will likely continue to outperform. A compromise position right now would be large-cap value and small or midcap blend (which is what we’re doing). Mid-cap growth and large-cap growth both have expectations of 12% long-term earnings growth but mid-cap is 16 times earnings while large-cap is 23. Seems like a simple choice to me.
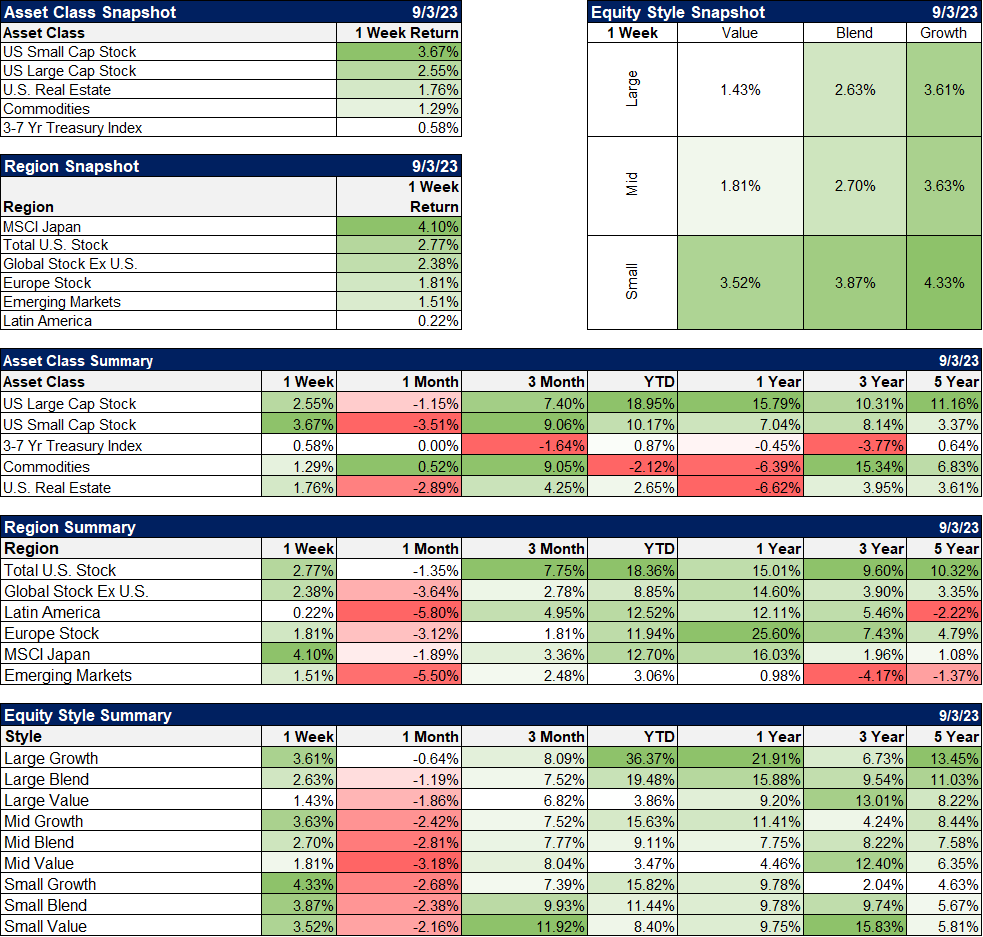
Technology surged to the forefront again last week but materials and energy, both commodity-related, were in 2nd and 3rd place. Defensive stocks brought up the rear.
There are still no signs of recession in the data or the markets. Credit spreads remain tight although slightly off the lows. Interest rates, as noted above, have stalled for most of the last year but are still in uptrends. The data last week was generally positive for growth and inflation. The jobs market has cooled but it certainly isn’t falling apart.
BTW, in the GDP revision released last week, we also got Gross Domestic Income. Last quarter the economic pessimists were touting this measures’ decline as evidence that the economy was more in line with their views. This quarter it was positive (+0.5%) but the pessimists continue to insist that it is the better measure of the economy. Ultimately the two measures should be equal but that is rarely the case on a quarter-to-quarter basis. Here’s a chart of GDI – GDP:
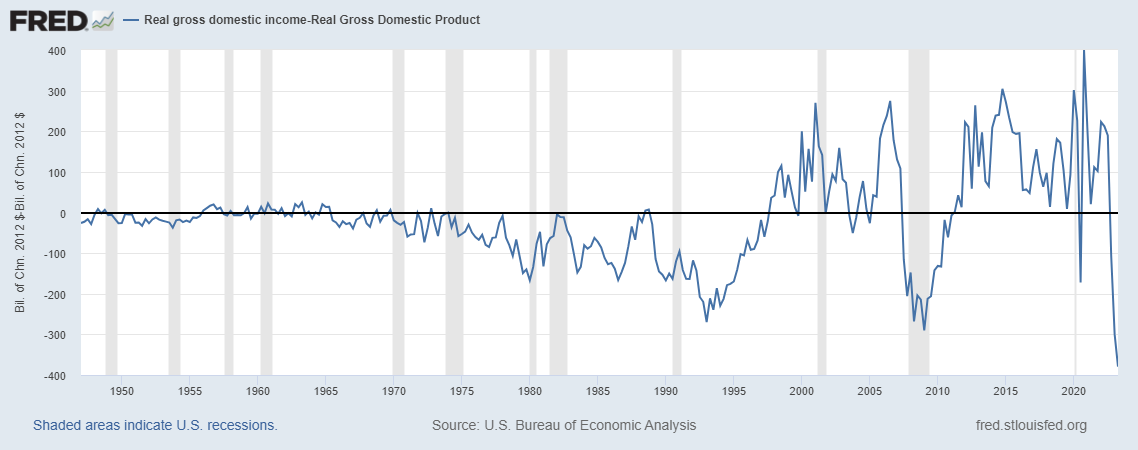
The economic bears point to the drop in 2008 as evidence that this is bad news but, as you can see, we’ve had recessions start before when GDI was larger than GDP and rising too. It doesn’t really mean all that much and deciphering the source of the difference is difficult, to say the least. I looked into this briefly and found that there has been a large drop in “net interest and miscellaneous payments on assets”. What is that? Well, for one thing, it includes “Interest payments on mortgage and home improvement loans and on home equity loans” which “are included in interest paid by private enterprises because home ownership is treated as a business in the NIPAs.” Gee, I wonder why interest payments on mortgages have dropped so much since 2020. Does that sound like something bad to you?
I wouldn’t ignore the differences here but you can’t just say there’s a problem because there is a difference. It matters why there’s a difference. And by the way, even the government can’t reconcile all the differences. The last line of the table for GDI is: “Statistical discrepancy”. Last quarter that number was $498.4 billion which seems big enough to qualify as something other than a mere discrepancy.
The stock and bond markets have been telling us for all of this year that the economy is fine. The peak rate of change in the CPI was 14 months ago in June of 2022. The 10-year note yield peaked in October but just as important, the yield hasn’t fallen a lot even as inflation expectations have. The 2-year note yield peaked in March of this year and also hasn’t fallen much. Everyone is obsessed with terminology like “soft landing” for which there isn’t even a definition. Will the economy slow but not fall into recession? How the heck should I or anyone else know? The best we can do is interpret the economy as it is right now. Notice I said “the best”; even that isn’t easy.
What I am also sure of is that, absent some shock, markets will anticipate the downturn even if the Fed doesn’t. To see it all you have to do to see it is pay attention. And ignore Larry Summers.
Joe Calhoun
Stay In Touch