
“Higher for longer.”
That’s what the Fed says they intend to do with interest rates and investors finally decided to believe them last week. Bond yields, which have been stagnant since peaking last October, finally broke above the trading range they’ve been in for all that time. Short-term rates also moved higher but not as dramatically and the result was a steepening yield curve.
That steepening curve has a lot of market watchers warning of recession and for seemingly good reason. In the last 4 recessions, the yield curve has steepened just prior to recession, although the lead time has been variable (as long as a year) and recession didn’t start until the curve had turned positive (the 10-year/3-month curve is still at -1.12%). There is a big difference between this steepening and those and that is how the yield curve has steepened. In those four instances, the curve steepened because short-term rates fell faster than long-term rates, but both were falling. Today, the yield curve is steepening – at least so far – because long-term rates are rising faster than short-term rates. It’s just one more way this cycle is different than the ones most investors today remember.
In the recessions of the 1970s and early 1980s, the yield curve didn’t provide much, if any, warning before the onset of recession. Interest rates tended to rise right up to the onset of recession. The steepening of the yield curve, with rates falling, mostly started during the recession rather than before. That being the case, the current steepening probably isn’t a warning about recession but there is a limit to how high rates can go before they cause enough damage to the economy to create a recession.
To believe that the Fed knows that level with any degree of accuracy is akin to believing in unicorns and so last week when the Fed released their “dot plot”, their Summary of Economic Projections, we used it mostly as a guide to what is unlikely to happen. The Fed has no more idea what will happen to the economy over the next few years than I do. Or anyone else for that matter. If anything, the echo chamber nature of the insular Fed makes them a nearly perfect contrarian indicator; they are groupthink taken to its illogical extreme.
The median expectation at the Fed is for short-term rates to stay about where they are – “higher” – over the next year – “longer” – and then gradually fall over the next couple of years while inflation recedes, unemployment rises only slightly, and GDP growth stays pretty steady around 2%. That expectation is way beyond Goldilocks, a glide path to nirvana that makes me seriously wonder what they’re putting in the water down at the Marriner Eccles building.
Stocks and bonds had a bad week based on that fantasy of an outlook because it implies fewer rate cuts next year than were previously expected. Or at least that’s the excuse given in press reports. That assumes that anyone takes the Fed’s crystal ball gazing seriously and you can’t even count Jerome Powell in that camp:
So I think, you know, remember that, of course, the SEP is not a plan that is negotiated or discussed, really, as a plan. It’s accumulation, really, and what you see are the medians. It’s accumulation of individual forecasts from 19 people, and then what you’re seeing are the medians. So I wouldn’t want to bestow upon it the idea that it’s really a plan.
…
So I think people should know that economic forecasting is very difficult, and these are highly uncertain forecasts. But these are our forecasts. You know, we have very high-quality people working on these forecasts, and I think they stand up well against other forecasters. But just the nature of the business is the economy is very difficult to forecast.
-Jerome Powell at the post FOMC press conference, 9/20/23
High quality people. The best people. The best the economics profession has to offer. They aren’t very accurate but as an Army General once said about weather forecasters, we still need their forecasts for planning purposes. Yep, the best people producing the best forecasts a government salary can buy which you shouldn’t take seriously since they are highly uncertain but which are every bit as accurate as those produced by other people who can’t forecast the economy. Don’t you feel better now?
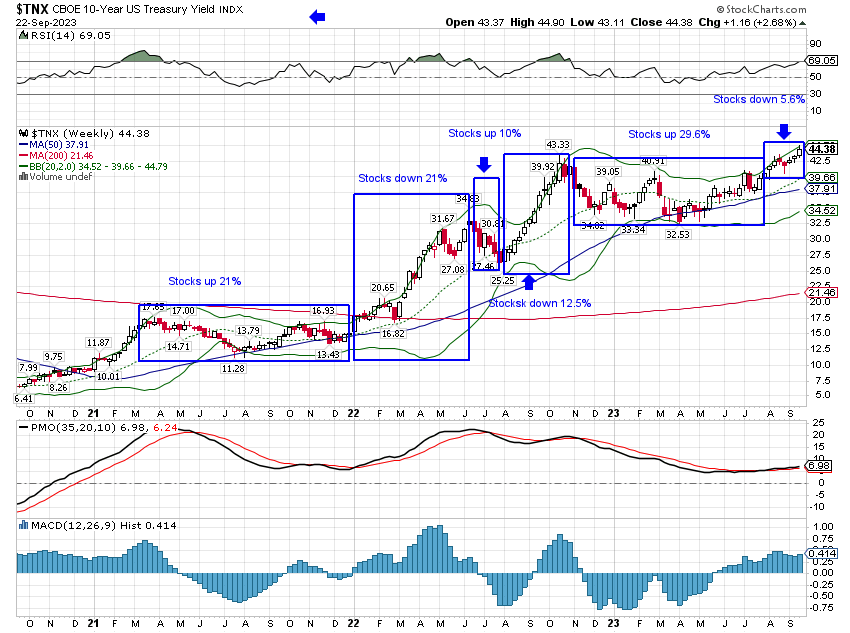
Interest rates have been in an uptrend for three years so the fact that they rose last week should not be surprising. And since the beginning of last year, stocks have fallen when rates are rising and rallied during the lulls when rates have stopped rising. Last week was entirely consistent with what markets have been doing for almost two years. And until rates stop rising, that is probably what we should continue to expect.
| 10-Year Treasury Yield | S&P 500 | |
| March to December 2021 | 1.62% to 1.52% | 21.0% |
| January 2022 to June 2022 | 1.52% to 3.49% | -21.0% |
| June/July 2022 | 3.49% to 2.52% | 10.0% |
| August 2022 to October 2022 | 2.52% to 4.25% | -12.5% |
| October 2022 to August 2022 | 4.25% to 3.97%* | 29.6% |
| August 2022 to Now | 3.97% to 4.5% | -5.6% |
When will interest rates stop rising? Based on history, the answer to that seems obvious – when we get to recession. The follow-up question, the one everyone obsesses about, is when? That is a question for which we have no answer – and never will – until after the fact and for that reason I question the value of continuing to ask it. The extreme focus on when implies that the timing is the most important factor, that the severity is known, an assumption with little basis. I suppose it is natural to assume that the next recession will look like the last two, that any recession will also usher in a crisis like 2008 or 2020. But what if that assumption is wrong?
History is merely a list of surprises. It can only prepare us to be surprised yet again.
-Kurt Vonnegut
Interest rates will peak at some point. When they do it may or may not coincide with the onset of recession. But even if it does there’s no reason to assume the worst, that it will be as dire as 2008 or 2020. Since 1947, the US has had 12 recessions with the average one lasting 3 quarters and involving a real GDP contraction of 2.7%. The two worst of those 12 were 2008 (-4%, 6 quarters) and 2020 (-9.6%, 2 quarters). Prior to those two, the average was a 1.9% real GDP contraction with, obviously, some quite a bit less than that. GDP only dropped 0.12% in the 2001 recession and 1.4% in the 1990 recession. Rather than assuming the worst case maybe it makes more sense to think about something more average. Personally, I can make a case for something very mild but I don’t think it makes any more sense to expect the best than it does the worst.
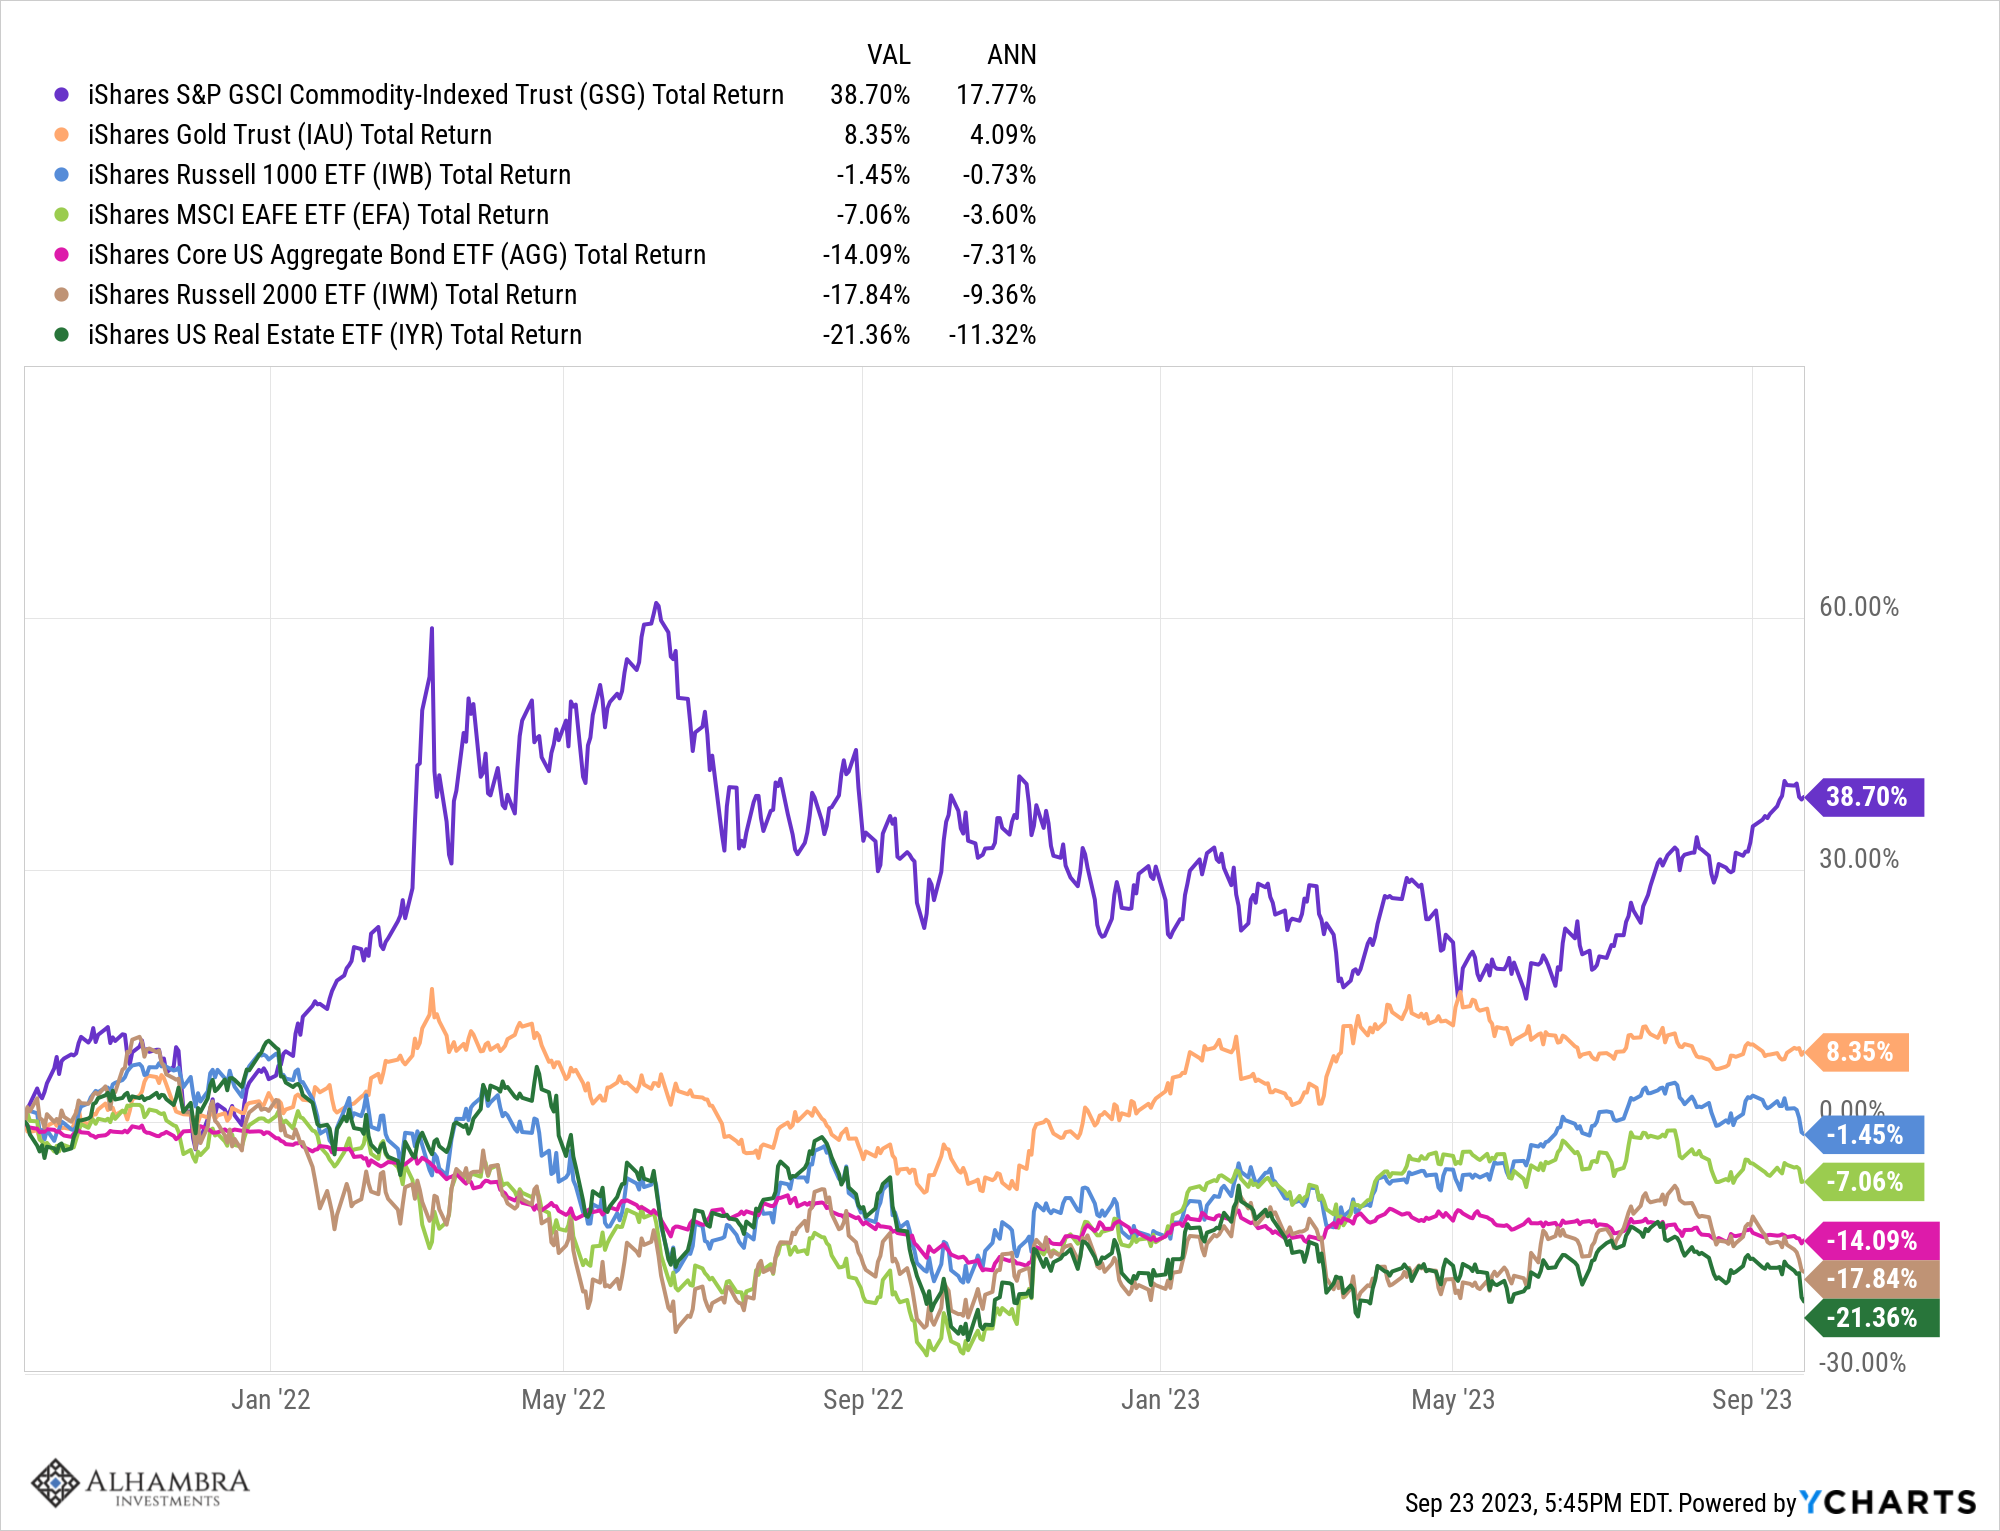
The last two years have been an exercise in returning to normal after the shock of the pandemic. Markets have not been kind to investors with every major asset class except commodities and gold down.
Long-term interest rates have averaged 4.6% since 1900 and 5.5% since 1950. With today’s 10-year Treasury yield approaching those averages, maybe the return to normal is about done. We should hope the Fed is right and interest rates do stay higher for longer. Historically, the post-2008 crisis period was the unusual period with interest rates stuck near zero for over a decade. Those extremely low rates caused more problems than they solved in my opinion, so I welcome the return to normal – the pre-2008 normal – even if it has meant some pain for investors. What comes next? I don’t know but I bet it surprises a lot of people.
Environment
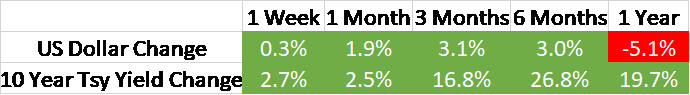
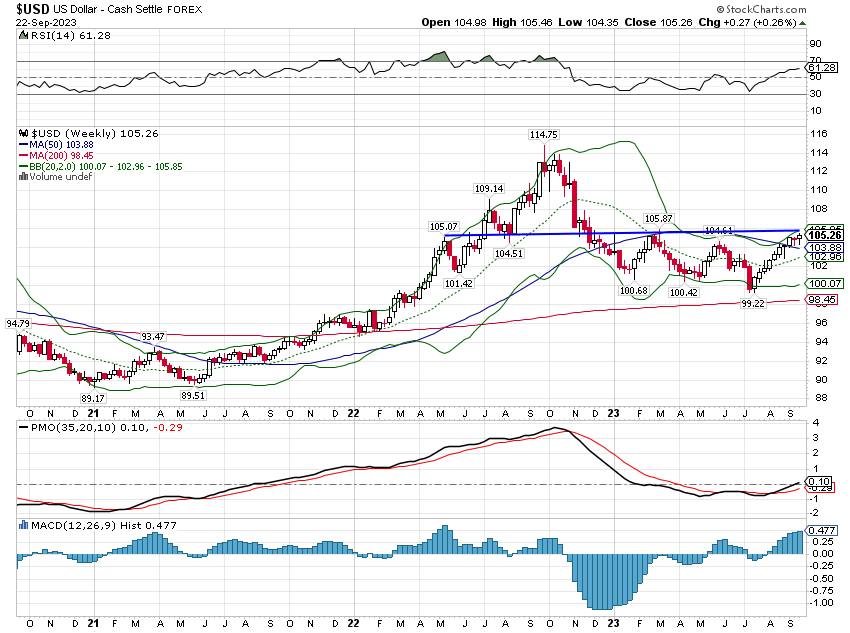
Unlike interest rates, the intermediate-term trend of the dollar remains neutral. That is somewhat surprising given the rise in the 10-year rate and the divergence in forward guidance between the Fed, the ECB, and the BOJ. It is very surprising given the rise in real rates, with the 10-year TIPS yield rising above 2% last week.
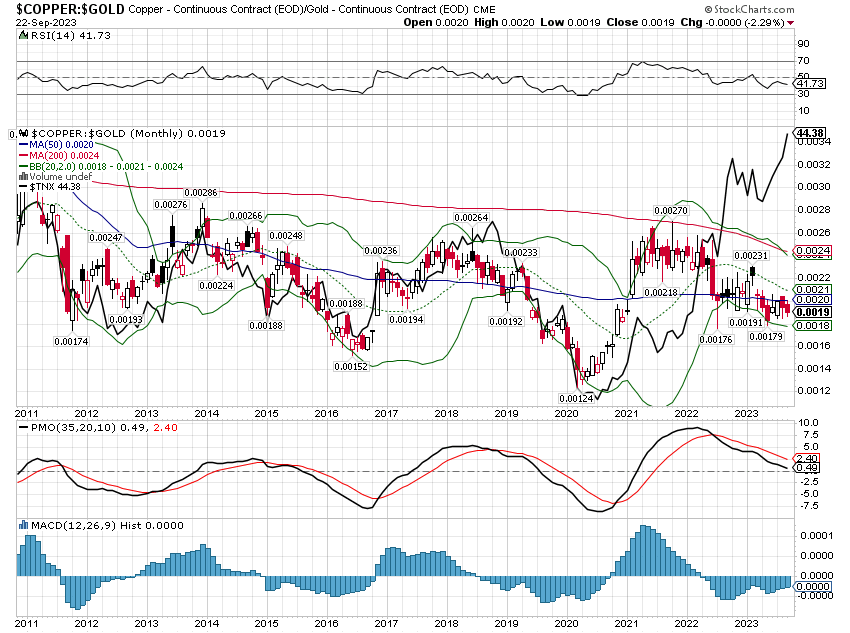
In addition, we would generally expect gold to weaken with higher real rates. Instead gold is up slightly since the week of June 20 when the 10-year TIPS yield started a rise from 1.5% to a peak of 2.11% last week. Given that divergence and the lackluster dollar, I remain skeptical of the recent move-up in rates. The forex and precious metals markets seem to be saying that the current level of rates isn’t sustainable. That divergence can also be seen in the copper/gold ratio which argues for a big rise in the ratio or a drop in rates.
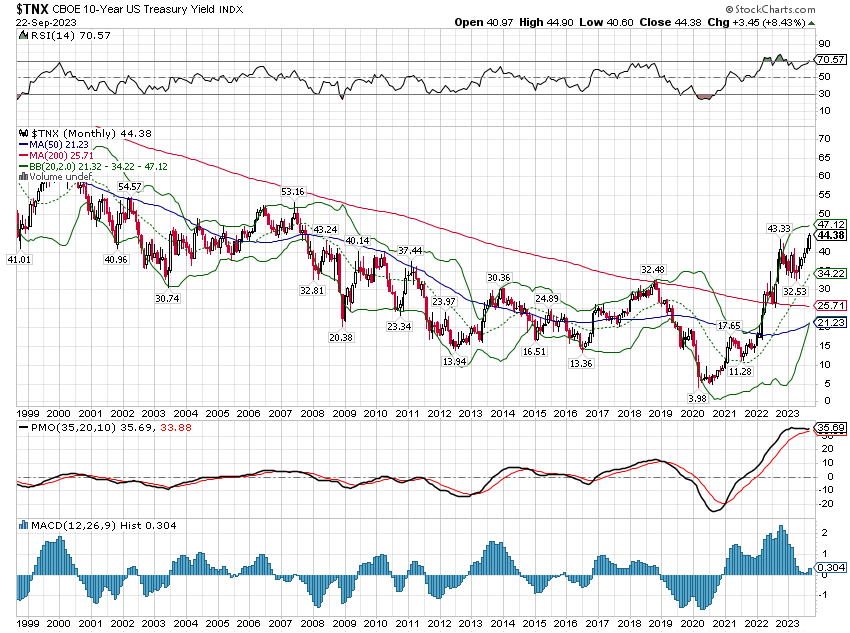
The 10-year Treasury yield did break out finally and is trading now at its highest level since 2007. How much higher can it go? Simple technical analysis would put the next resistance around the 2007 high of about 5.25%. That’s not a prediction because I have no idea why a resistance level from 16 years ago would have any validity. I do think we’re finally seeing some capitulation in bonds. The fund flows in TLT finally turned negative over the last month for the first time since about the Obama administration so maybe we’re getting close to a buy point on the long end of the curve.
I think there are good reasons to believe that inflation and interest rates will be “higher for longer” but I don’t mean another year like the Fed. Killing inflation surges is difficult and takes, on average, according to the IMF (see here), about 5 years to accomplish. And that assumes the central bank doesn’t make any big errors along the way, a bet I wouldn’t make. So, when I say higher for longer I mean over the next decade. (I’ve written about the long-term case for higher inflation twice over the last year: Dawn of a New Era and The Times They are A-Changin’)
The first wave does appear to be receding but it would be a mistake to believe the war has been won. Have you seen the demands of the UAW? Did you see what UPS drivers got in their contract negotiations? Did you notice that fast food workers in CA have negotiated a $20 minimum wage? No, I don’t think inflation is done because there is no way these companies are going to eat these pay hikes. They may not pass it along immediately but they will raise prices to protect margins if they can.
Inflation and interest rates are probably peaking for this cycle. But if this episode runs like others throughout history, the Fed and other central banks will declare victory too soon and we’ll get another wave. Higher for longer indeed.
Markets
It was another one of those no-place-to-hide weeks with all our major asset classes in the red for the week. This correction is getting a little long in the tooth although the total drawdown has been quite mild for most of the asset classes. Since the end of July, the only asset class in the green is commodities (+2-4% or so depending on which ETF you use). Large and small-cap stocks are both down over 5% but less than 10%, as are REITs. Intermediate-term bonds and gold are down 1-2% depending on how you define intermediate.
Even with the mild correction, sentiment has turned negative pretty quickly although it isn’t yet at the levels that prevailed last October when everyone was bearish and expecting the recession to start next week. Still, it is negative enough that any positive news on rates seems likely to send stocks up sharply. Speculators are still short stocks and bonds, continuing to ride the upward trend of rates. The short in bond futures is at an extreme but I suspect a lot of that is just hedging – of bonds and mortgages – or arbitrage. I don’t know that the reason for the short is all that important though; we’ve still got a lot of money on the short side of the trade.
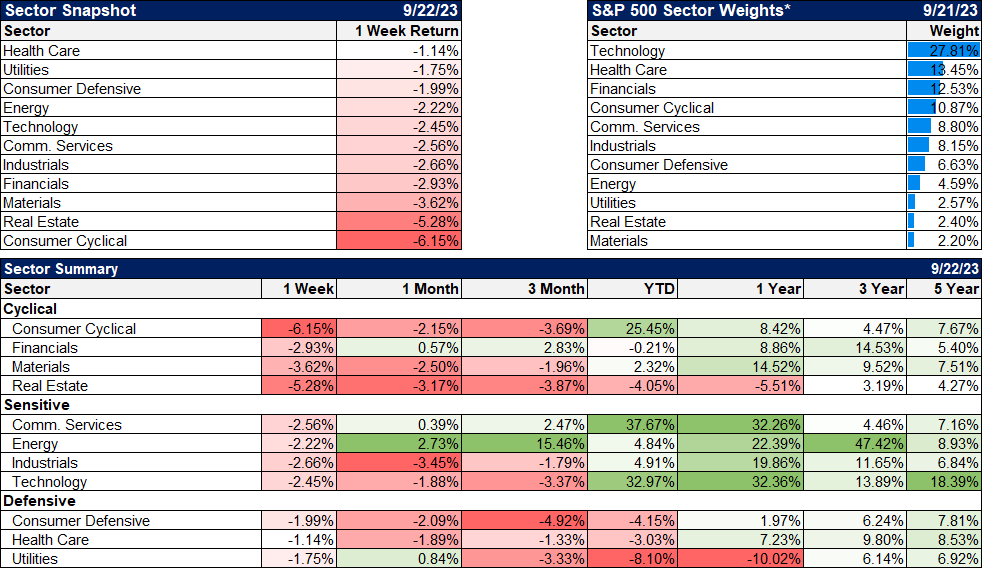
Value stocks outperformed last week but down over 2% still hurts so I don’t know that I’d call that a win. Commodities and value stocks continue to lead over the last 3 years though and I do think that matters. I don’t think it is a coincidence that those assets outperformed in the inflationary 1970s as well. Commodities averaged over 20% a year during the decade of the 70s, small cap value 12.8% while the S&P 500 averaged just 5.6% (and-1.6% real). REITs also performed well, up nearly 11% a year from 1972 (that’s as far back as I have data) through 1979. History may just rhyme but that might be good enough.
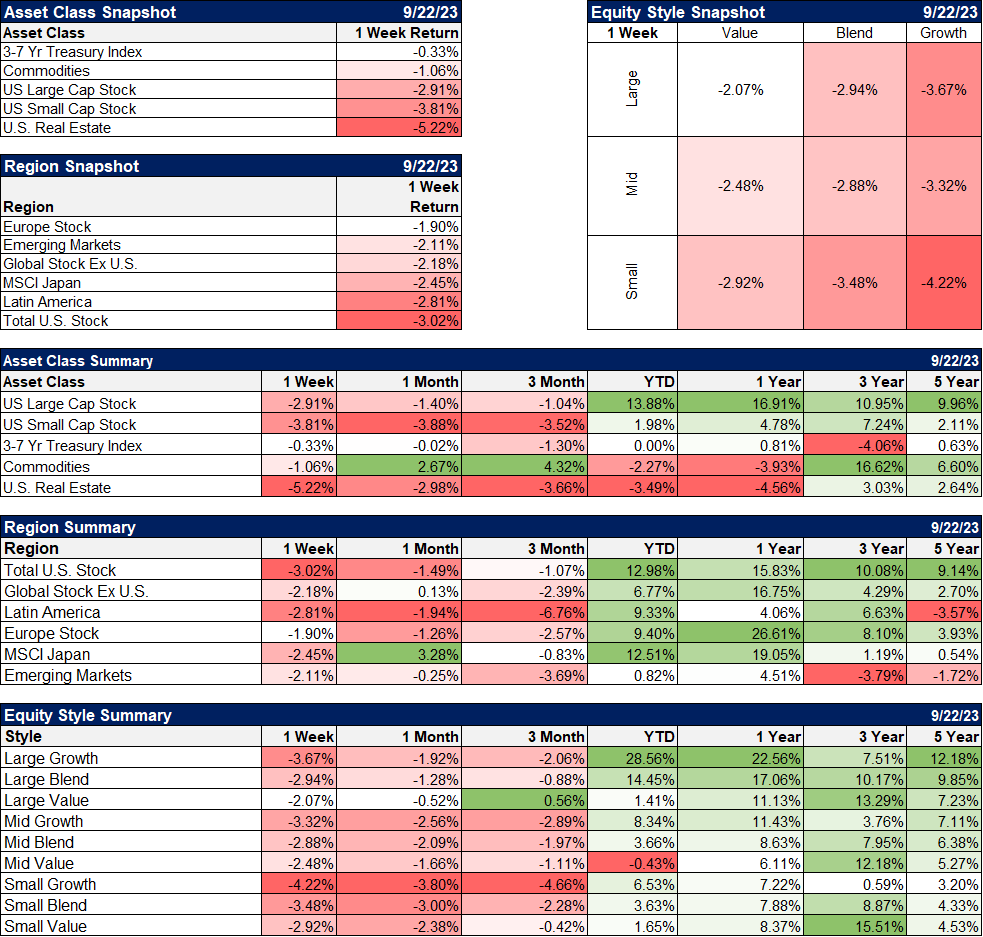
We didn’t even have a positive sector last week with even defensive sectors down.
Market Indicators/Economics
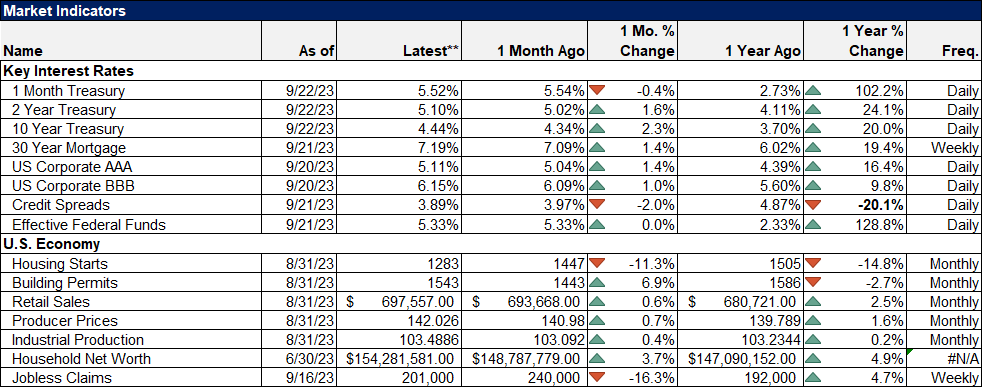
The economic data last week wasn’t surprising in any way. Housing starts were down but permits were higher. That looks like the intersection of short term and long term to me. The Philly Fed manufacturing index turned negative again after an up month. These surveys and the PMI surveys all seem to be in the process of bottoming but there isn’t any evidence of a sustained uptick yet. The index for future activity within the Philly Fed survey did rise to 11.1 from 3.9 so that might be confirming that idea. That part of the survey has been positive for four months in a row.
Existing home sales were down just 0.7% but they’re so low they can’t go much lower. Jobless claims stayed low at just over 200k.
Market indicators still show no signs of stress in credit and rates are still rising.
The Fed’s dot plot, like most forecasts of the future economy, will almost certainly be wrong. The question is how and on that front I offer this headline from last week’s Wall Street Journal:
Higher Interest Rates Not Just for Longer, but Maybe Forever
Higher for longer? Heck no. Higher for-freaking-ever! I think the concerns about higher rates may have just jumped the shark. The article itself is about the neutral rate, the rate at which inflation and employment are balanced. All the article really shows is that the Fed is still in the thrall of theories that don’t survive in the real world. But the headline is a perfect bit of clickbait and an indication that rate worries are maybe a wee bit overwrought.
When I think about higher for longer, I’m thinking about a regime shift that will play out over years, maybe decades, like the last one that saw interest rates fall for 40 years. The history of interest rates over the last century is two big trends. The first is the rise in rates that started in the late 1950s that saw long-term rates rise steadily from 3% in 1958 to 14% in 1981. The second is the long downtrend in rates that took them from that 1981 high to the lows of 2020 under 1%. Those are secular trends and I think we’ve started the next one.
The cyclical trend is the much shorter business cycle trends we see from recession to peak expansion and back to recession. After the big rise in rates of the last 3 years, this cycle is probably nearing its end. Whether that is later this year or next year doesn’t really matter all that much. What will matter is whether the next downturn is a catastrophic mess like the last two recessions or something less dramatic. Right now the consensus is for dramatic, a textbook example of recency bias if ever I’ve seen one.
Joe Calhoun
Stay In Touch