

It’s an election year and you know what that means. Yes, every four years we gather as a nation, a democratic nation, to decide which of the two candidates for President available to us is the least offensive. It isn’t very democratic with just two options but that is the system that the politicians built to benefit…themselves and it’s all we’ve got. This year the system has coughed up a dog’s breakfast of candidates, two men who, in a just world, wouldn’t be anywhere near the Oval Office. Anyway, what you can expect over the next 9 months is a laundry list of campaign promises that neither candidate will be able to deliver, endless handicapping from pundits, some truly awful debates, and maybe a little rioting after the actual election. Democracy in action.
But you didn’t come here to hear my cynical views on politics and politicians. No, you want to know what this election year holds for your investments and as luck would have it, I just read an article on the Presidential Cycle. It’s a theory that posits that stock market returns can be foreseen merely by noting the year of the Presidential term. In the first two years of a President’s term, he’s trying to do all the things he promised on the campaign trail and as these are usually BIG THINGS, because that’s what gets you elected, they tend to weigh on stocks. The second two years is when he (I’d use she here but alas, I can’t yet) abandons that stuff he couldn’t pass through Congress and just spends willy-nilly to try and make sure he gets another four years. Stocks really like that so years 3 and 4 are good years.
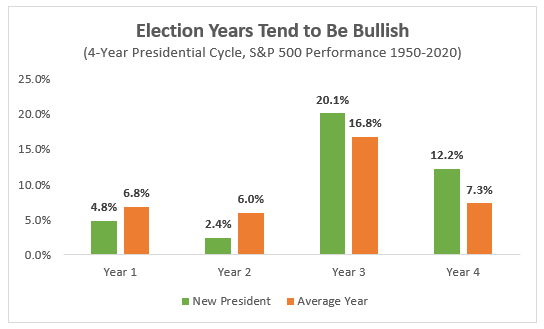
Source: Zack’s Investment Research
Let’s look at the last 3 Presidents and see how this holds up:
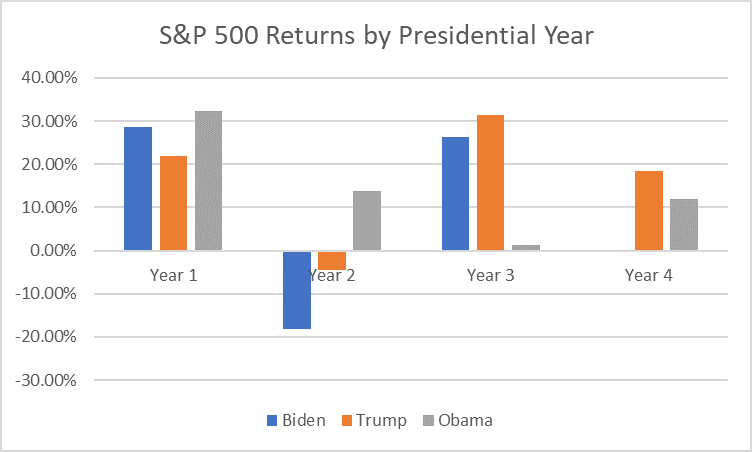
As you can see, theory doesn’t exactly measure up to reality. All three had great first years and Obama’s second year was his second best. Trump and Biden had good third years but Obama tanked. And year 4 was good for Trump but not as good for Obama. Based on this entirely unscientific review I have to say this theory is just about as accurate as a campaign promise.
Call me crazy but I think you need to base your investment strategy and tactics on data rather than theories spun out of thin air. Have a strategic allocation that covers all the bases, widely diversified and global. Tactical overlays can be constructed based on current trends and history. Track changes in the important market variables, such as the dollar and long-term interest rates, that can have a big impact on asset class returns. Tactical changes should have a significant payoff to make them worth taking the risk of venturing too far away from your strategic allocation. The tactical portion of your portfolio will be the smallest so it has to perform significantly different than your strategic to make a difference.
To cite one example, since 1971 (right before the dollar was untethered from gold), the performance of international stocks has been greatly influenced by the trend of the dollar. Specifically, in years the dollar rose, international stocks returned just 5.1% on average. But in years the dollar fell, the return jumped to 17.9%. When the dollar rose, international stocks were up 62.2% of the time but when the dollar fell they rose 83.3% of the time. The payoff from getting the foreign vs domestic part of your portfolio right can be large.
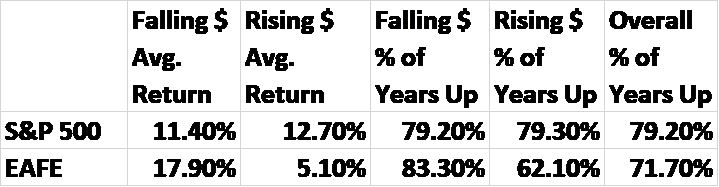
The difficulty is, of course, predicting the direction of the dollar which isn’t easy, to say the least. On the other hand currency trends tend to persist so just observing the current trend is sufficient in most cases. If the dollar is in a rising trend, you should probably just stay away from international stocks. And just because the dollar is in a downtrend doesn’t mean to get rid of all your US stocks and go all in on international. The returns for the S&P 500 aren’t much affected by the dollar.
You can see similar disparities in returns for periods when interest rates are rising or falling.
If you want to make tactical changes to your portfolio, make changes that can have a big impact on your returns. Gold is up 87.5% of the years when the dollar is falling but only 41.4% of the time when it is rising. Commodities rise when the dollar falls 79.2% of the time, but just 55.2% when it is rising. REITs do better when the dollar is rising and interest rates are falling.
I think there’s some truth to the Presidential cycle theory and to be fair there are qualifiers that change the results, like whether there is an incumbent running. But it isn’t something you can or should use to guide your portfolio.
Environment
Dollar
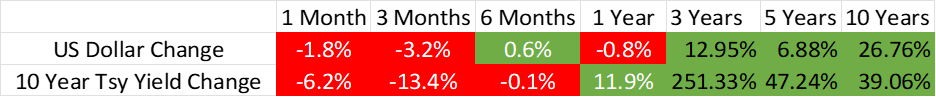
The dollar remains in a short-term downtrend that started in October of 2022. The full extent of the short-term downtrend was complete by mid-2023 though and since then the dollar really hasn’t done all that much. The one-year loss is minimal.
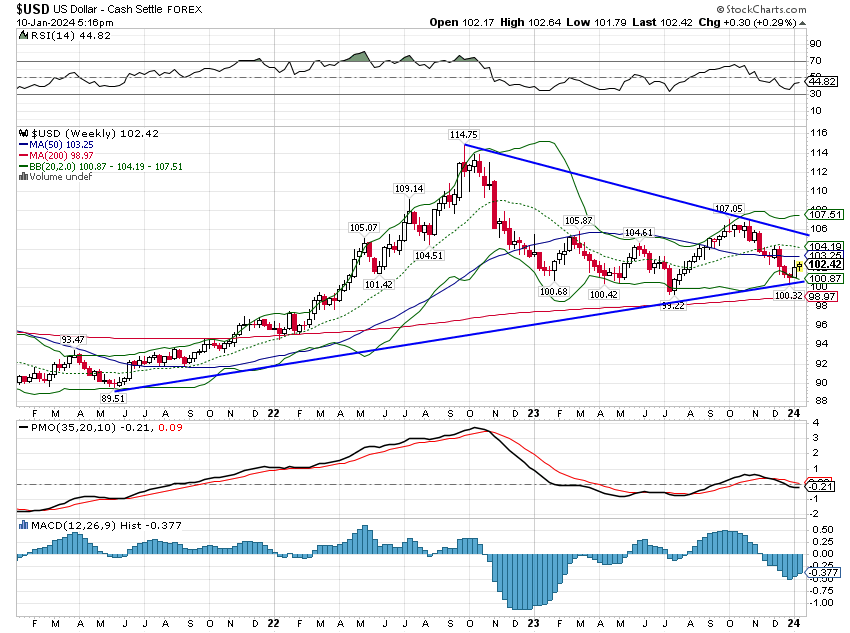
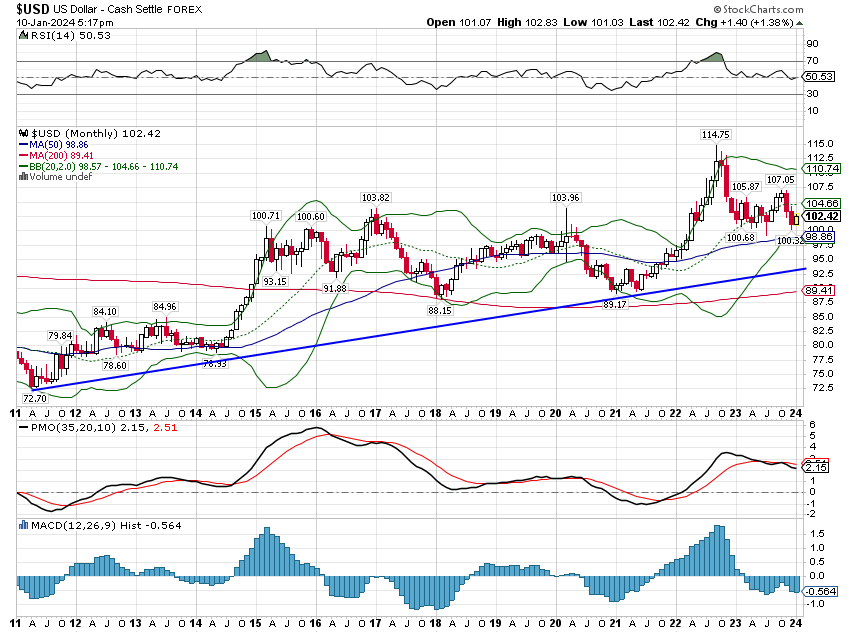
The short-term downtrend has to be viewed in the context of the intermediate and longer-term uptrends. You’ll notice though that the longer-term uptrend was generated from just two surges higher in 2014/15 and 2021/22. Other than that the dollar traded mostly sideways in about a 10% range. This is what we see over the longer term as well. Big movements tend to happen over fairly short periods of time and most of the time the dollar is pretty stable. It is during the big moves that other markets are affected the most.
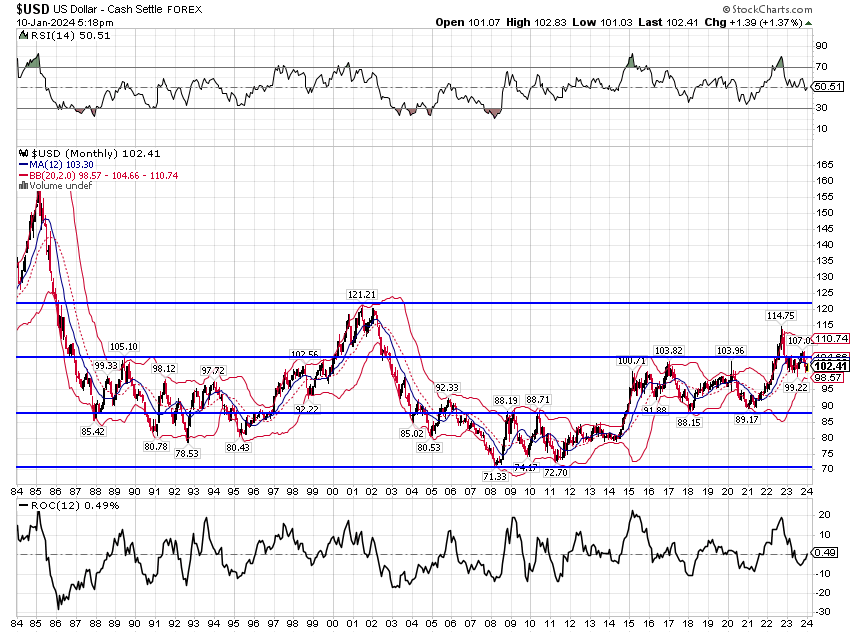
Over the very long term, the dollar has traded in a range with three distinct zones. The upper and lower zones are where bad things happen (monetary deflation in the top, inflation in the bottom) while the middle one is the comfort zone. We’re currently near the high end of that middle zone and I expect to see it traverse back to the lower end over the coming years as it has in the past.
The trend of the dollar can have a big impact on market returns and your preferred asset allocation. Since the end of the Bretton Woods currency arrangement in 1971, certain asset classes exhibit a clear preference for a weakening dollar.
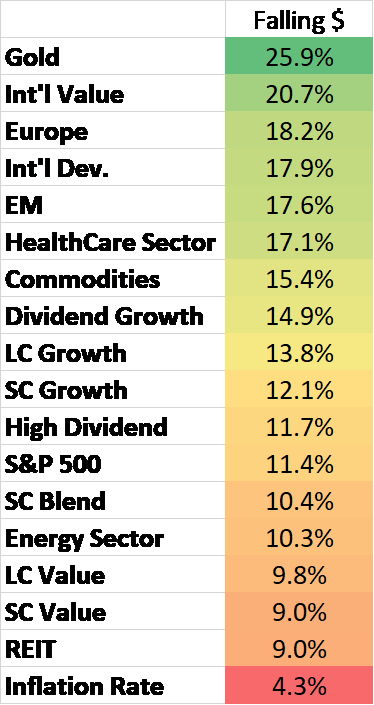
The difference in return from weak to strong dollar is not insignificant so getting the direction of the dollar right is very important for asset allocation purposes. For now, I continue to believe that the long-term trading range of the dollar will continue. Having just come off a high in the upper zone, I think it is reasonable to expect a return over the next couple of years to, at least, the bottom of the middle zone which would constitute a weak dollar period of some significance. Right now, with relatively high real interest rates in the US, the dollar has stabilized around the 100 level. Changes from here will be dependent on how real growth expectations between the US and the rest of the world evolve and, to some degree, what the Bank Of Japan decides to do. The European economy appears to be emerging from its recent bout of weakness while the BOJ is finally moving rates in the right direction if ever so slowly. If the US also enters a period of economic weakness – which is somewhat discounted already – then the dollar would seem likely to resolve lower.
Longer term, I think there are more significant reasons to expect a weaker dollar, starting with our politicians’ (of both parties) newfound infatuation with industrial policy. Government-directed investment may create activity but long-lasting benefits have, in the past, proved quite elusive. The real problem with our government deficits and debt isn’t the debt itself but rather what the borrowed money is spent on. I have zero confidence that any government-directed investment effort, whether led by Democrats or Republicans, will produce a return in excess of the cost. With our future economic growth almost entirely dependent on productivity growth, wasted investment based on the whims of politicians is not something we can afford. The dollar seems the likely relief valve if growth stalls.
In the short term, I expect the dollar to rise back to the 104/105 area before resuming its downtrend. We don’t really do much with short-term movements and this is no different. If, on the other hand, the dollar breaks that short-term downtrend I may have to reassess.
Interest Rates
Long Term Rates
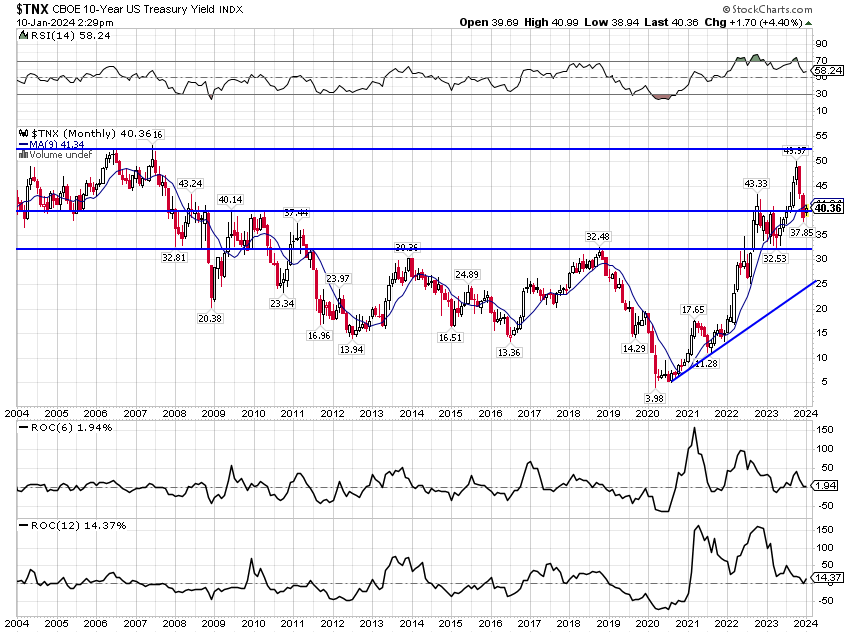
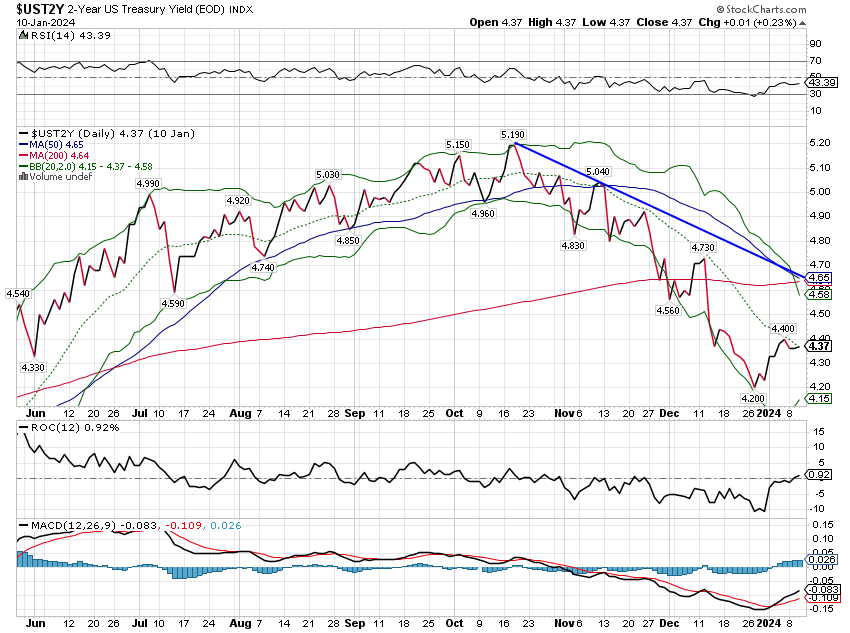
The 10-year Treasury rate also continues in a short-term downtrend that started after the rate peaked at 5% in October last year.
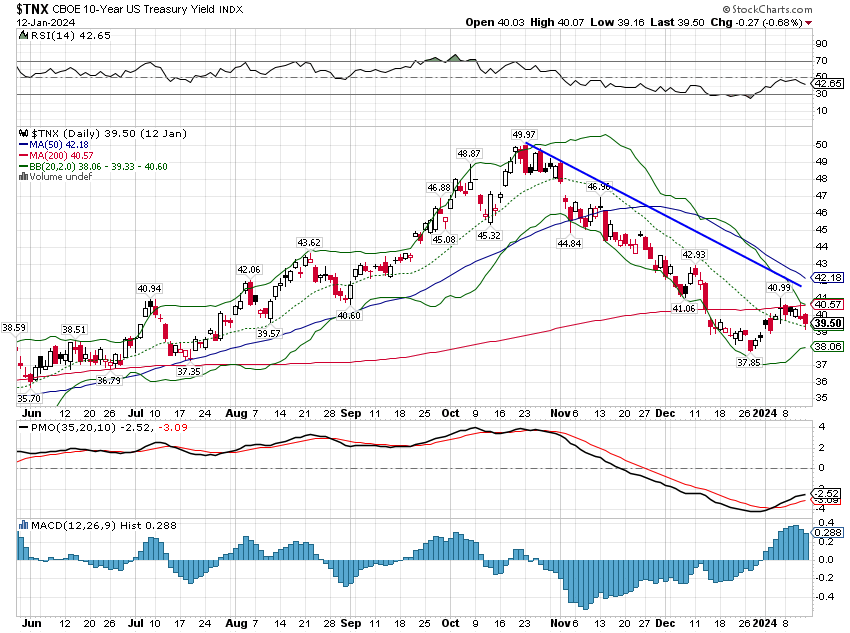
The intermediate-term trend is still up but it is tenuous.
If rates are really topping for this cycle, it would not be out of the ordinary to see rates rise but fail to make a new high before resuming the downtrend. I don’t see anything in the current economic data or indicators that threatens imminent recession so rates could easily rise some from here, especially considering the plethora of supply hitting the market. A very smart man once told me that the market will always act to frustrate the maximum number of people and with everyone suddenly bullish on bonds, a rise in bond yields would certainly fit the bill.
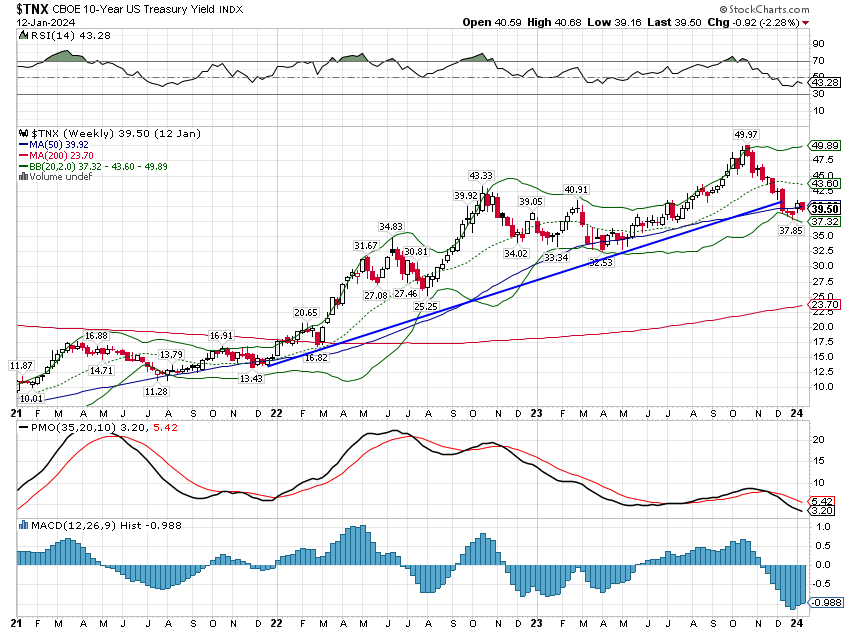
When it comes to long-term rates though, we’re focused on the long-term trend which we think this recent three-year rise has changed.
The 5% peak in October is a level that is consistent with rates in the late 90s, over 25 years ago. I don’t think one can call this a long-term downtrend anymore. The 10-year rate has been in an uptrend since the bottom in 2020 and the long-term trend is now neutral. Rates are not going back to those COVID lows absent something in our future that is worse – much worse – than a garden variety recession.
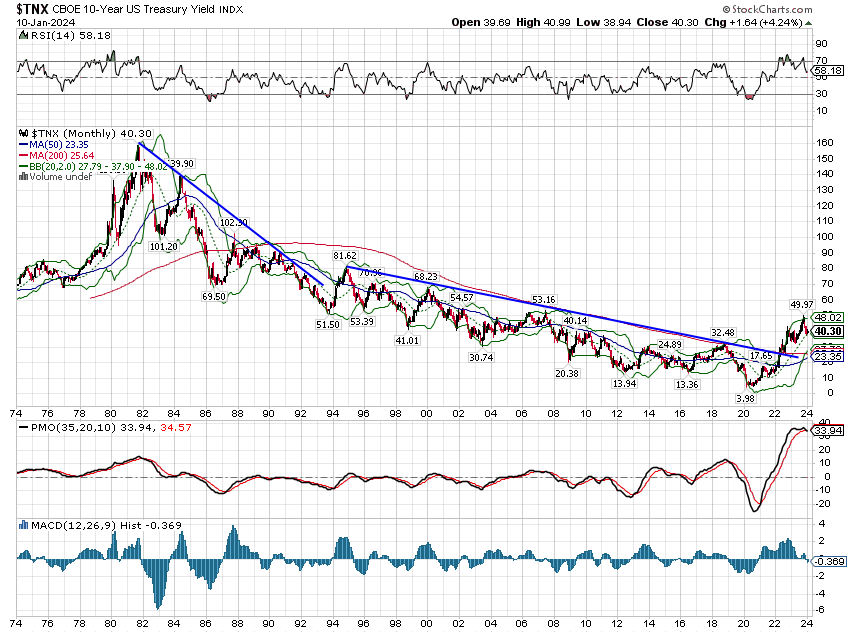
Interest rate trends, like the dollar trend, have a big impact on asset class returns. I expect rates – and inflation for that matter – to be higher in the coming years than they were in the aftermath of the 2008 crisis. I’ve been writing for two years about the economy returning to normal and this is what I mean. The post-2008 era is the anomaly and getting rates back up to where they are today is just back to normal. Will they go higher still? Maybe, if our government keeps giving drunken sailors a run for their money.
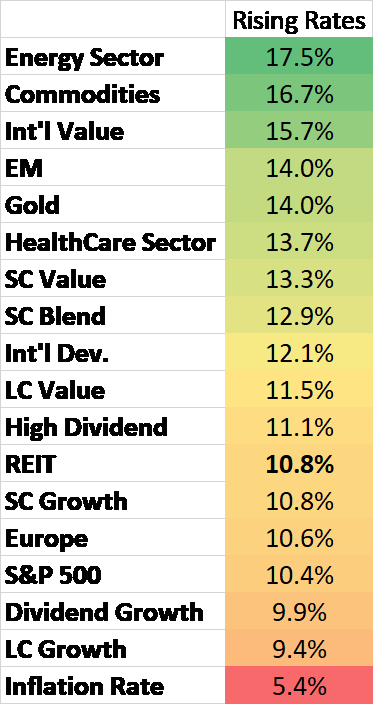
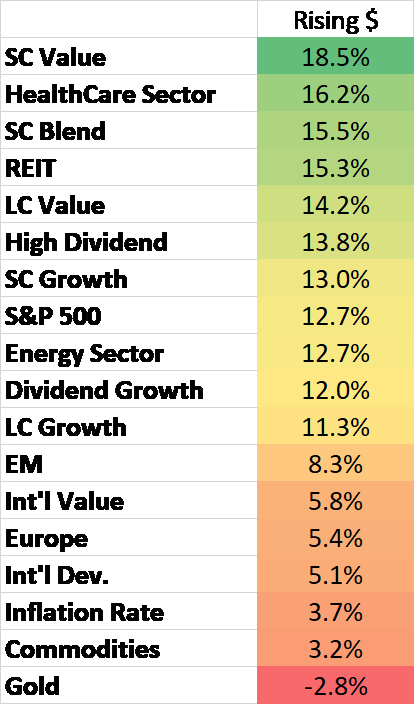
We had 40 years of falling rates with each successive cycle taking rates to new lows. Are we now in the opposite condition where each successive cycle will take rates to new highs? It is an intriguing possibility and one that few are prepared for. The best-performing assets in a rising rate environment are not what has worked for the last decade+. The S&P 500 and S&P 500 Growth are both near the bottom of the list while commodities, international, and value are near the top.
Short-Term Rates
Like long-term rates, market participants believe that short-term rates have peaked for this cycle. Market odds currently show a better than 70% probability that the Fed will cut the overnight lending rate from the current 5.25-5.5% to 3.5 – 4% by the end of the year. That seems a very firm consensus on where things are headed in the next year and that naturally makes me skeptical. But the market offers the best possible view of the future and right now it is pointing to an economic slowdown over the next year of some significance.
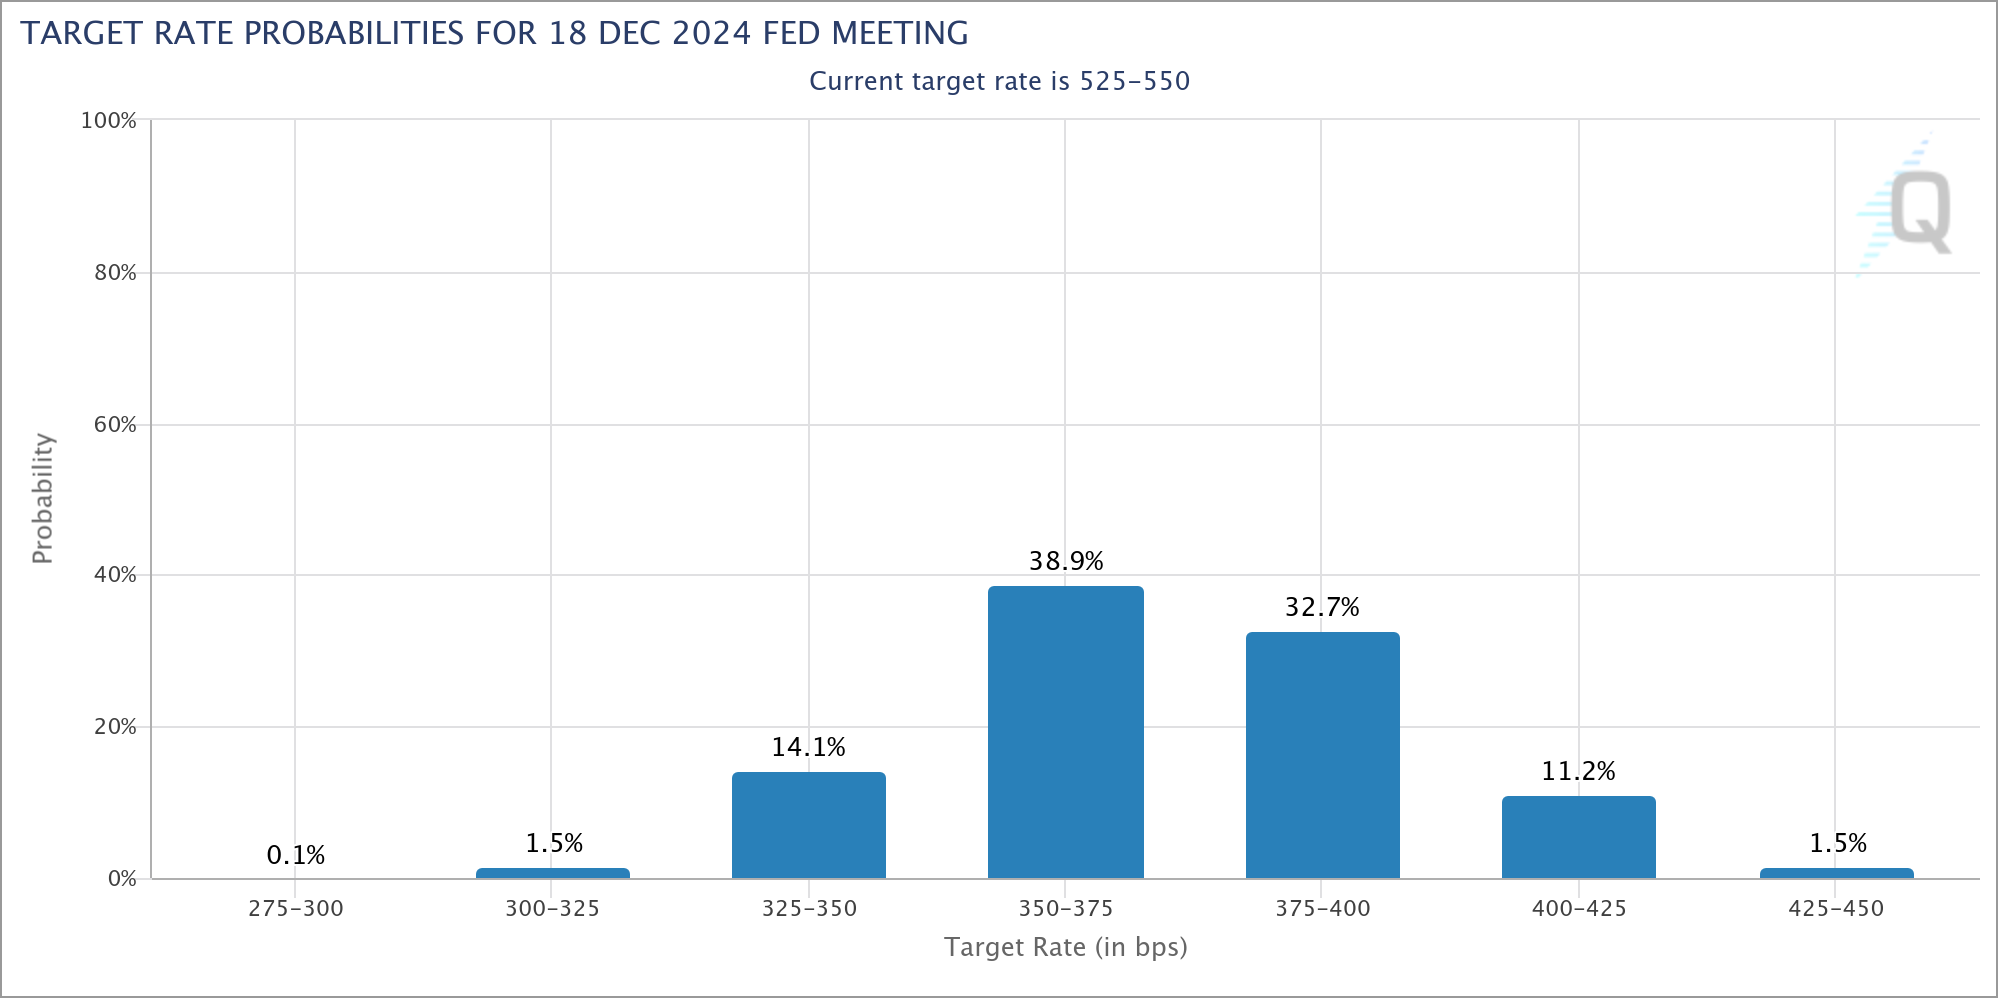
Short-term rates, like long term, fell pretty rapidly once they peaked in October. If we start to see consistently weak economic reports – worse than expected – short-term rates could continue to fall but peak rates to recession can be as long as 18 months.
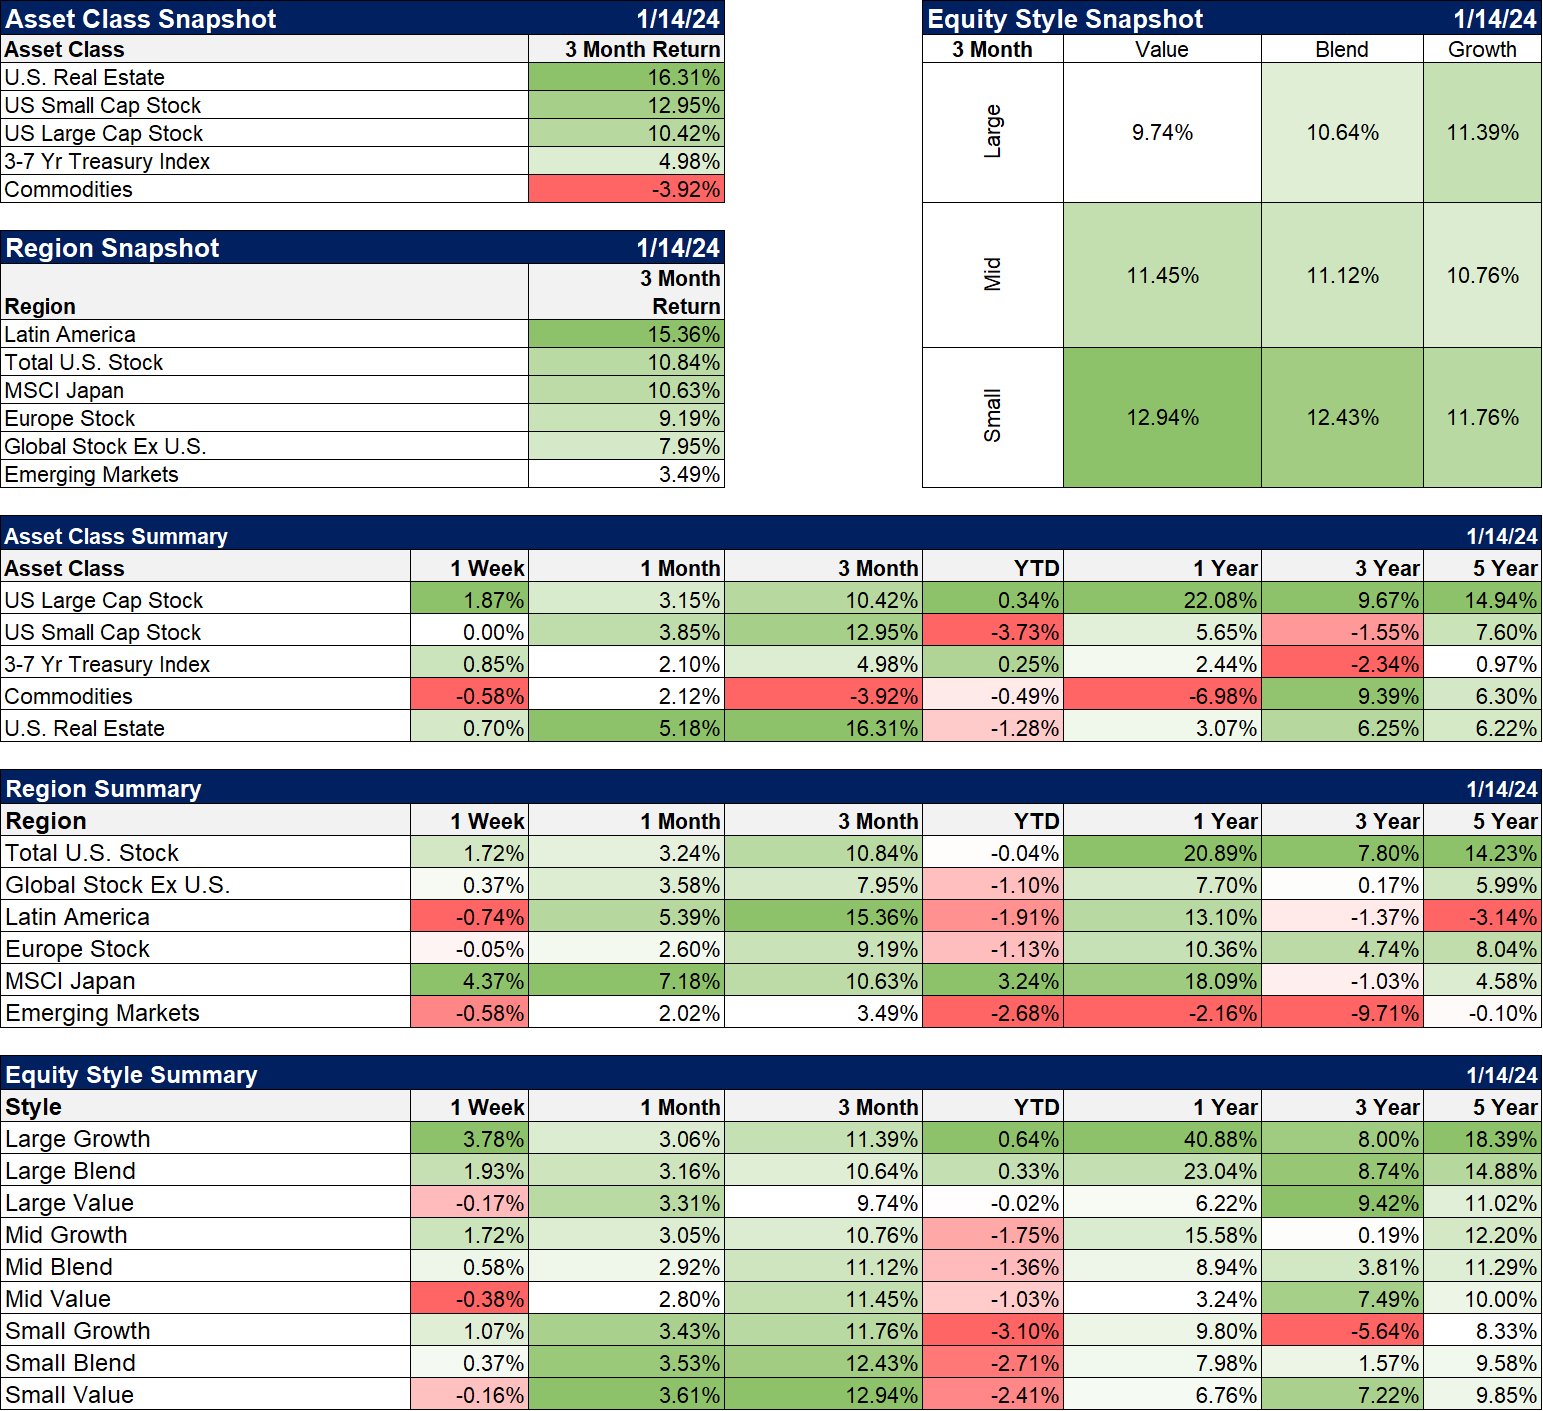
Markets
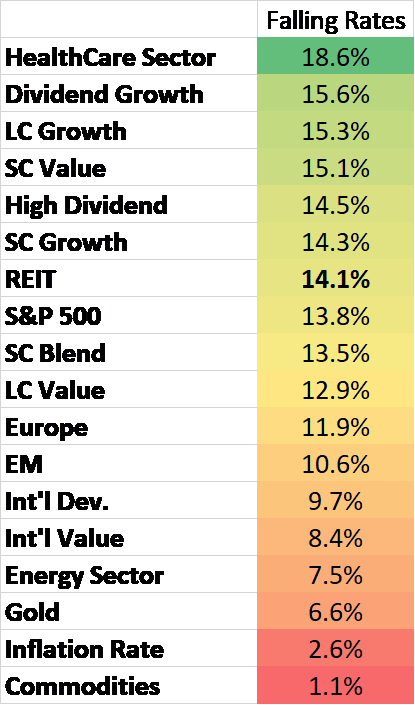
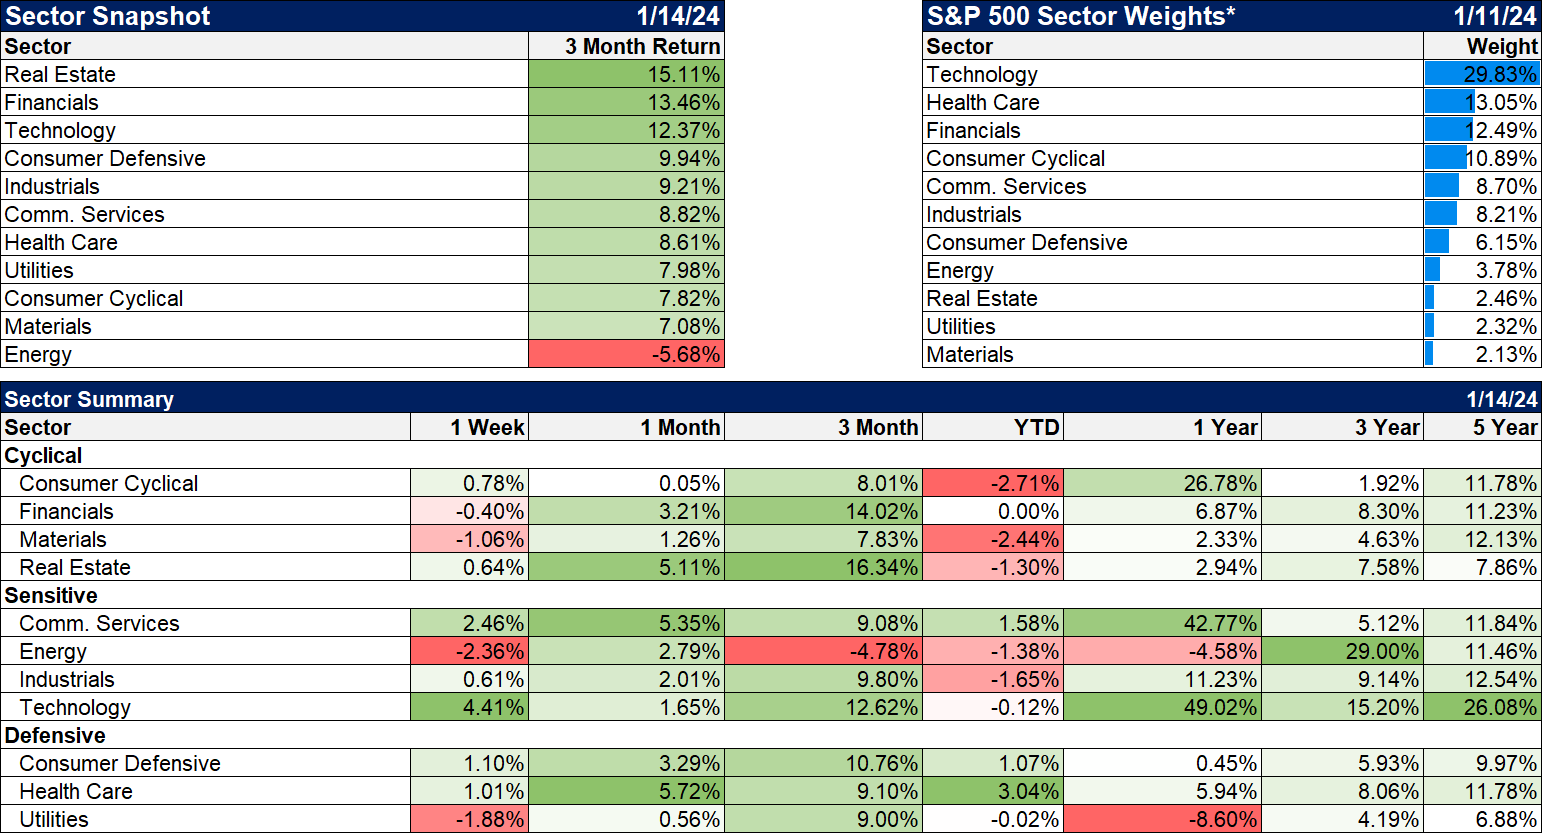
The last three months have been very good for markets with all the major asset classes up except for commodities. REITs led the way, up over 16% and that isn’t surprising as they are sensitive to interest rates. As noted above, in years when rates fall REITs average return is 14.1%, while years with rising rates drop the return to 10.8%. From an equity-style standpoint, we would expect Large Cap Growth and Small Cap Value to outperform and that’s exactly what we see below. Commodities also perform much better when rates are rising so the recent underperformance isn’t surprising.
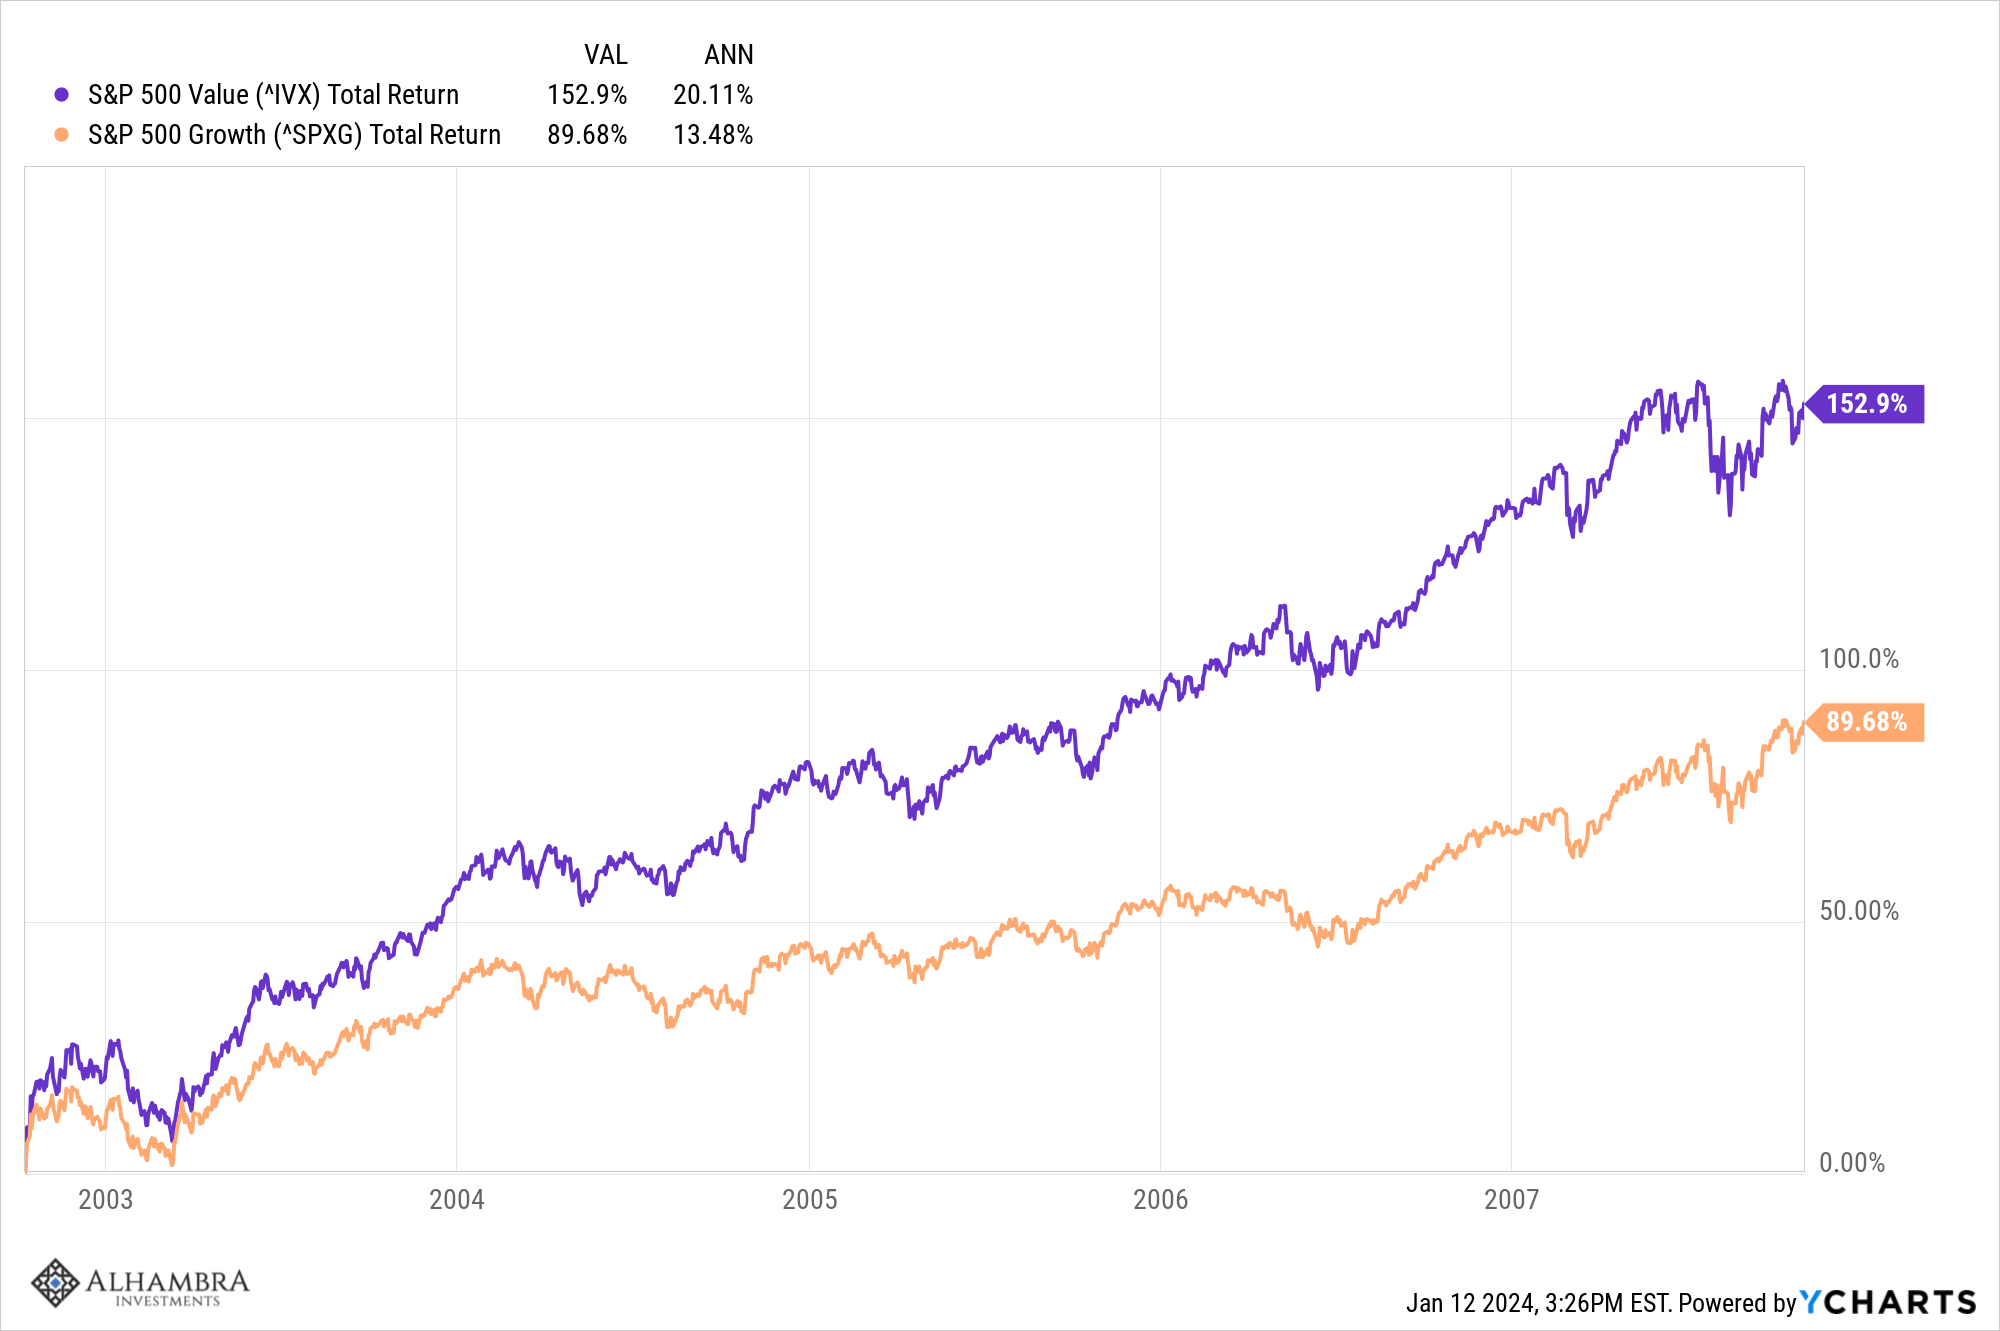
We continue to tilt toward value, especially small cap, because the dollar remains in an intermediate and long-term uptrend. Value stocks tend to perform better in rising dollar environments. Since 1971, in years when the dollar rose, large and small cap value rose 83% of the time versus 79% and 75.5% respectively for all years. Of course, these are tendencies and not carved in stone. We’ve had two of these shifts between growth and value since the turn of the century. The first was in the aftermath of the dot com bust at the turn of the century. Both value and growth fell during the long 2000 – 2003 bear market but growth fell a lot more than value (-50.4% vs -32.2%) and when stocks turned higher, value’s return was 1.7 times that of growth until that bull market topped in November of 2007. The dollar fell during this period, contrary to the longer-term averages for weak dollar periods, because growth stock valuations were absurdly high.
The next shift was during the financial crisis of 2008 when value stocks took a greater beating due to their higher exposure to financial companies. The following bull market, which started in March of 2009 saw growth outperform value by nearly 2% per year.
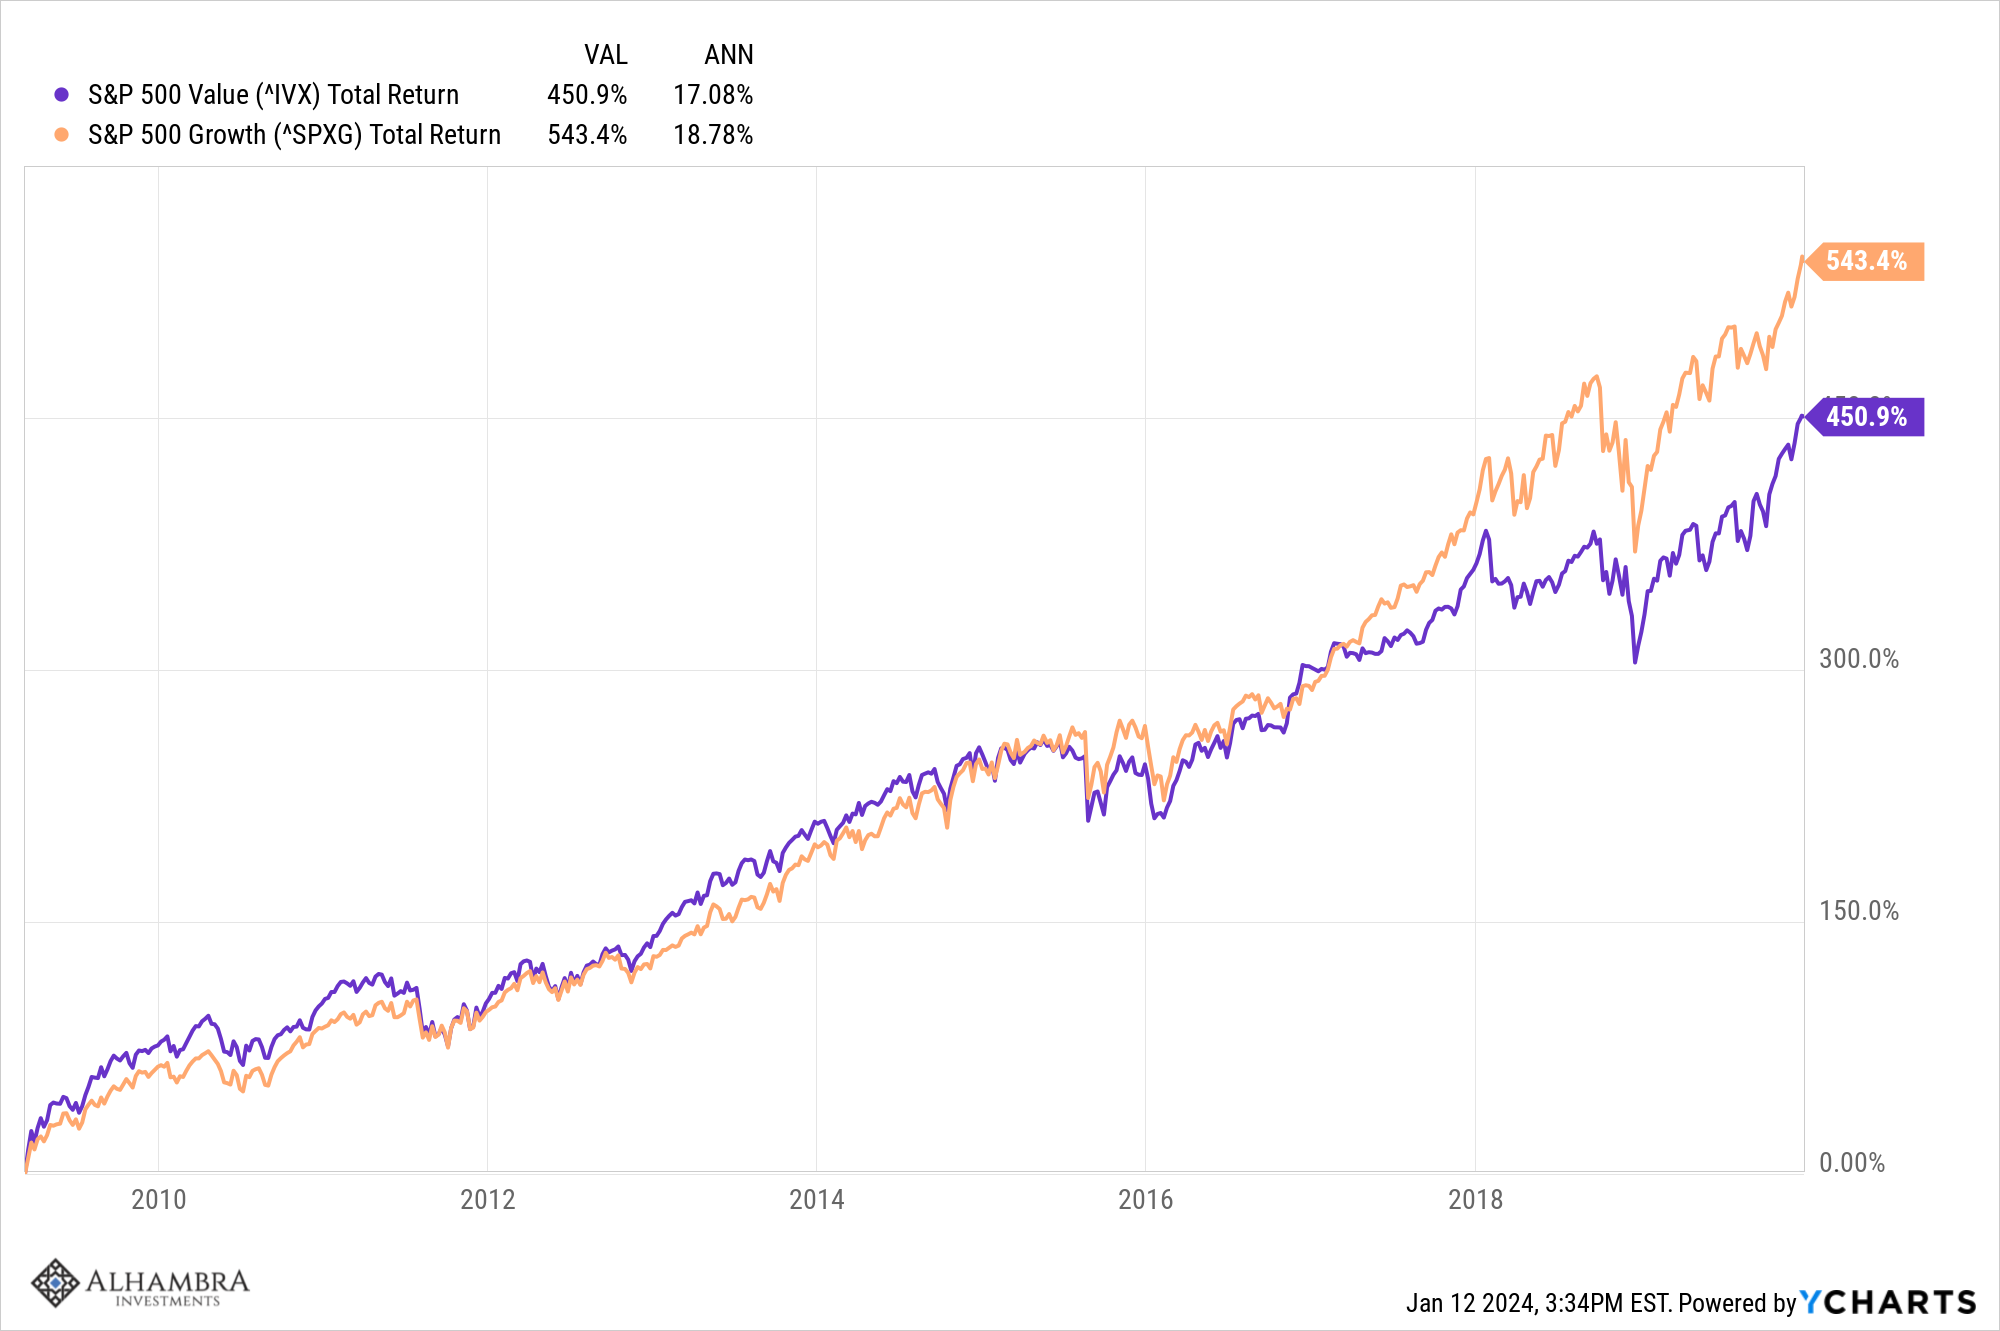
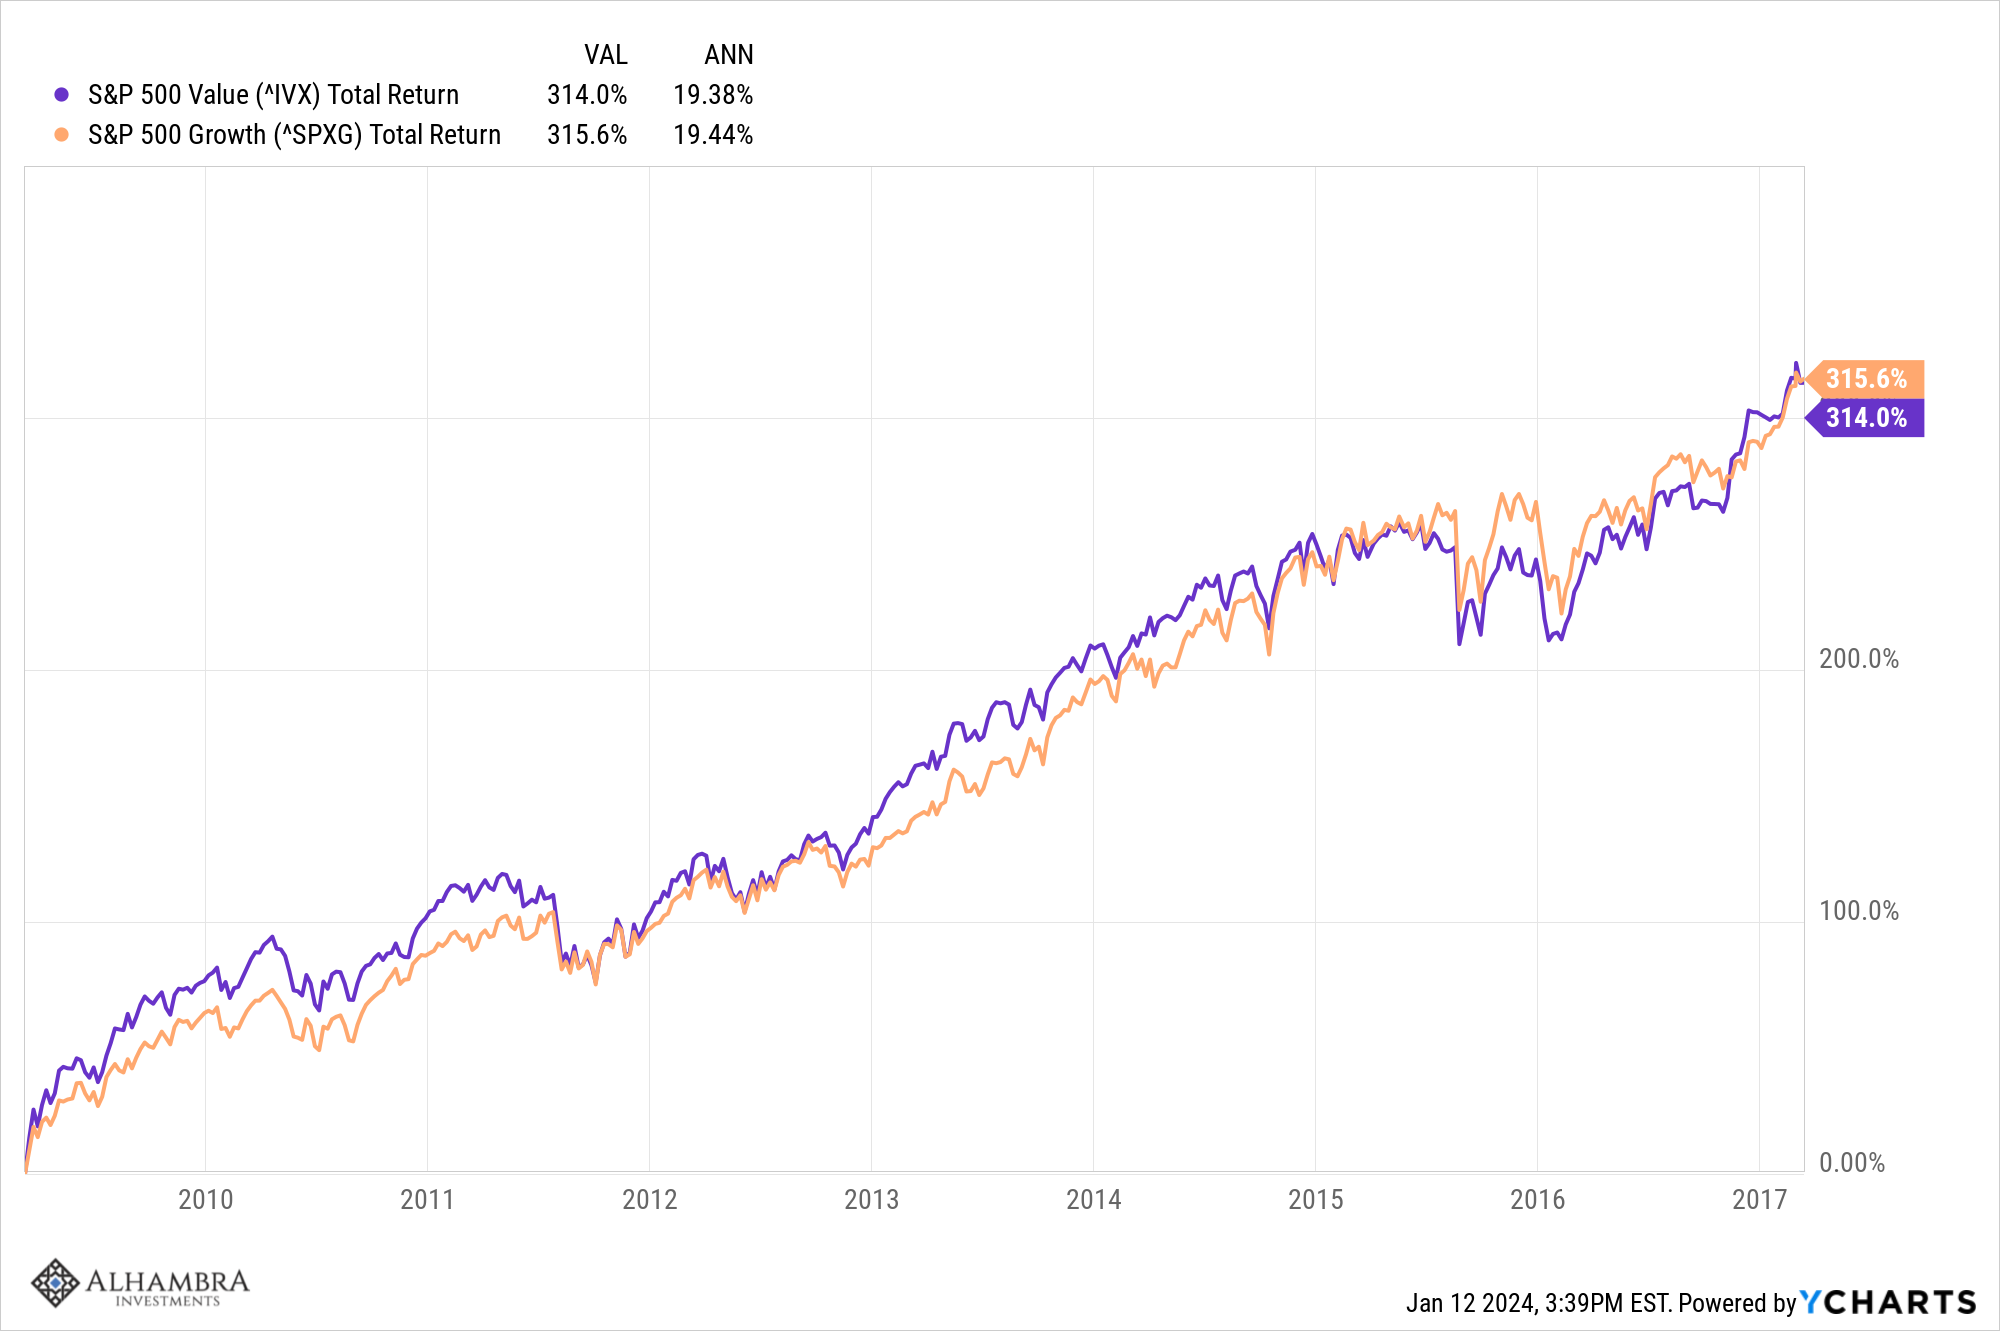
It is interesting though that growth’s outperformance since the 2007 top was concentrated in the bear market of 2008/9 and in the period from early 2017 to early 2020 when COVID hit. From the bottom on March 9th, 2009 to March 14th, 2017, the total return of S&P 500 value and growth were almost identical and this came during a strong dollar period when value generally outperforms. The differences came from the top in October of 2007 to the bottom in March 2009 (-48.5 vs -60.4%) when value was overweighted to financials and the period from March 14th, 2017 to the February 2020 top (67.3% vs 34.2%).
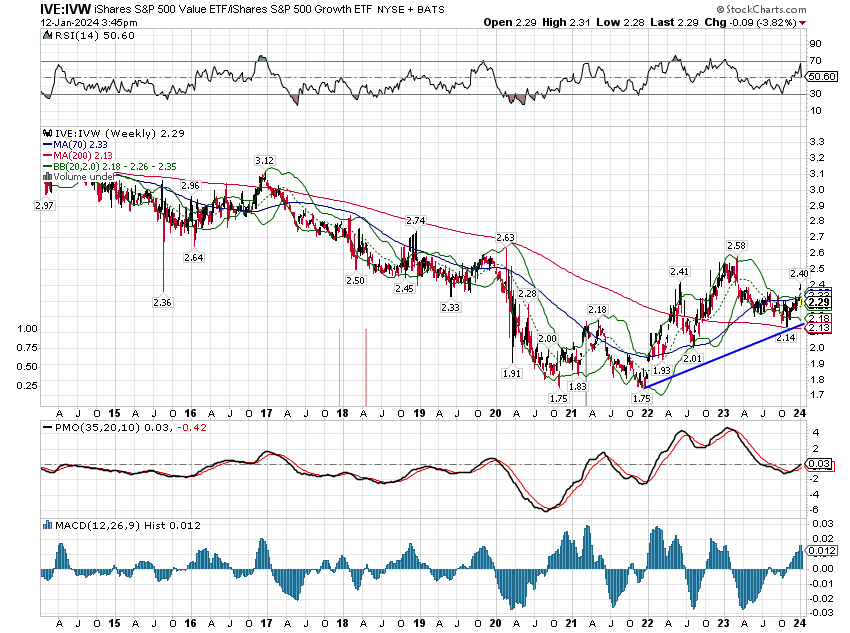
It is easier to see today’s ongoing shift on a technical chart. This is a ratio chart of the S&P 500 value vs S&P 500 growth. You can see that value has outperformed since the COVID low – and especially over the last two years – and is now firmly in an uptrend above the 200-week moving average (red line) a condition not seen for more than a month or two since 2007.
Small and midcap value vs growth produces largely similar narratives; the value/growth contest isn’t about large or small. Value has outperformed growth over the last three years across large, mid, and small-cap stocks and we think that is likely to continue. My long-term view, as I said above, is that the dollar will fall in coming years and that would usually favor growth stocks. I also think though that rates will be on the rise in coming years and that tends to favor value stocks. With growth stocks near all-time high valuations, this coming period may prove similar to the post dot com crash period when value outperformed despite a falling dollar. It is said that valuation isn’t a timing tool and I generally agree with that, but it does matter eventually. I think eventually may have finally arrived.
Sectors
The two top-performing sectors over the last three months are Financials and REITs, two sectors we expect to outperform when interest rates are falling. Technology also performed well which also isn’t surprising as growth tends to outperform when rates are falling.
We look at sectors in two ways – momentum and reversion. Momentum is what’s working today and reversion is the sectors that have performed poorly over the last 5 and 10 years. From a momentum standpoint, the top 5 are:
- Technology
- Communications Services
- Financials
- Healthcare
- Real Estate
From a reversion view, the top 5 are:
- Real Estate
- Utilities
- Staples
- Communication Services
- Energy
For investors, I think it makes sense to look at sectors that are on both lists: Real Estate and Communications Services.
Another sector that might warrant some research is healthcare which has been a middle-of-the-pack performer over the last 3, 5, and 10-year periods. There is stepped-up M&A activity in the sector and valuations are pretty reasonable. A lot of long-term R&D also seems to be finally paying some dividends and I expect that to continue – assuming the government doesn’t kill the goose that lays golden eggs.
Utilities also look interesting because of the continued push for electrification but they also seem a bit pricey for a regulated industry. They are dependent on regulators to raise prices in an era when everyone is already complaining about inflation. That might be a tall hill to climb.
Market Economic Indicators
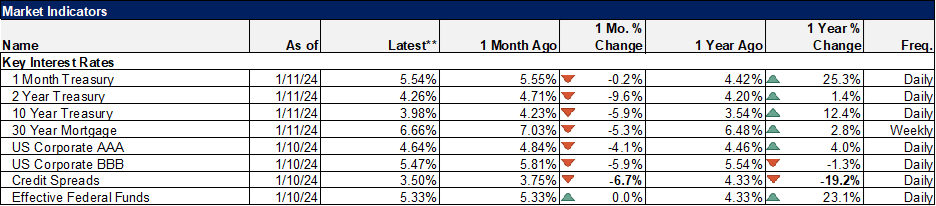
The most notable of these indicators is credit spreads which are back near their lows of the cycle. There was a brief blip higher at the beginning of the year that some made a big deal out of but that’s already a memory. You may think the economy is headed for trouble but the market disagrees with you.
Joe Calhoun
Stay In Touch