
The financial commentariat first started to worry about recession in April of 2022 when the spread between the 10-year Treasury rate and the 2-year Treasury rate turned negative – the yield curve inverted. It subsequently righted itself to positive territory until July of 2022 and has stayed inverted ever since. Since an inverted yield curve has preceded almost every recession in the post-WW2 period, it is seen as a warning to policymakers and investors alike. The lag between inversion and recession is, however, as is often said about monetary policy, long and variable. In the 1990 recession, it was 19 months, from January ’89 to July of ’90. For the 2001 recession, it was either 39 months or 14 months depending on whether you count from the first inversion or the second. In 2008, it took 24 months. The 2020 recession did see a very minor inversion in August of 2019 but I don’t think anyone seriously believes that was a warning about the coming COVID pandemic. If you want to round it off, that’s about a 2-year wait, on average, from inversion to recession.
So, why are people surprised that we find ourselves 18 or 21 months (depending on whether you count from April ’22 or July ’22) past the inversion and not in recession? It sounds utterly normal to me but for some reason, the rest of the world simply cannot believe we aren’t in recession yet. And every time a bad economic stat pops up, they pounce on it, saying this is it, NOW we’re going into recession. The latest one is the New York Federal Reserve’s Empire State Manufacturing survey last week and it was truly awful. The General Business Conditions index fell to -43.7, a depth only exceeded by the -78.2 reading in April of 2020 with the economy shut down for COVID. Even during the 2008 financial crisis it only fell to -34.3, so, yes, this is a really bad number. The details of the report were no better (from Trading Economics):
New orders (-49.4 vs -11.3) and shipments (-31.3 vs -6.4) also posted sharp declines and unfilled orders continued to shrink significantly (-24.2 vs -24). Also, delivery times shortened (-8.4 vs -15.6) and inventories edged lower (-7.4 vs -5.2). Employment (-6.9 vs -8.4) and the average workweek (–6.1 vs -2.4) declined modestly. Meanwhile, the pace of input price increases picked up somewhat (23.2 vs 16.7), while the pace of selling price increases was little changed (9.5 vs 11.5). Finally, optimism remained subdued although firms expect conditions to improve over the next six months (18.8 vs 12.1). The capital spending index increased ten points to 13.7, pointing to some improvement in investment plans.
So, does this mean the recession – the one widely predicted last year and the year before – has finally arrived? Strangely enough, if history is a guide, it means the opposite, that whatever slowdown we’ve already had is near an end.
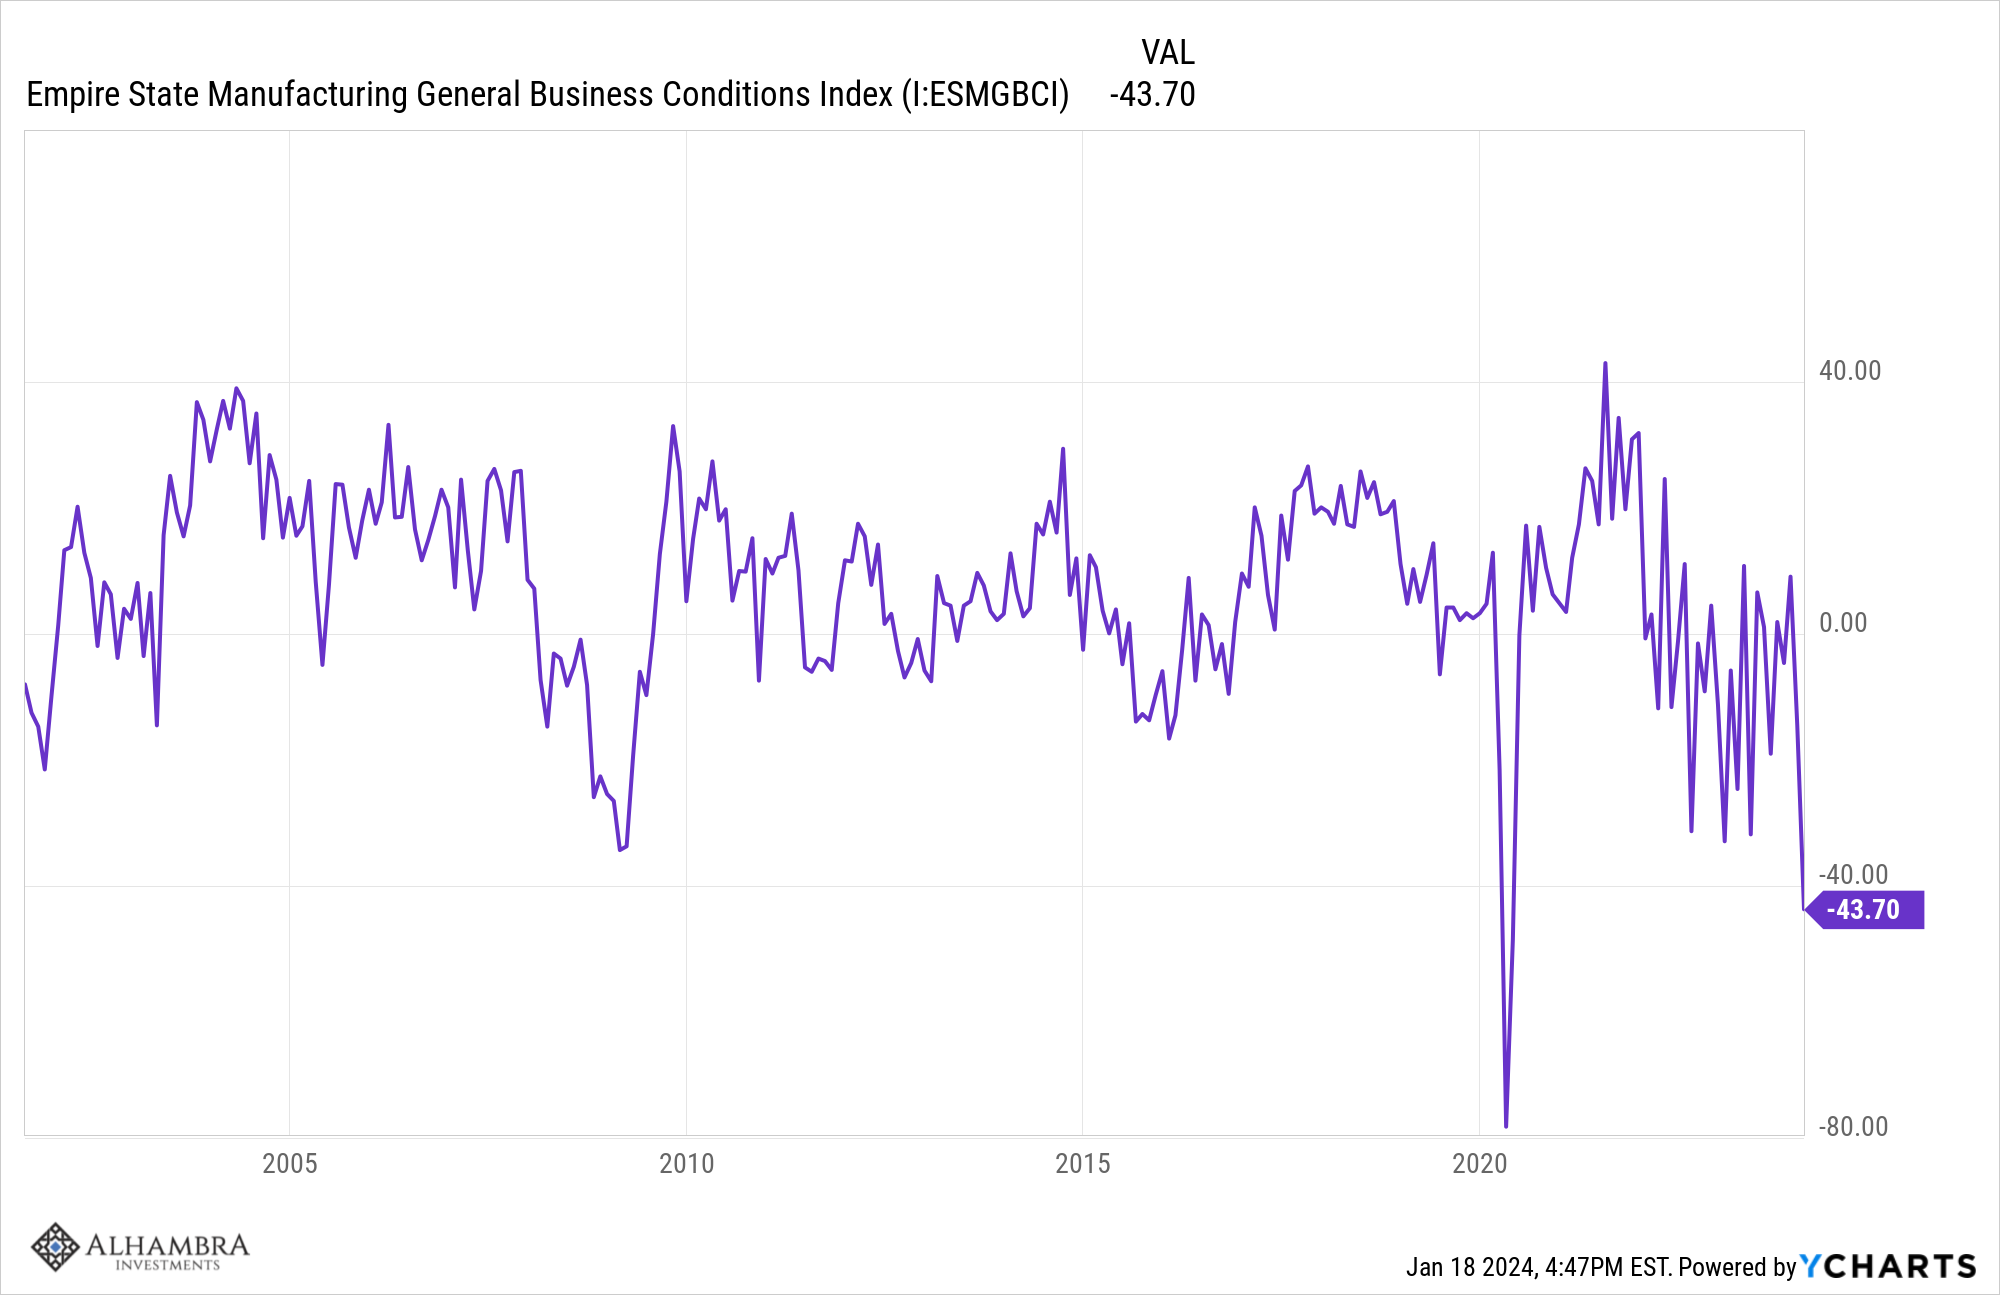
The previous lows in this index – and I suppose we don’t know this is the low but it sure seems likely considering the history – were:
November 2001 at -21.5
February 2009 at -34.3
April 2020 at -78.2
What’s most interesting about those dates is that they are at or near the end of recessions. The 2001 recession ended the same month the index hit its low. The 2008/2009 recession didn’t officially end until July of 2009 but by then the index was back up to zero and the S&P 500 was up nearly 20%, although it didn’t make its low until March. The COVID recession in 2020 also ended the same month the Empire State index hit its low.
There are other manufacturing indicators that also point to recession. The ISM manufacturing survey has been below 50 (contraction) for 14 straight months. The Philadelphia Fed’s manufacturing survey has been negative for 16 of the last 18 months. The Richmond Fed has been negative for 18 of the last 20 months. The Kansas City Fed has been negative for 12 of the last 15 months and the readings that weren’t negative were zero. The Dallas Fed has printed 20 straight negative readings.
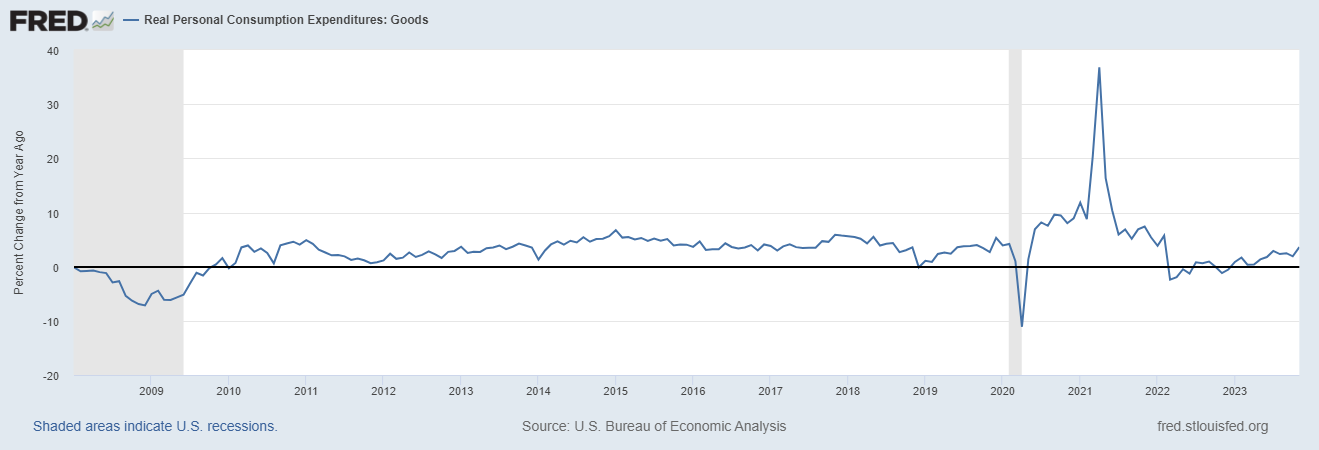
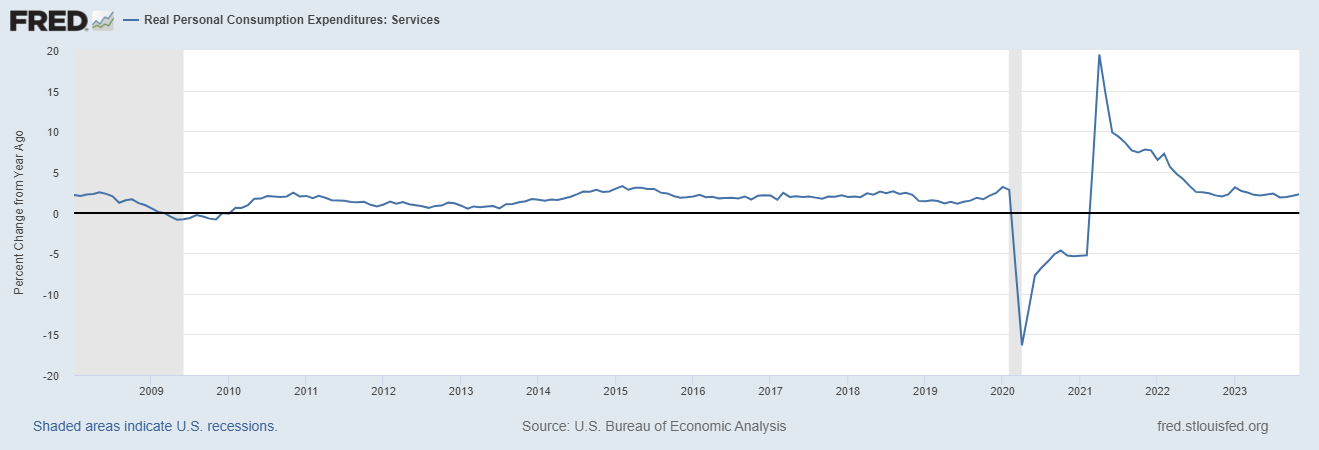
What do those readings tell us? I think they tell us that manufacturing has been in a recession for about the last 18 months. The economy as a whole has not because other areas of the economy have continued to expand and that is what makes this economic period unique – the imbalance between goods and services. There are a number of factors at work here, with some of the problem rooted in the supply chain issues that led to an inventory overhang and also the lockdowns that severely limited the purchase of services during the first part of COVID. The year-over-year change in real goods consumption (adjusted for inflation) was only negative for one month at the beginning of COVID (April ’20) and turned positive in May ’20. The year-over-year change in real services consumption turned negative in March of 2020 and didn’t turn positive until a year later in March of 2021. Goods consumption boomed while services were limited but once people became more comfortable in public, services took the lead and goods fell back. That’s the imbalance created by the shutdowns.
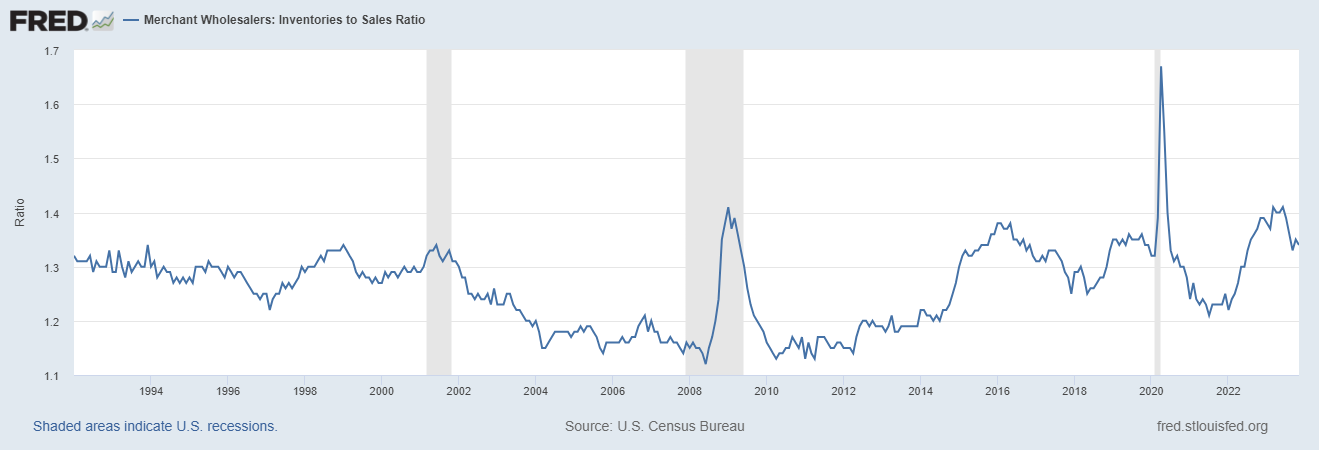
The other part of the imbalance came from the inventory overhang created by the supply chain problems during COVID. Companies took to over-ordering to ensure they had a sufficient supply of goods and even that didn’t work in many cases. You might remember that there were long wait times for some goods – durable goods in particular – during 2021 and into 2022. Then all the over-ordering caught up to manufacturers, wholesalers, and retailers. We all remember the inventory issues at Target and Walmart but inventory issues were more widespread than those headlines. The response was predictable – wholesalers and retailers started running down inventory. The total business inventory-to-sales ratio rose from 1.27 in late 2021 to 1.4 in June of last year even as sales continued to rise and inventories stagnated. Total business inventories peaked early last year and haven’t risen since (and that’s not adjusted for inflation). Wholesale inventories peaked in November of 2022 and are down 3% since then. And again, that isn’t adjusted for inflation so the actual inventory of physical goods has fallen more than that because prices have risen.
The wholesale inventory/sales ratio also rose throughout 2022 and into early 2023 and peaked in March of last year at 1.41 from a low of 1.22 in January of 2022. But the ratio has fallen since and now stands at 1.34.
The retailers’ inventory/sales ratio (excluding motor vehicles and parts where inventories are still low and being rebuilt) peaked in August of 2022 at 1.22 and has since fallen to 1.16, well below the pre-COVID norm:
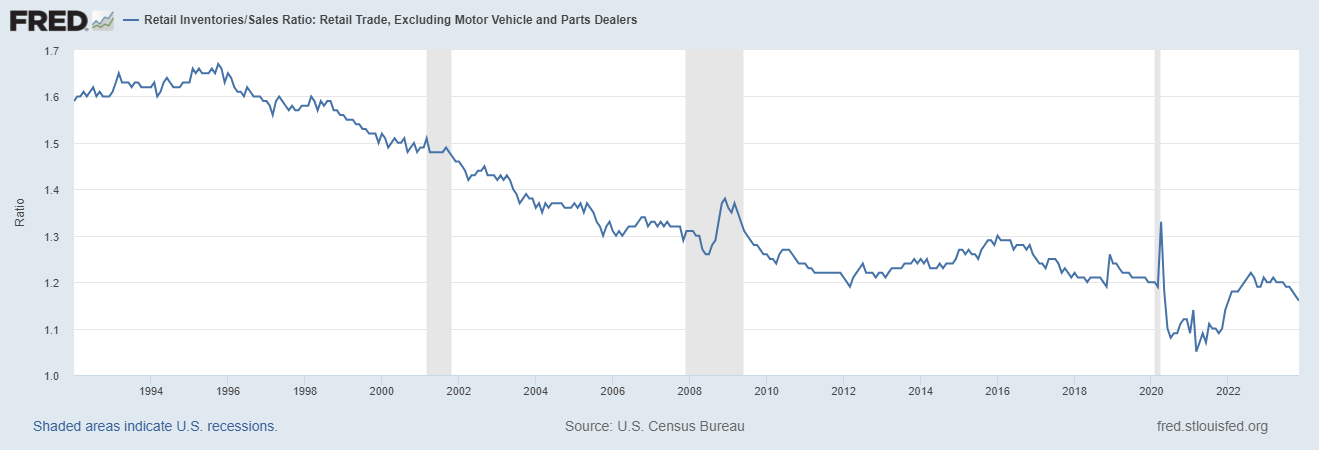
The point is that with inventories, especially at the retail level, now falling relative to sales, the manufacturing recession may be on its last legs. If sales continue to rise at the current pace – and there is no indication that they won’t – production will need to rise to replenish store shelves. The year-over-year change in real goods consumption is actually accelerating:
And services consumption continues to expand at a steady pace:
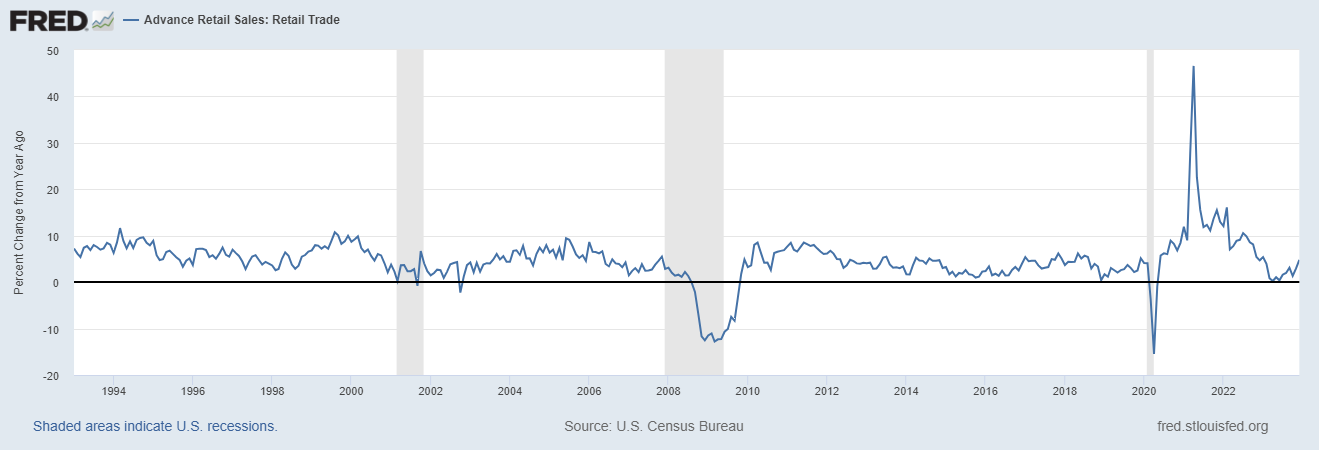
Real retail sales are also accelerating after tuning negative last year:
We don’t think we’re in recession right now – although anything is possible I suppose – and if manufacturing is on the cusp of recovering from its own private recession, what are the prospects that the recession everyone is waiting on will be further delayed? Unemployment is still below 4% and jobless claims this week were back down to 1960s levels, less than 200k. Real disposable personal income (after tax and adjusted for inflation) is up 4.3% over the last year (although that data is only through November), the savings rate is improving, auto sales are up 7.4% over the last year, the inflation rate is falling, construction spending is up 11.3% in the last year, housing starts and building permits are up 7.6% and 6.1%, new home sales are up 1.4% and homebuilder confidence is rising. Crude oil prices are down 9% and gasoline 16% over the last year. Natural gas prices are down 31%. Wheat prices are down 19% and corn is down 34%. In short, what’s not to like, especially if manufacturing turns up?
Can we sound the all clear? Unfortunately, the answer to that is no, and for good reason. All those economic stats only tell us about the past and to some degree the present. They don’t tell us how things will be in the future and contrary to what you’ve heard, there aren’t any good indicators we can point to that give us a definitive heads up. The yield curve inverting seems like a good indicator but its track record outside the US isn’t all that impressive and the long and variable lead time means it isn’t all that useful for investors. Credit spreads can give you advance warning when they start to widen but there are also a lot of false signals (spreads are currently near the lows of this cycle and last, by the way). And now we know too that manufacturing surveys don’t tell us much about the overall economy even if they are pretty accurate about one part of it. You might think that interest rates will fall before the recession but I can find you instances in the past when that didn’t happen. Consumer sentiment isn’t any help (although it is rising right now). And the leading economic indicators are manufacturing-centric and haven’t worked this cycle either.
Do we just give up and hope for the best? Well, no. But you can’t rely on one thing like the yield curve or manufacturing surveys to get a sense of where the economy is. You have to look at a wide variety of data and indicators and look for agreement about the state of the economy. Right now we have a lot of data and indicators that are positive, many of which are actually improving, and just a few that are negative. It’s also important though to understand that much of the economic data we see on a monthly basis is not predictive. Consumption, for instance, usually doesn’t fall until after the recession starts. New jobless claims don’t usually rise significantly until after the recession starts and the same is true of the unemployment rate. And yes I’m aware of the Sahm rule that says if the 3-month average of the unemployment rate rises 0.5% the recession has started, but there are plenty of instances where the indicator only rose that much after the start of the recession; it didn’t give any warning (’73, ’80, ’90, ’01, ’07, ’20).
Market timing based on macroeconomic variables is a fool’s errand. Economists, who spend all their time trying to predict economic growth and inflation, aren’t very good at it. It shouldn’t be a surprise that laymen are no better. There are market-based indicators that can help with tactical changes to your asset allocation but most of them are sentiment-based and subjective. Investing isn’t something that can be reduced to formulas. In general, as Warren Buffet has said, you want to be greedy when everyone else is fearful and fearful when everyone else is greedy. But think about what that means for a second. When are investors most fearful? When the economy is terrible. When are they most greedy? When the economy is terrific. So, you need to sell when things look great – but not too soon – and buy when things look awful – but not too soon. Judging when fear or greed is at an extreme is the art of investing.
Everyone today seems to think they can “hack” the market and find that magic bullet that will allow them to make high returns without risk. No, you can’t. Magic bullets don’t exist.
By the way, the S&P 500 made a new all-time high last week so fear isn’t the dominant emotion in the market right now. But are investors being too greedy right now?
Joe Calhoun
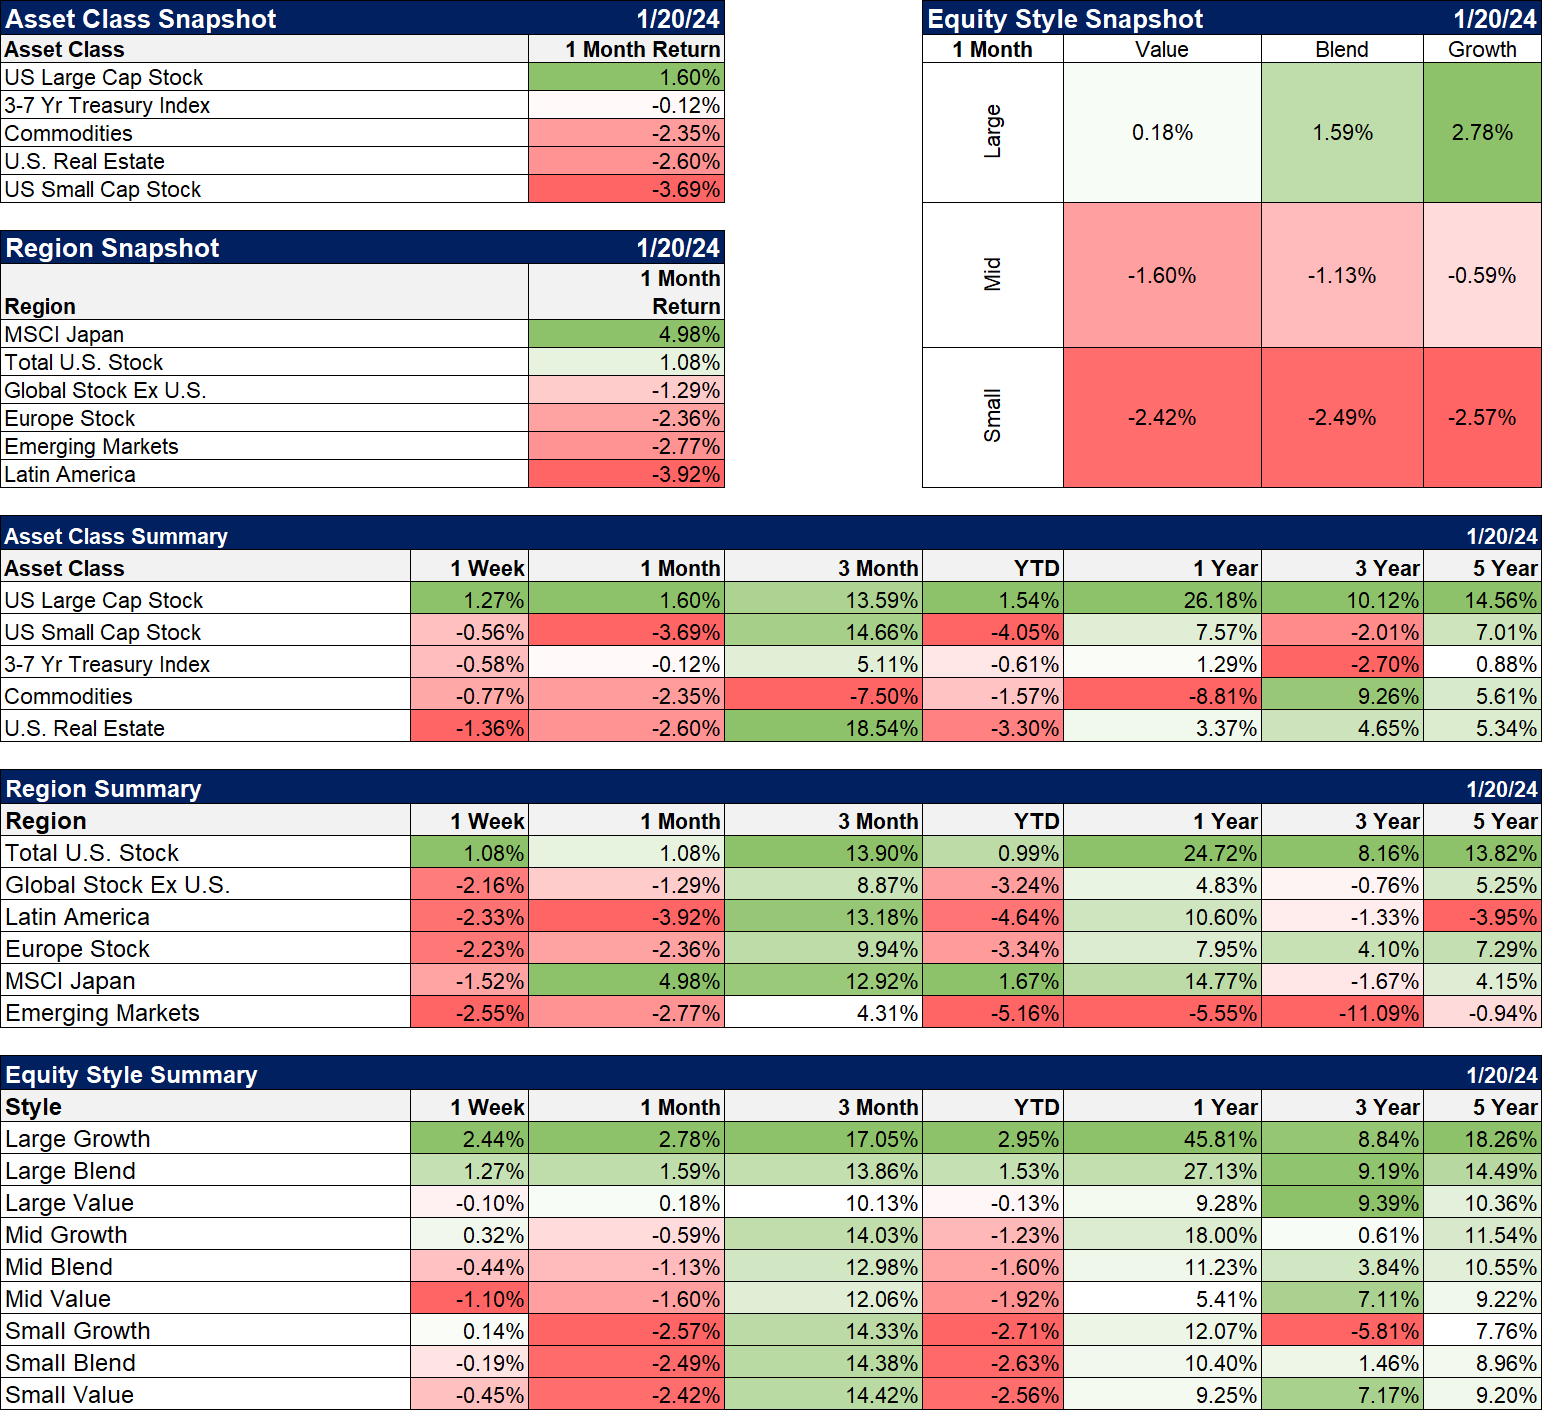
Environment
Markets
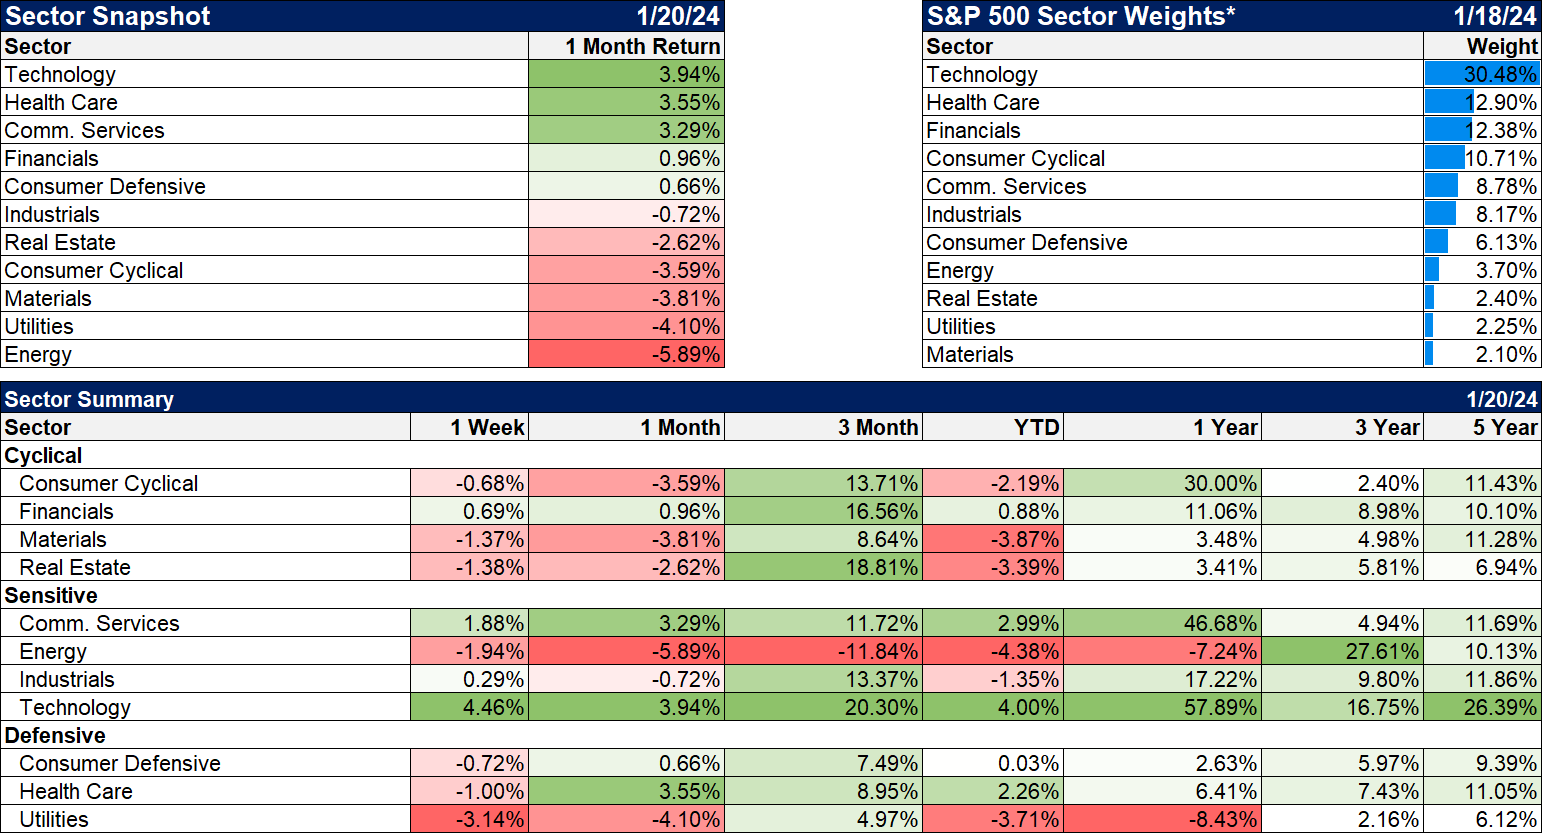
Sectors
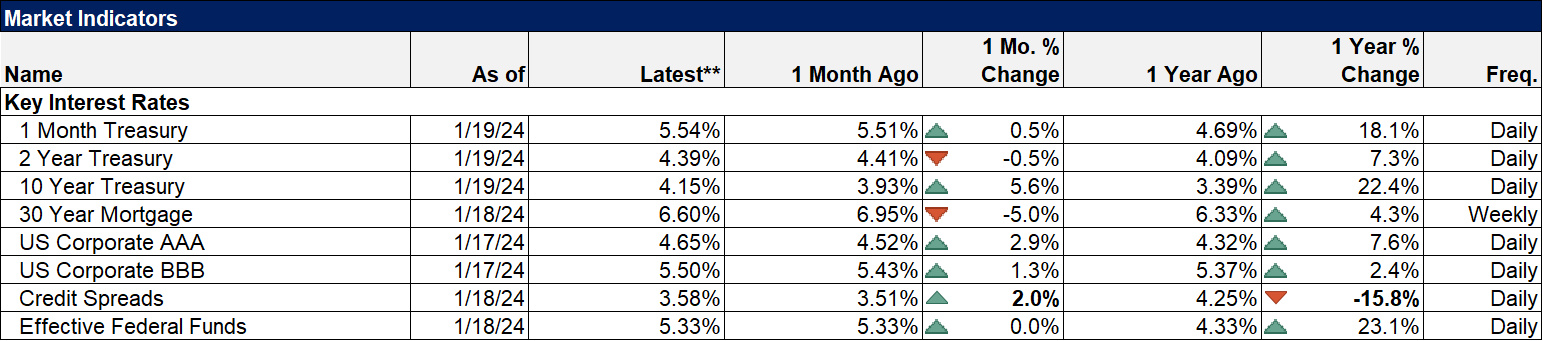
Market Economic Indicators
Stay In Touch