
At the beginning of the year, the market was pricing in fairly high odds of as many as 5 interest rate cuts by the Fed this year, the first one coming in March. Now, just a month later, March appears to be off the table with the odds of a cut down to just 23.5% today. May still shows a 55.1% chance of a cut of 0.25% to 5 – 5.25% and June shows a 52.4% chance of another 0.25% cut. The rest of the year shows chances of further cuts at less than 50% and the end of the year shows the highest odds (38%) that rates will be down to 4 – 4.25%. That would still be a total of 5 cuts but the market’s confidence in that path has deteriorated significantly since January. Why? Well, the Fed has certainly done their best to knock down the speculation but I think the real reasons are more fundamental.
The post-COVID economy has been a difficult one to navigate because no one has ever experienced anything like it. The services and goods sides of the economy have been out of sync since the onset of COVID. Before the economy was fully re-opened, the goods side of the economy boomed, even as supply chain issues caused shortages and rapidly rising prices. As the economy re-opened with the introduction of vaccines, services started to expand rapidly as goods consumption fell back. The pullback in goods consumption was exacerbated at the manufacturing and wholesale level by a build up of inventories. Many goods were double or triple ordered to make sure stores had sufficient stock and once supply chains healed, all those extra orders were filled. The result was a build up of inventories that filled warehouses. The manufacturing part of the economy had to slow as those inventories were worked down and it did.
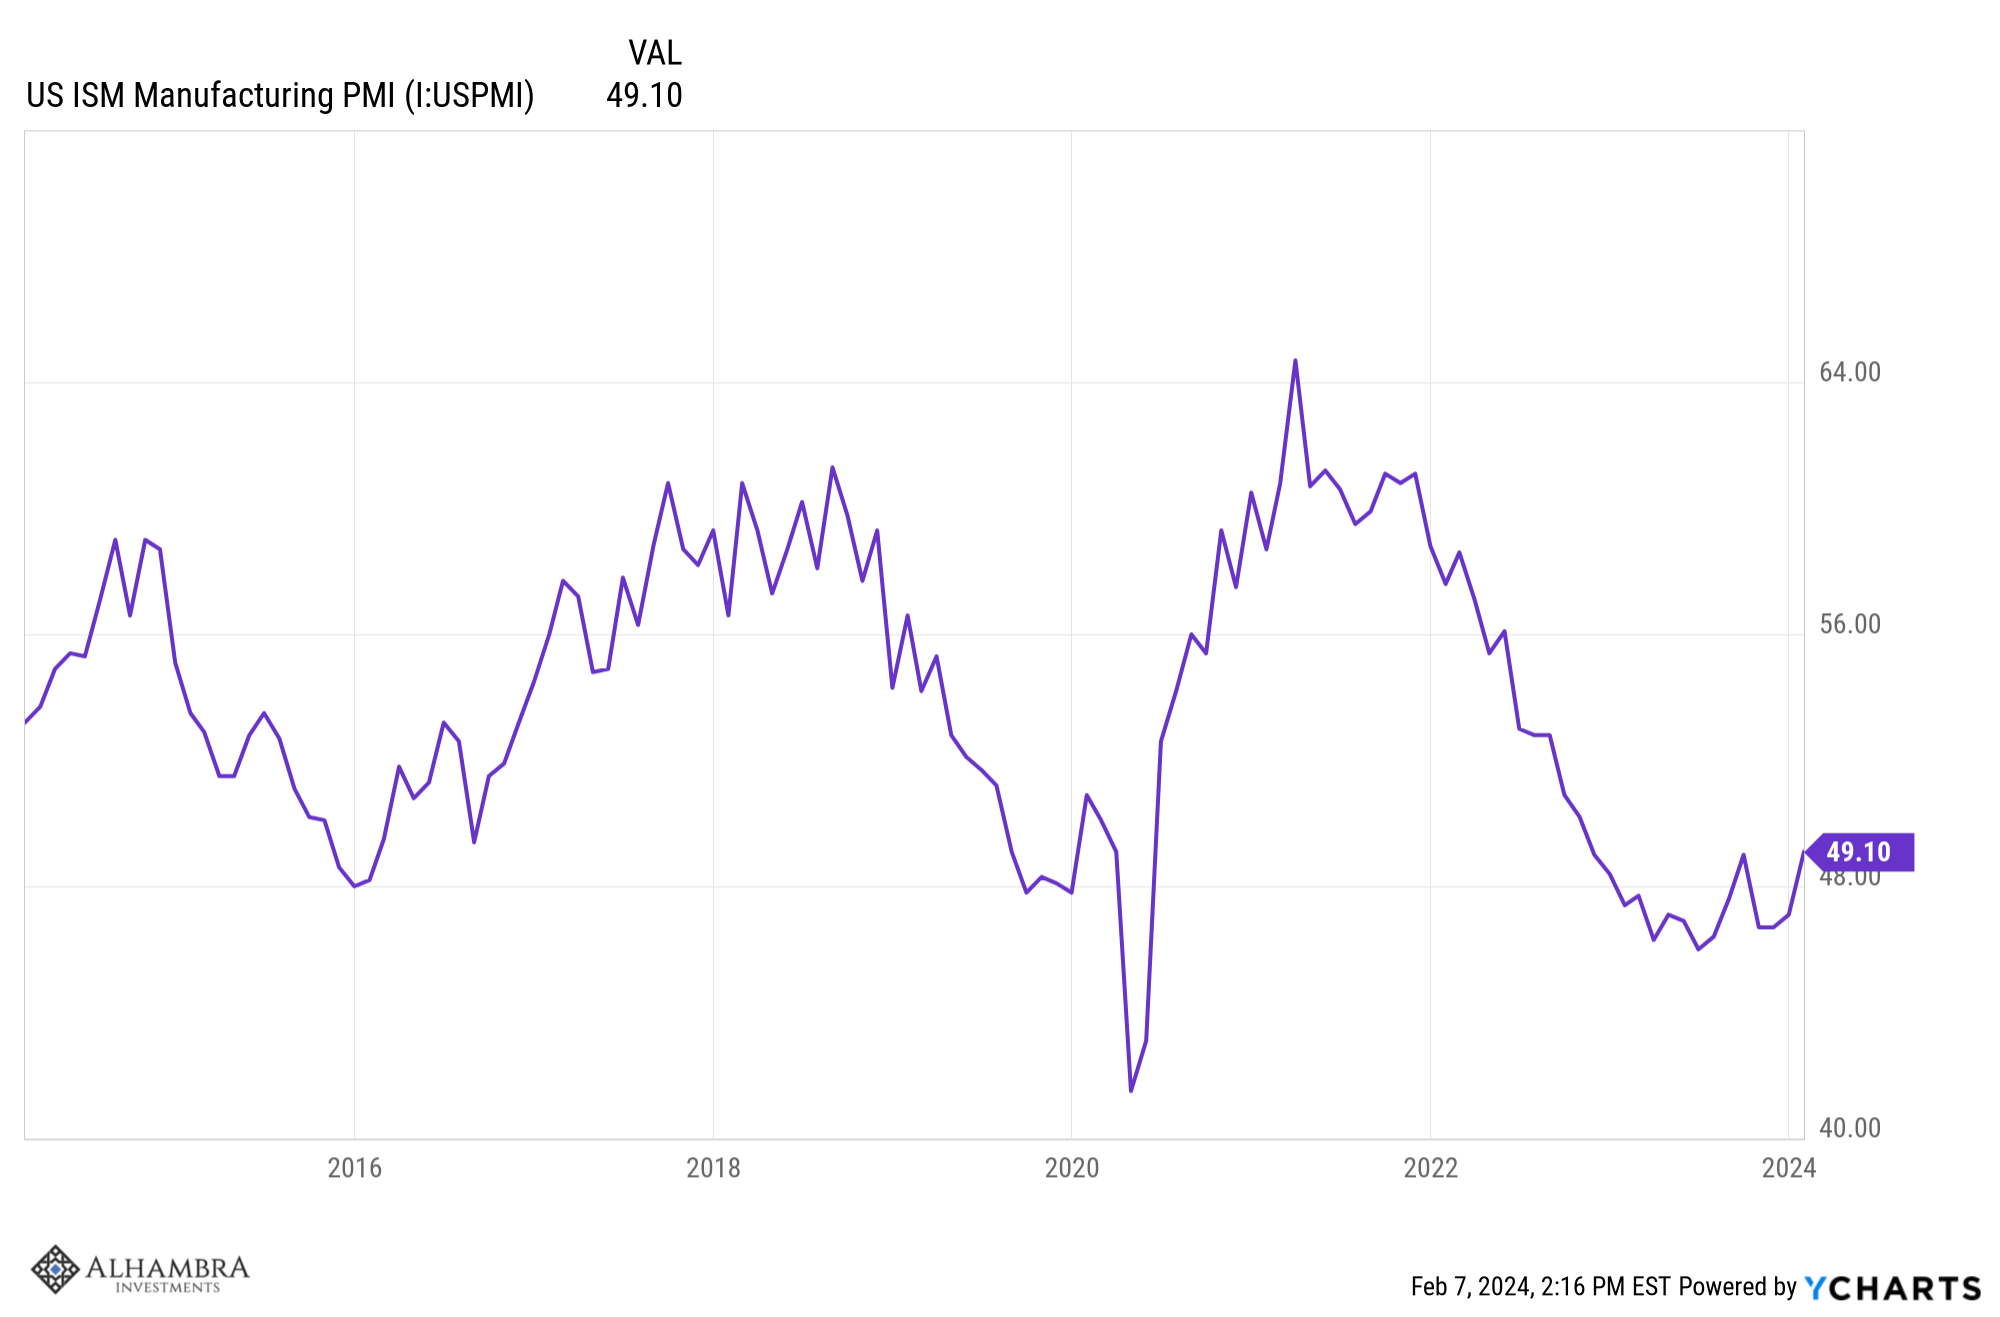
ISM manufacturing and other purchasing manager surveys have looked recessionary for over a year. At the same time, the Fed was hiking rates rapidly and the yield curve inverted, a traditional omen of recession. The overwhelming consensus at the beginning of last year was that recession was inevitable in 2023 which of course turned out to be wrong. The expectations for rate cuts this year was/is based on the same indicators that failed last year. Coming into this year, the ISM manufacturing index had been below 50, indicating contraction, for 14 consecutive months, a condition that had never existed outside recession. The new orders index was even worse, below 50 for 18 of the last 19 months and, again, something that had never happened, outside of recession or otherwise.
The 10 year/2 year Treasury yield curve inverted in July of 2022 and remains inverted today, although not as deeply as its nadir in July of 2023. The 10 year/3 month spread followed in October of 2022 and it seemed that recession was, indeed, inevitable. No such recession materialized because the services side of the economy continued to expand and goods consumption, while not rising as it had earlier, didn’t fall either. From June of 2021 to April of last year, real personal consumption of goods was essentially flat.
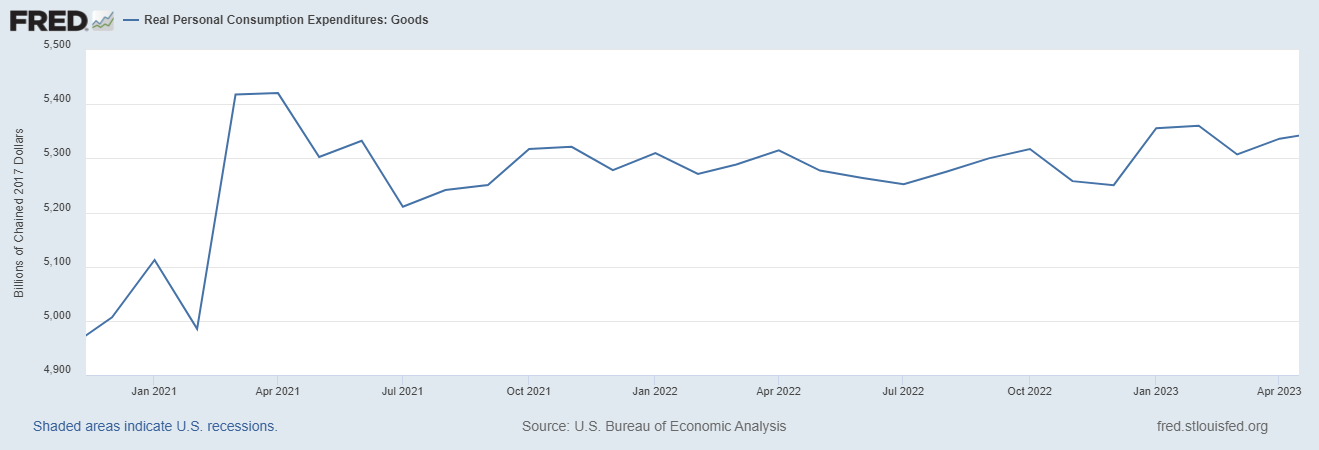
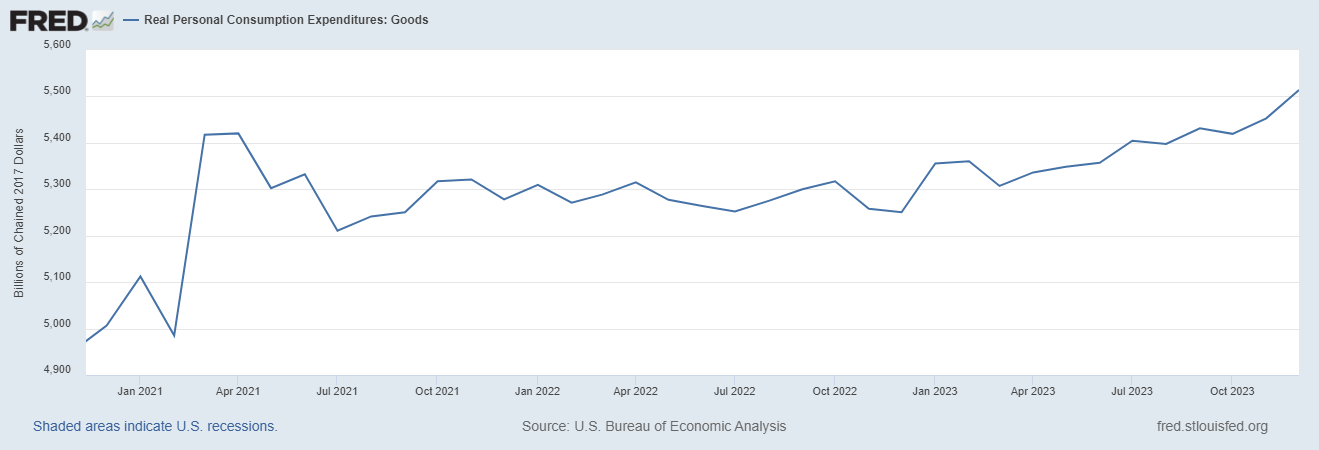
There have been a host of manufacturing based indicators that turned negative in ’22 and stayed there. The Conference Board’s Leading Economic Indicators, which are skewed to manufacturing, have been signaling recession for nearly two years. The S&P Global Manufacturing PMI has been in contraction since late 2022 (with a couple of readings near 50). But recently, we’ve started to see some improvement in these indicators. and I’m not surprised. Why? Because goods consumption resumed its rise months ago and it was only a matter of time before production had to pick up to restock shelves. Here’s what the chart above looks like if you extend it through the end of the year:
What’s improved? The ISM Manufacturing index isn’t above 50 – yet – but it rose to 49.1 in January and, more importantly, the new orders index rose to 52.5. The S&P Global PMI is back above 50 at 50.7 and nearly 3 points above the December reading. That’s the strongest improvement since September of 2022. Even the Leading Economic Indicators have improved; the contraction over the last 6 months was 2.9% versus 4.3% in the previous 6 months.
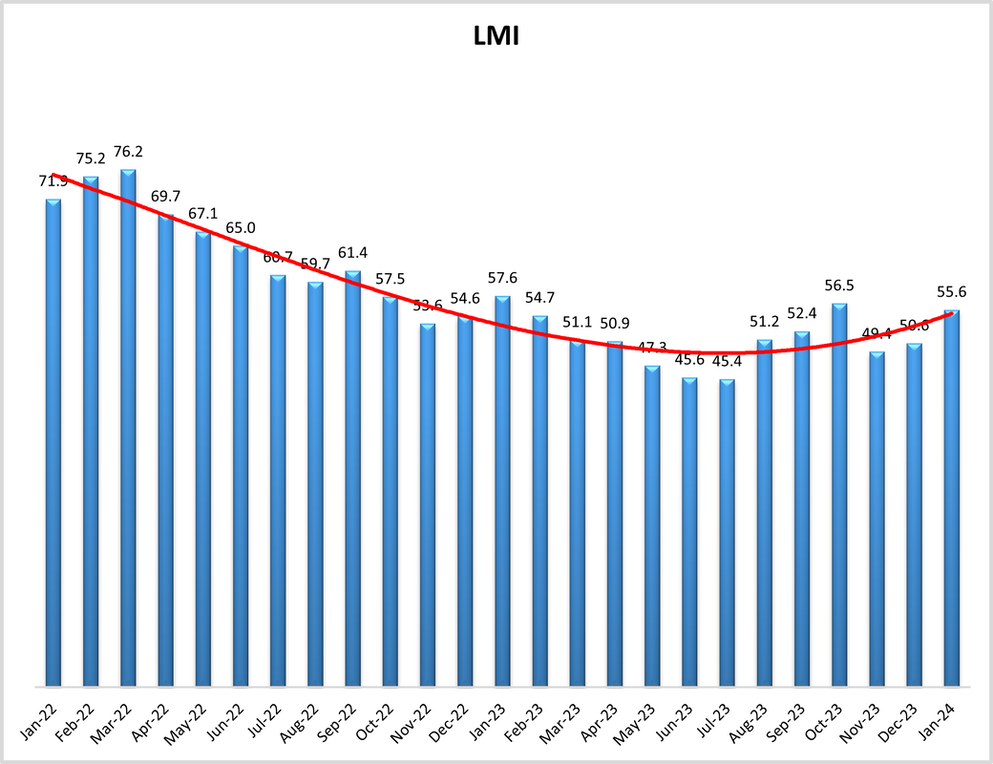
Today the latest piece of evidence arrived in the form of the Logistics Managers Index. If you aren’t familiar with it – and most people aren’t – here’s how they describe the survey on their website:
Logistics Metrics such as transportation, warehousing, and inventory are leading economic indicators, and can point towards potential movements in the overall economy. In our monthly survey, we gather the responses of over 100 professionals on the movement and direction of eight key logistics metrics. These metrics are aggregated into the Logistics Managers’ Index, which is released on the first Tuesday of every month.
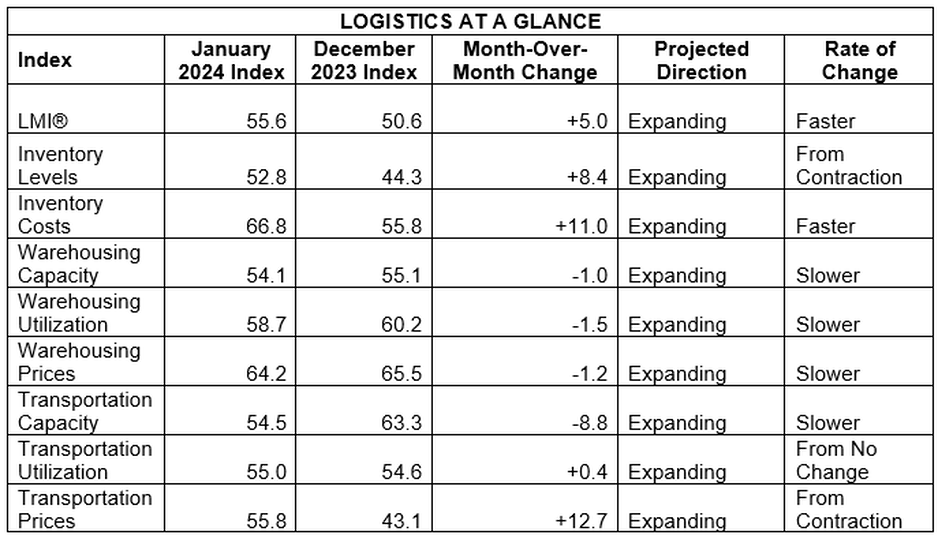
The index rose to 55.6 in January (it’s a diffusion index so above 50 indicates expansion). Five of the last six readings have been above 50 and the index bottomed in July of last year. Highlights from the commentary:
- For the first time since September of 2019 every metric in the Logistics Managers’ Index is reading in expansion territory.
- The most significant move is the long-awaited return of Transportation Prices (+12.7) to expansion, its first appearance on the positive side of the ledger since June of 2022 at the start of the freight recession.
- This growth is driven by an increase in the restocking of inventories – especially for retailers – after a busy holiday season as Americans are clearly feeling better about the overall economy.
- Respondents were asked to predict movement in the overall LMI and individual metrics 12 months from now. The optimism respondents have been reporting on future conditions throughout the second half of 2023 have partially come to fruition in January, but respondents expect even future growth throughout the rest of 2024.Future predictions for the overall index are 62.8 which is up (+3.9) from December’s future prediction of 59.9. This would exceed the all-time index average of 62.4 and would represent a healthy rate of expansion.
There are some differences in the report between upstream (manufacturers) and downstream (retailers). Inventory restocking isn’t aggressive so this isn’t in anticipation of a surge of any kind, just normal restocking in a world that is still mostly “just in time”. But the trend is pretty obvious:
I started writing about a manufacturing revival months ago in my weekly commentaries and now we’re starting to see it show up in the data. Yes, it is survey based and subject to all the normal volatility associated with such indicators. But surveys can be useful anecdotal evidence and are most useful coming out of contractions, as we seem to be currently.
If goods consumption is rising again and manufacturing has seen the worst for this slowdown, what does that say about the economy and the prospect for rate cuts this year? The Fed’s Summary of Economic Projections, released in December, showed a median expectation by FOMC members for 3 rate cuts in 2024. If you’ve been around long enough (I think I’m well past “enough”) you know that’s going to be wrong; the only real question is how. I think most people just assumed it’d be wrong by not expecting enough rate cuts. What if the real surprise is that they’re expecting too many?
Joe Calhoun
Stay In Touch