

How far can this rally go? Should we be locking in some gains?
That’s a paraphrase of questions I’ve been getting from clients recently. It does seem as if the stock market goes up every day and with all the ups and downs of the last few years, it is natural to wonder if we’re about to get another bout of selling. But I wonder if focusing on the S&P 500 (or worse, the NASDAQ) is the right way to look at this.
I’ve written before about how highly valued the S&P 500 is and the rally this year certainly hasn’t made it more attractive. Growth stocks, which dominate the index, are generally expensive but not universally so. The bigger problem with the S&P 500, in my opinion, is that the index is very concentrated in a few stocks with 32% of the index in the top 10 stocks. The S&P 500 Growth index is even more concentrated with 58% in the top 10 stocks. The NASDAQ 100 has 47% in the top 10.
That kind of concentration defeats the purpose of owning a broad-based index – diversification and risk reduction versus owning individual stocks. The fact that the indexes are concentrated, and expensive as you’ll see below, doesn’t mean that all stocks or indexes fit that bill. As a firm, we don’t avoid all growth stocks – even technology stocks – or other, more diversified indexes. Our individual stock portfolios own growth stocks when they fit our investment criteria and we own other large, mid, and small-cap indexes. Our focus is on value but we are certainly willing to own growth stocks when offered at a reasonable price.
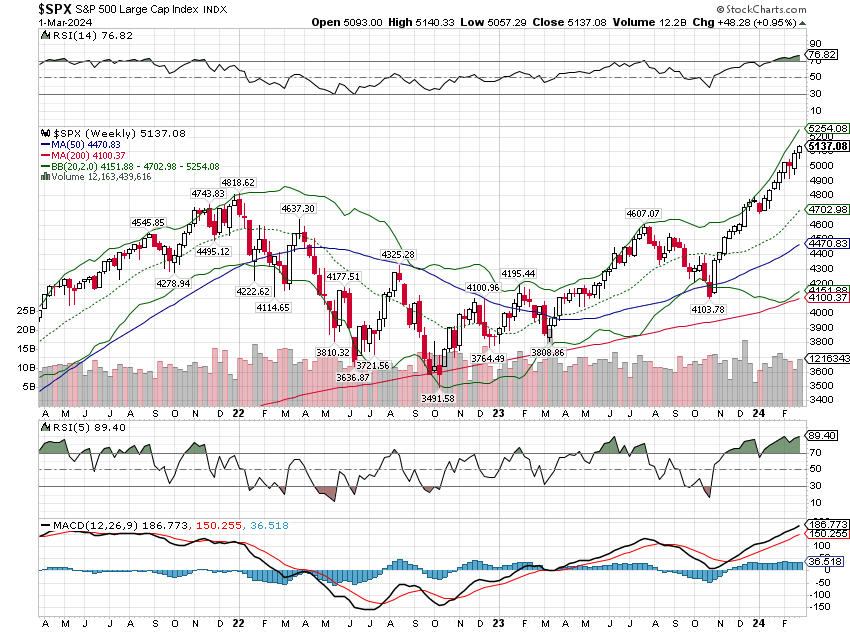
Let’s first look at why traders, with a short-term focus, are concerned that stocks may pull back soon. I certainly understand the fear because stocks are what we in the business call “overbought” which is just insider jargon that means “too far, too fast”. There are a number of ways of determining “overbought” or “oversold” but we tend to use moving averages. We use 50 and 200-week moving averages because they mirror our intermediate to long-term focus. In a bull market, the index will generally stay above the 50-week moving average with the average acting as a magnet; the index will return to the moving average repeatedly during a bull market and then move higher. The 200-week moving average only comes into play during larger corrections and the index generally only falls below it during a bear market (a 20% drop).
The S&P 500 index is currently about 14% above its 50-week moving average and 20% above its 200-week moving average. That’s what has traders concerned right now about a pullback; a rapid return to just the 50-week moving average would be a painful experience and a drop to the 200-week is a bear market. Of course, the index doesn’t have to fall for it to meet its 50-week; it could just go nowhere for a while as the moving average catches up to the index.
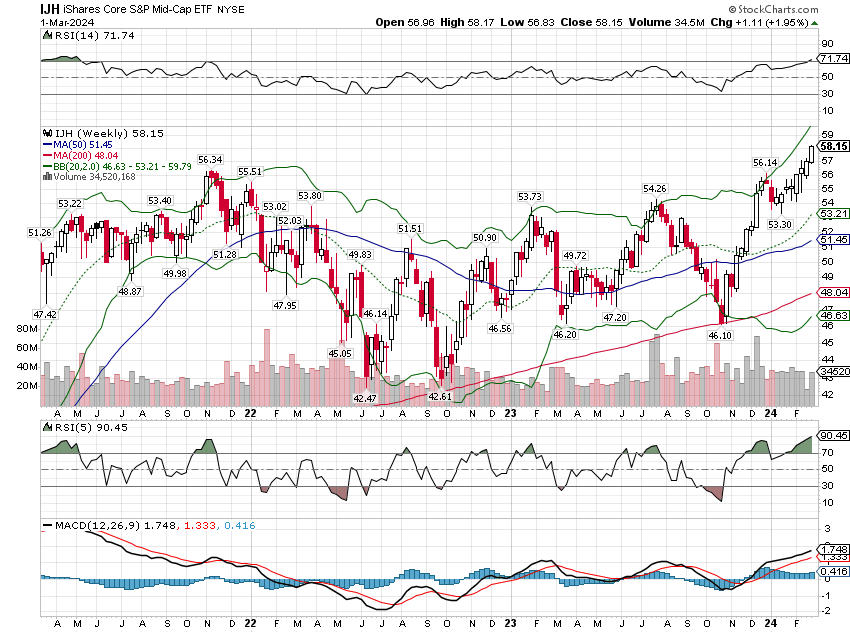
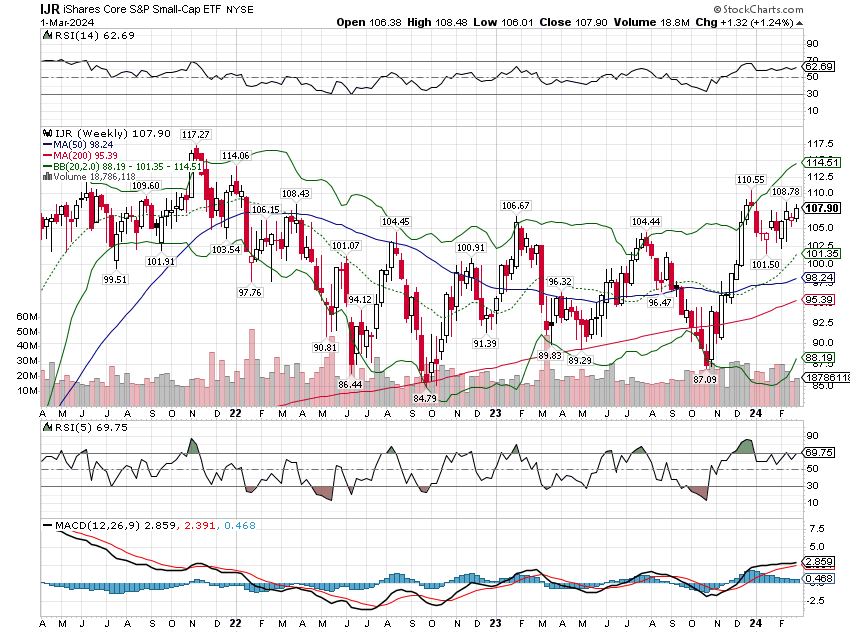
It isn’t just the S&P 500 that is overbought right now, although it is the most overbought. The mid and small-cap indexes are also overbought with the S&P 400 (mid-sized companies) 11.5% above its 50-week moving average and 17% above its 200-week. The S&P 600 (small companies) is 9% above its 50-week and 11.5% above its 200-week. Obviously, they aren’t as overbought as the 500:
Corrections happen, even in bull markets, and trying to time them requires two consecutive accurate predictions. First, one must predict when the index has hit its top and second, one must predict when it has hit bottom. Most people overestimate their ability to do either, much less both. In addition, if you are investing in a taxable account, one must also overcome the tax liability of realizing a capital gain which in this case is almost surely short-term and taxed at your regular rate. That isn’t an insignificant hurdle.
Of more interest to investors – vs traders – are the fundamentals of the indexes. Is there a fundamental reason to expect stocks to correct? What about a macroeconomic reason? Are we on the verge of recession? More inflation? More rate hikes? Rate cuts?
Let’s look first at some basic fundamentals. We evaluate stocks based on a fair value model using corporate bond yields. For large and mid-cap stocks, we use the BBB corporate bond yield which is about average for the S&P 500 and 400 together. For small-cap indexes, we use the BB (junk) corporate bond yield*. At the end of 2023 the S&P 500 was modestly overvalued but with interest rates and stock prices up since then, the overvaluation has widened to 20%.

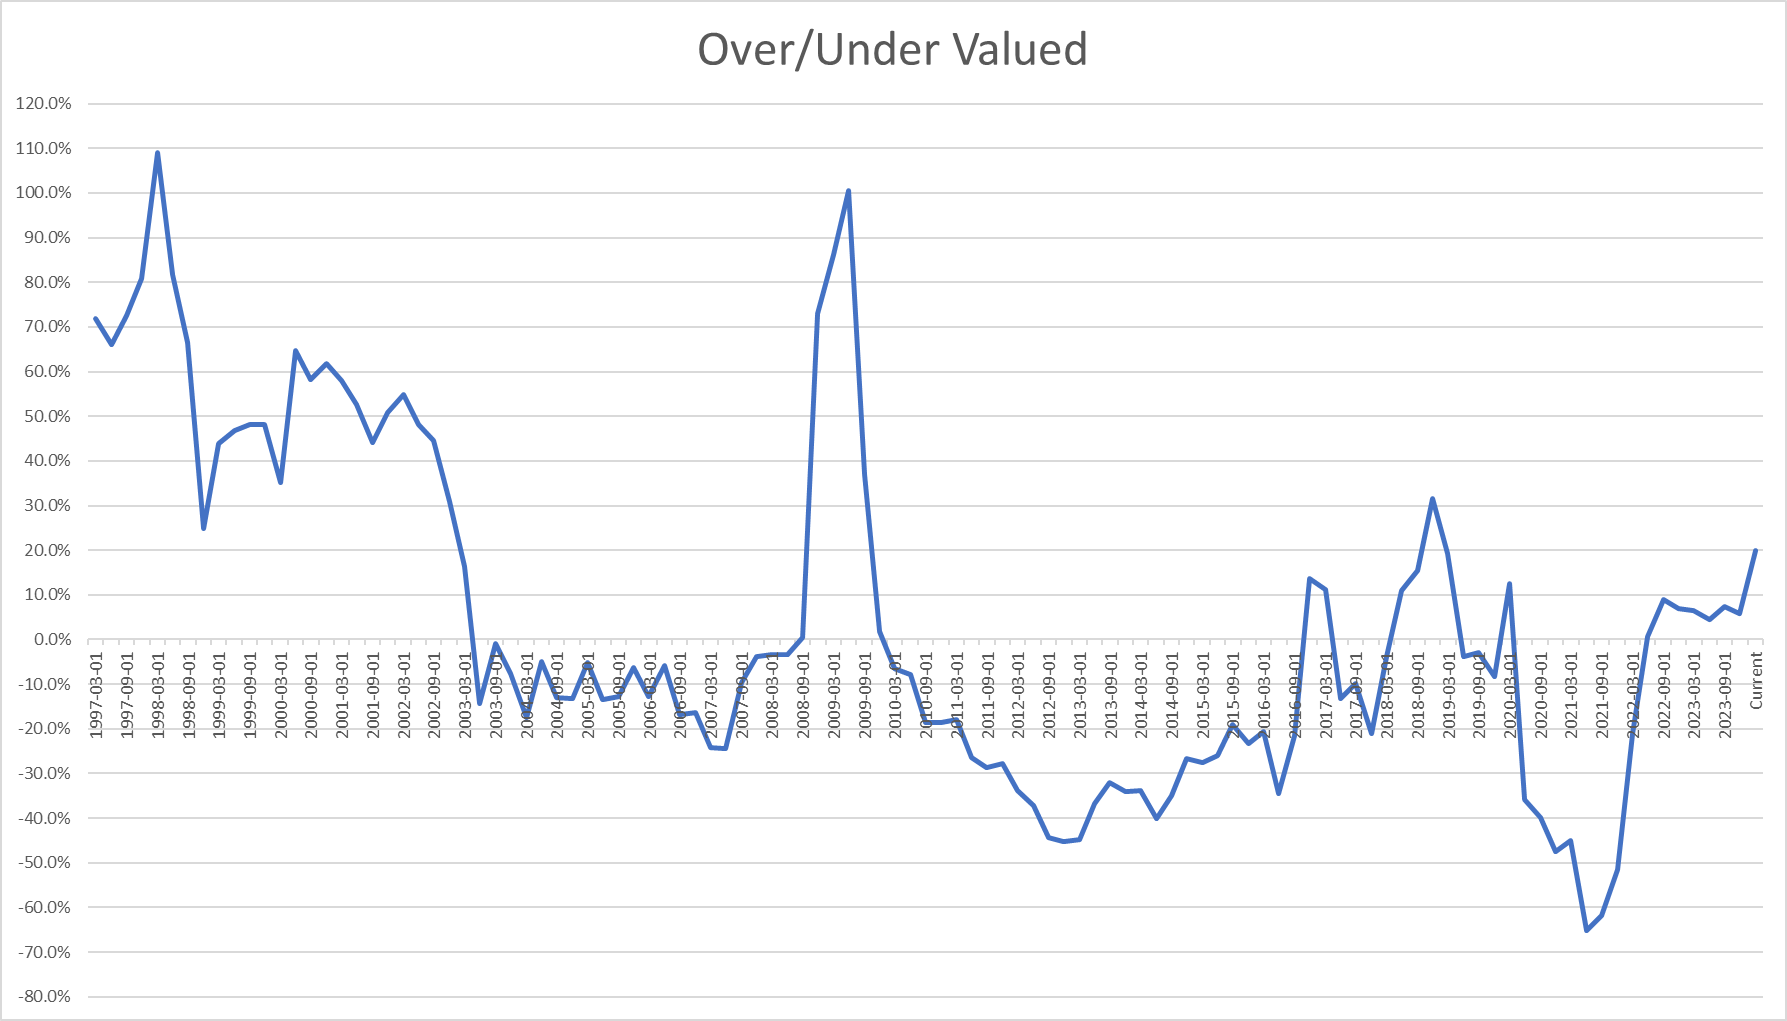
By contrast, the mid and small-cap indexes are both currently undervalued:
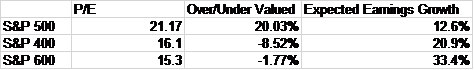
Also of utmost importance, is the expected earnings growth over the next year. The S&P 500 index is the most highly valued but also has the lowest expected earnings growth while the mid and small-cap indexes are undervalued with earnings expected to rise much more significantly. When I said above that we are willing to buy growth when it is offered at a reasonable price, that’s what I mean. In general, we want to buy stocks or indexes with P/Es equal to or lower than their expected earnings growth.
One complicating factor is that we use forward earnings estimates for our fair value calculation and we have no idea if those expectations will be realized. The S&P 500 could experience higher-than-expected earnings growth and therefore not be as overvalued as it appears. Indeed, if earnings growth was much higher than expected it could be below fair value (although I don’t think that is likely now). Or earnings growth could be less than expected in which case the index is even more overvalued than it appears today. I think we need to be humble about our ability to judge value objectively and respect the wisdom of crowds embedded in market prices, but current prices for the S&P 500 do seem to be overly exuberant about the future.
Of course, everything that goes into these types of calculations is constantly changing so I wouldn’t recommend looking at an analysis like this on a daily, weekly, or even monthly basis. We tend to update these quarterly and frankly that might be too frequent.
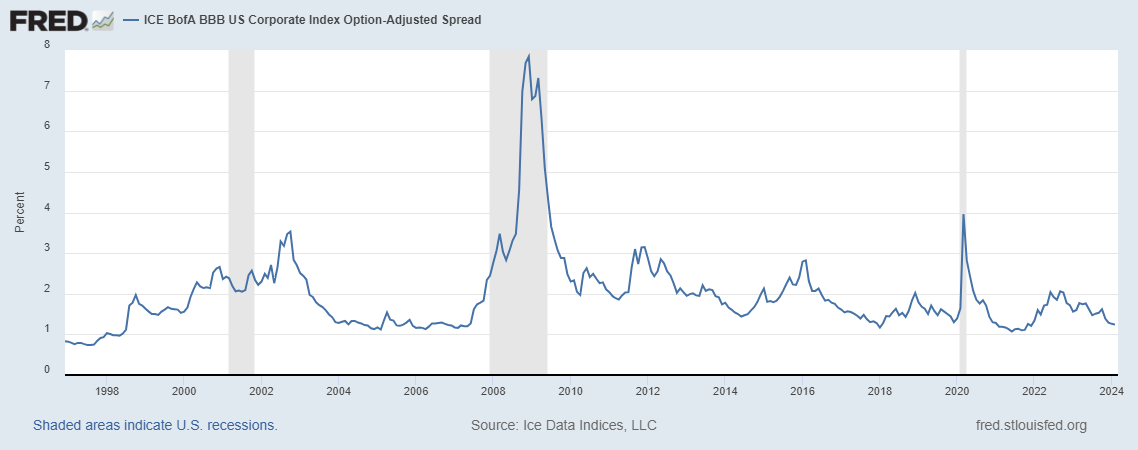
Another way to look at risk appetite is corporate bond spreads. Today, spreads are fairly narrow, indicating that investors are willing to take on risk. The BBB spread is currently 1.24%, near the lows since COVID (1.07% in June of 2021). However, the spread has been lower in the past, falling below 1% in the late 90s:
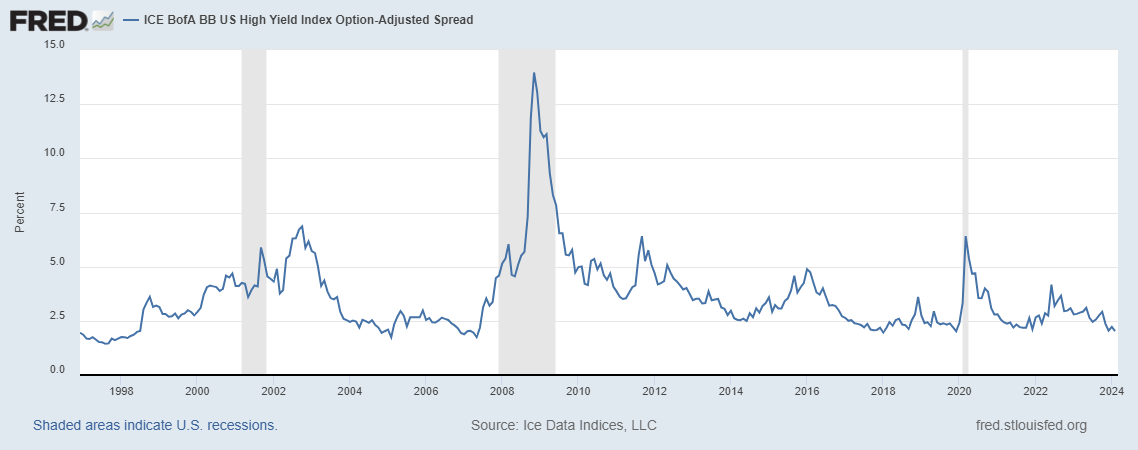
The BB spread is currently 2.03%, the low since COVID. Like the BBB, the BB spread has been lower in the past, well under 2% in the late 90s and the mid-00s (2005):
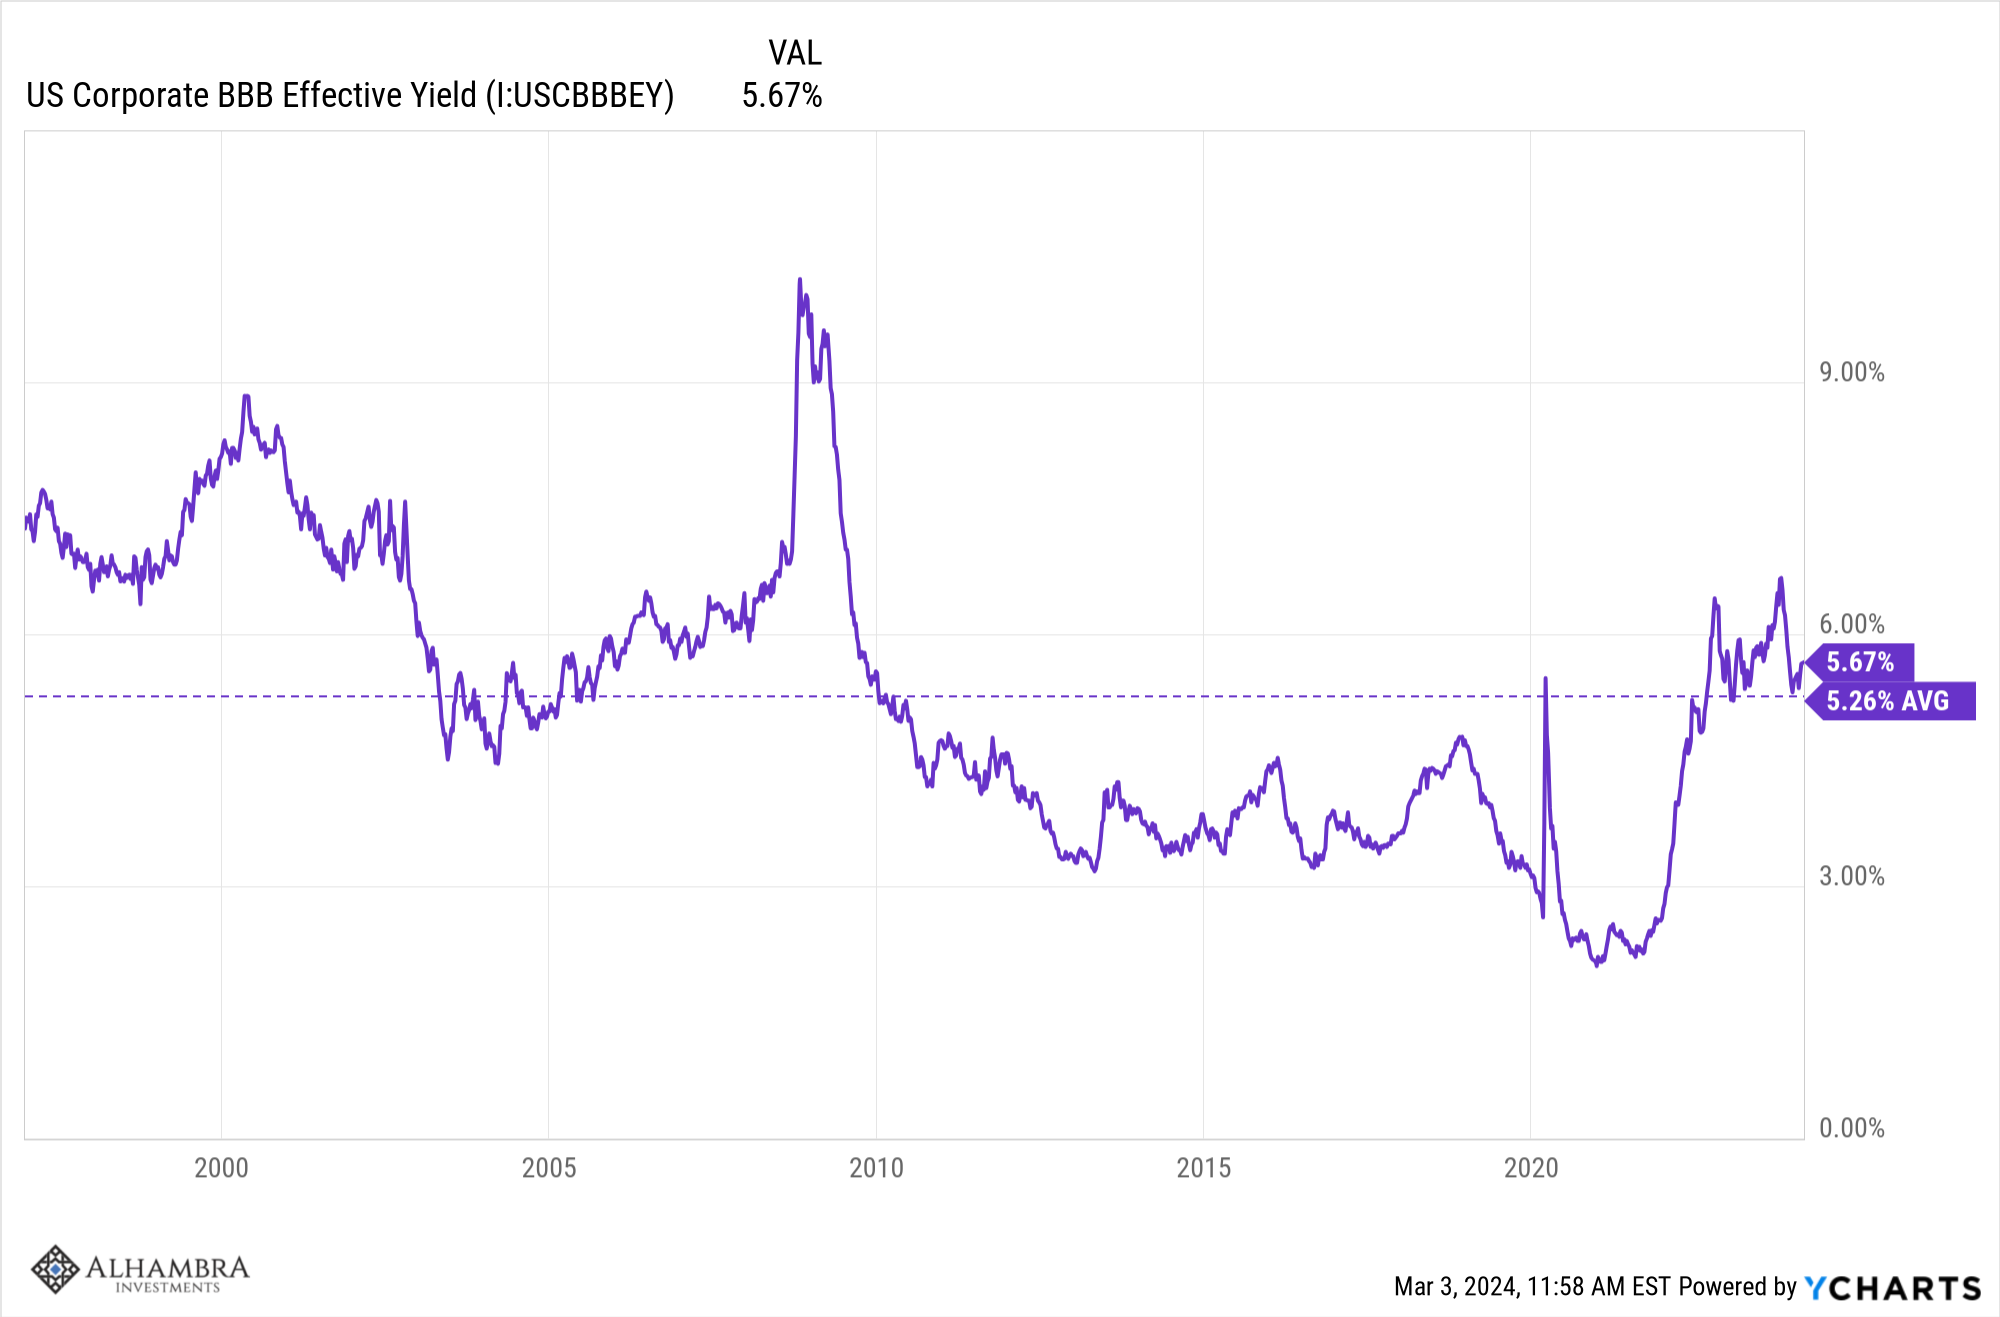
There is obviously a healthy appetite for risk right now but I don’t know that I’d call it extreme just yet. Current bond yields are right around their long-term average. Spreads, as you can see in the chart above, can stay low for years before weakening growth causes bond investors to become more cautious.
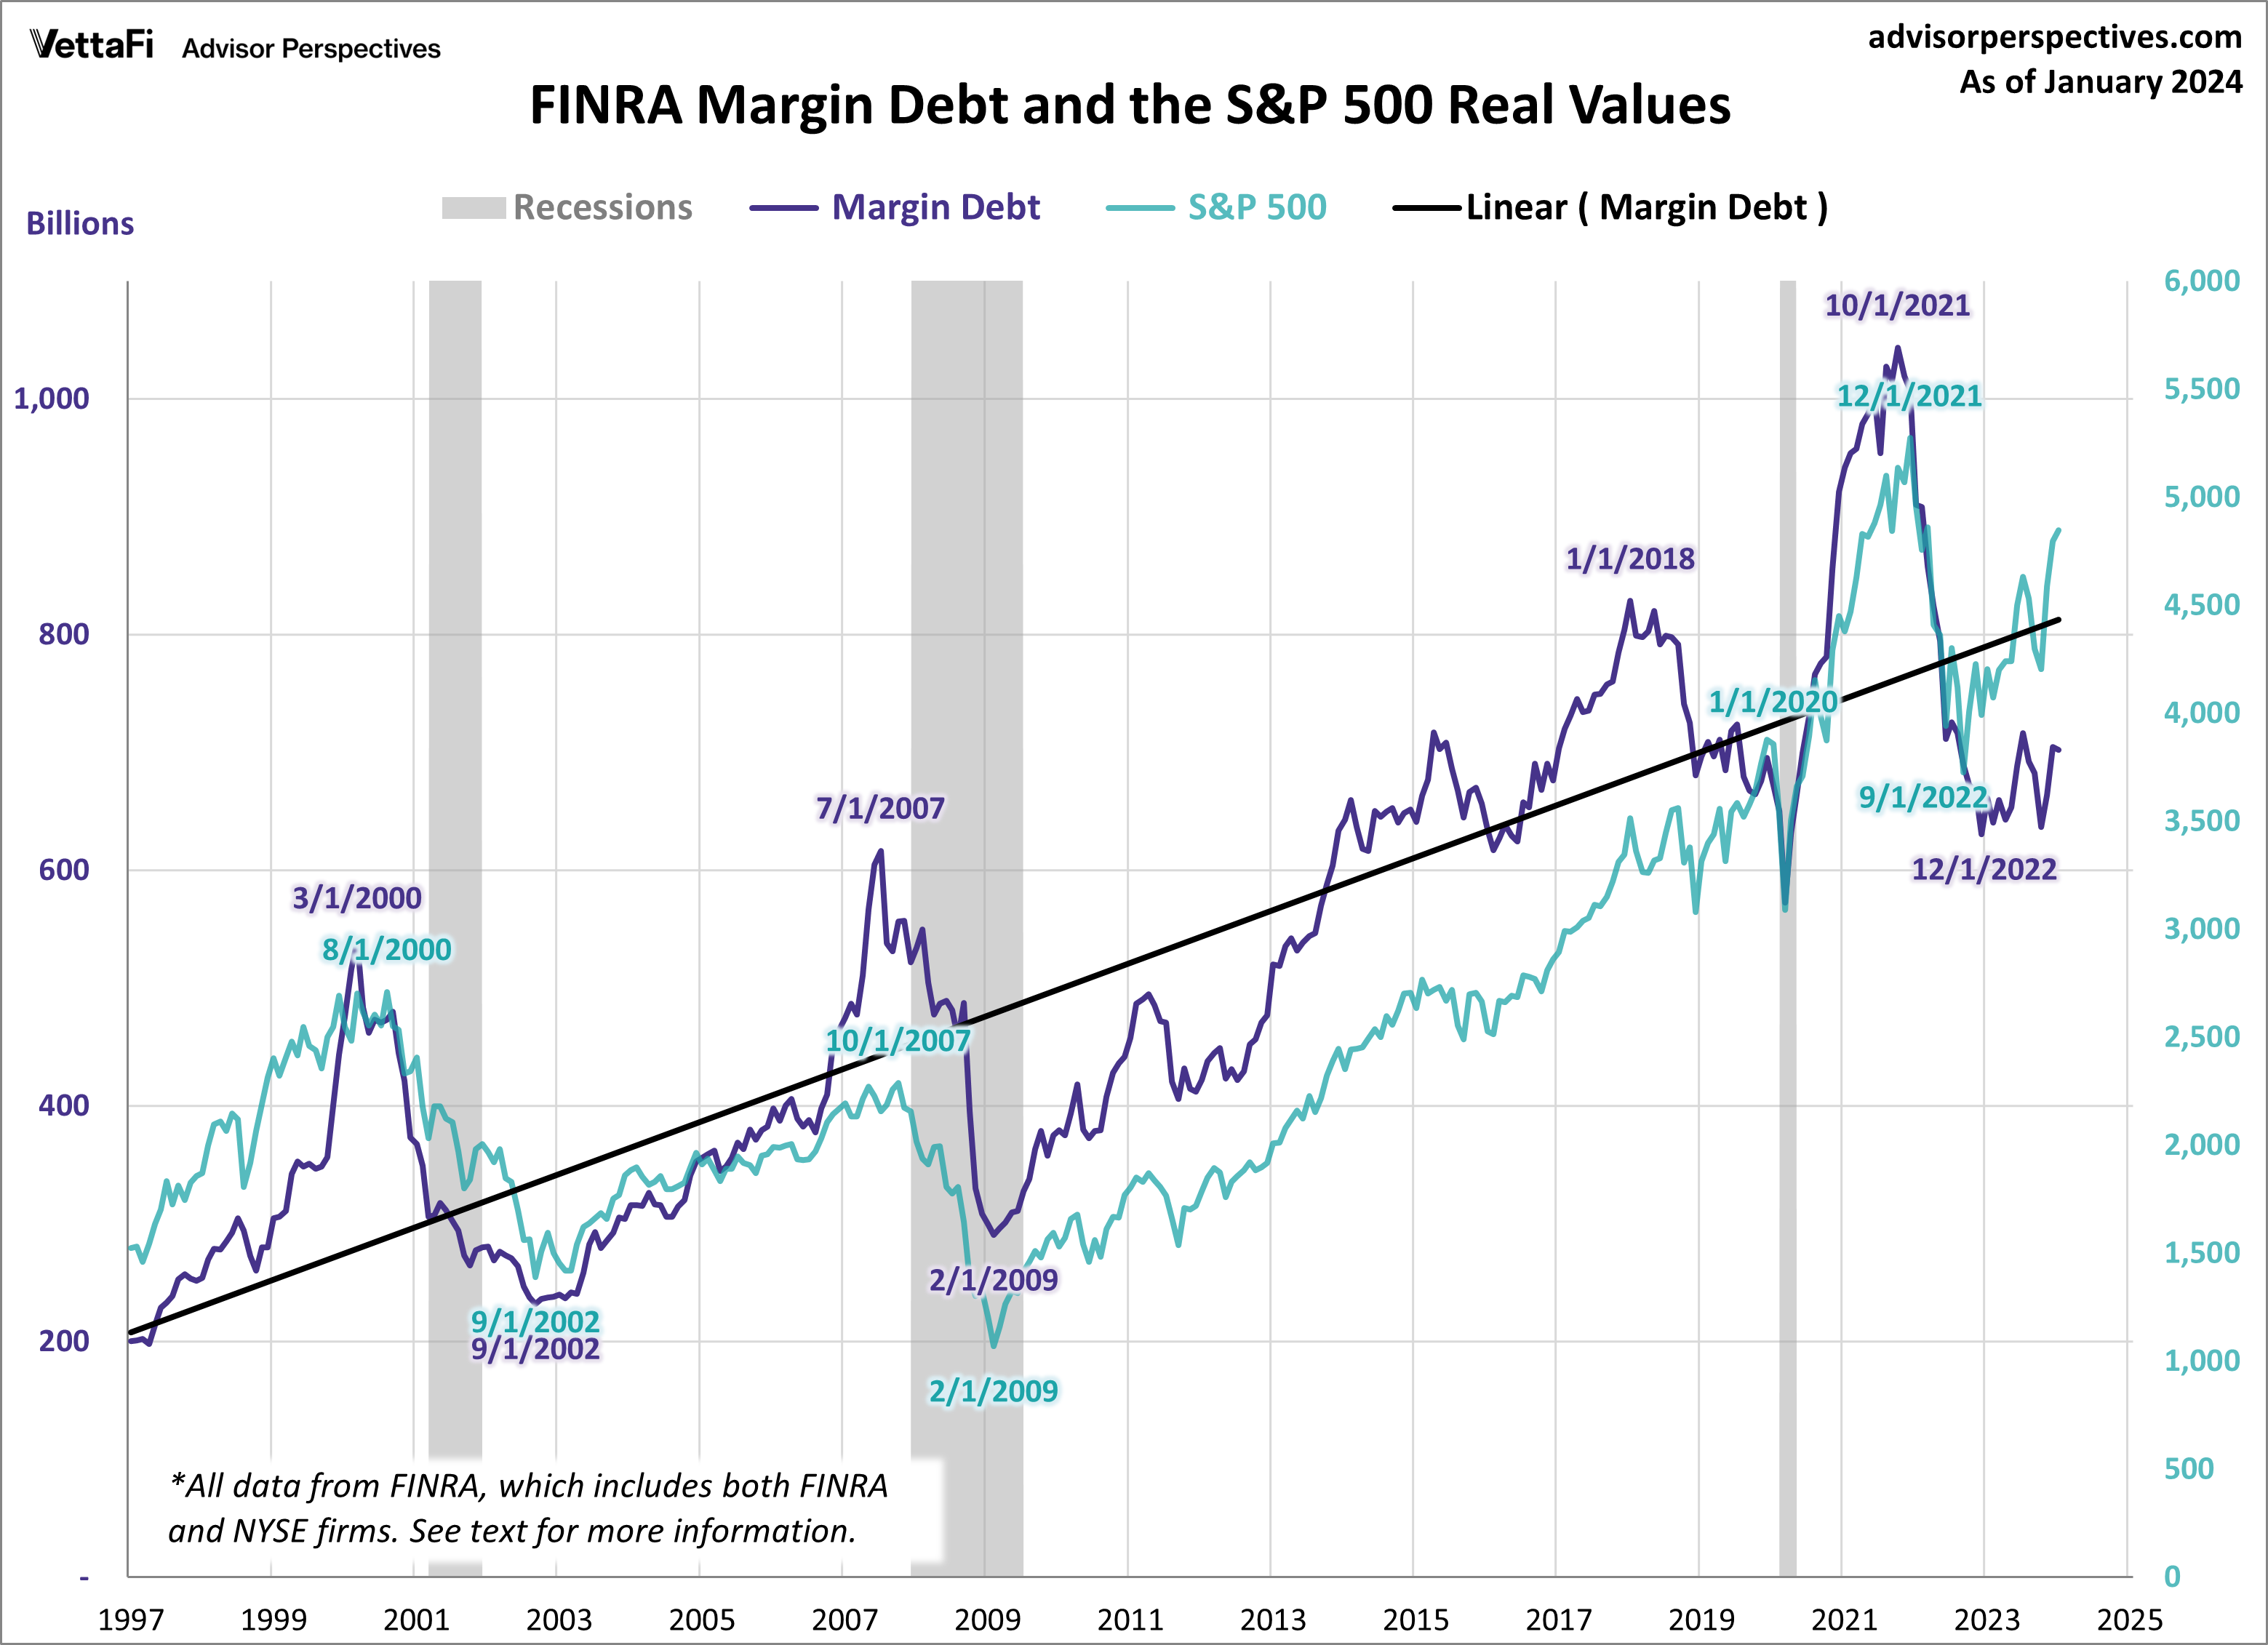
One more way to look at risk appetite is via margin debt. As you can see, we haven’t seen a surge in margin debt – speculation – as we have at other major tops. While that certainly doesn’t rule out some kind of correction, it should give us some confidence that we’re not due for something much worse.
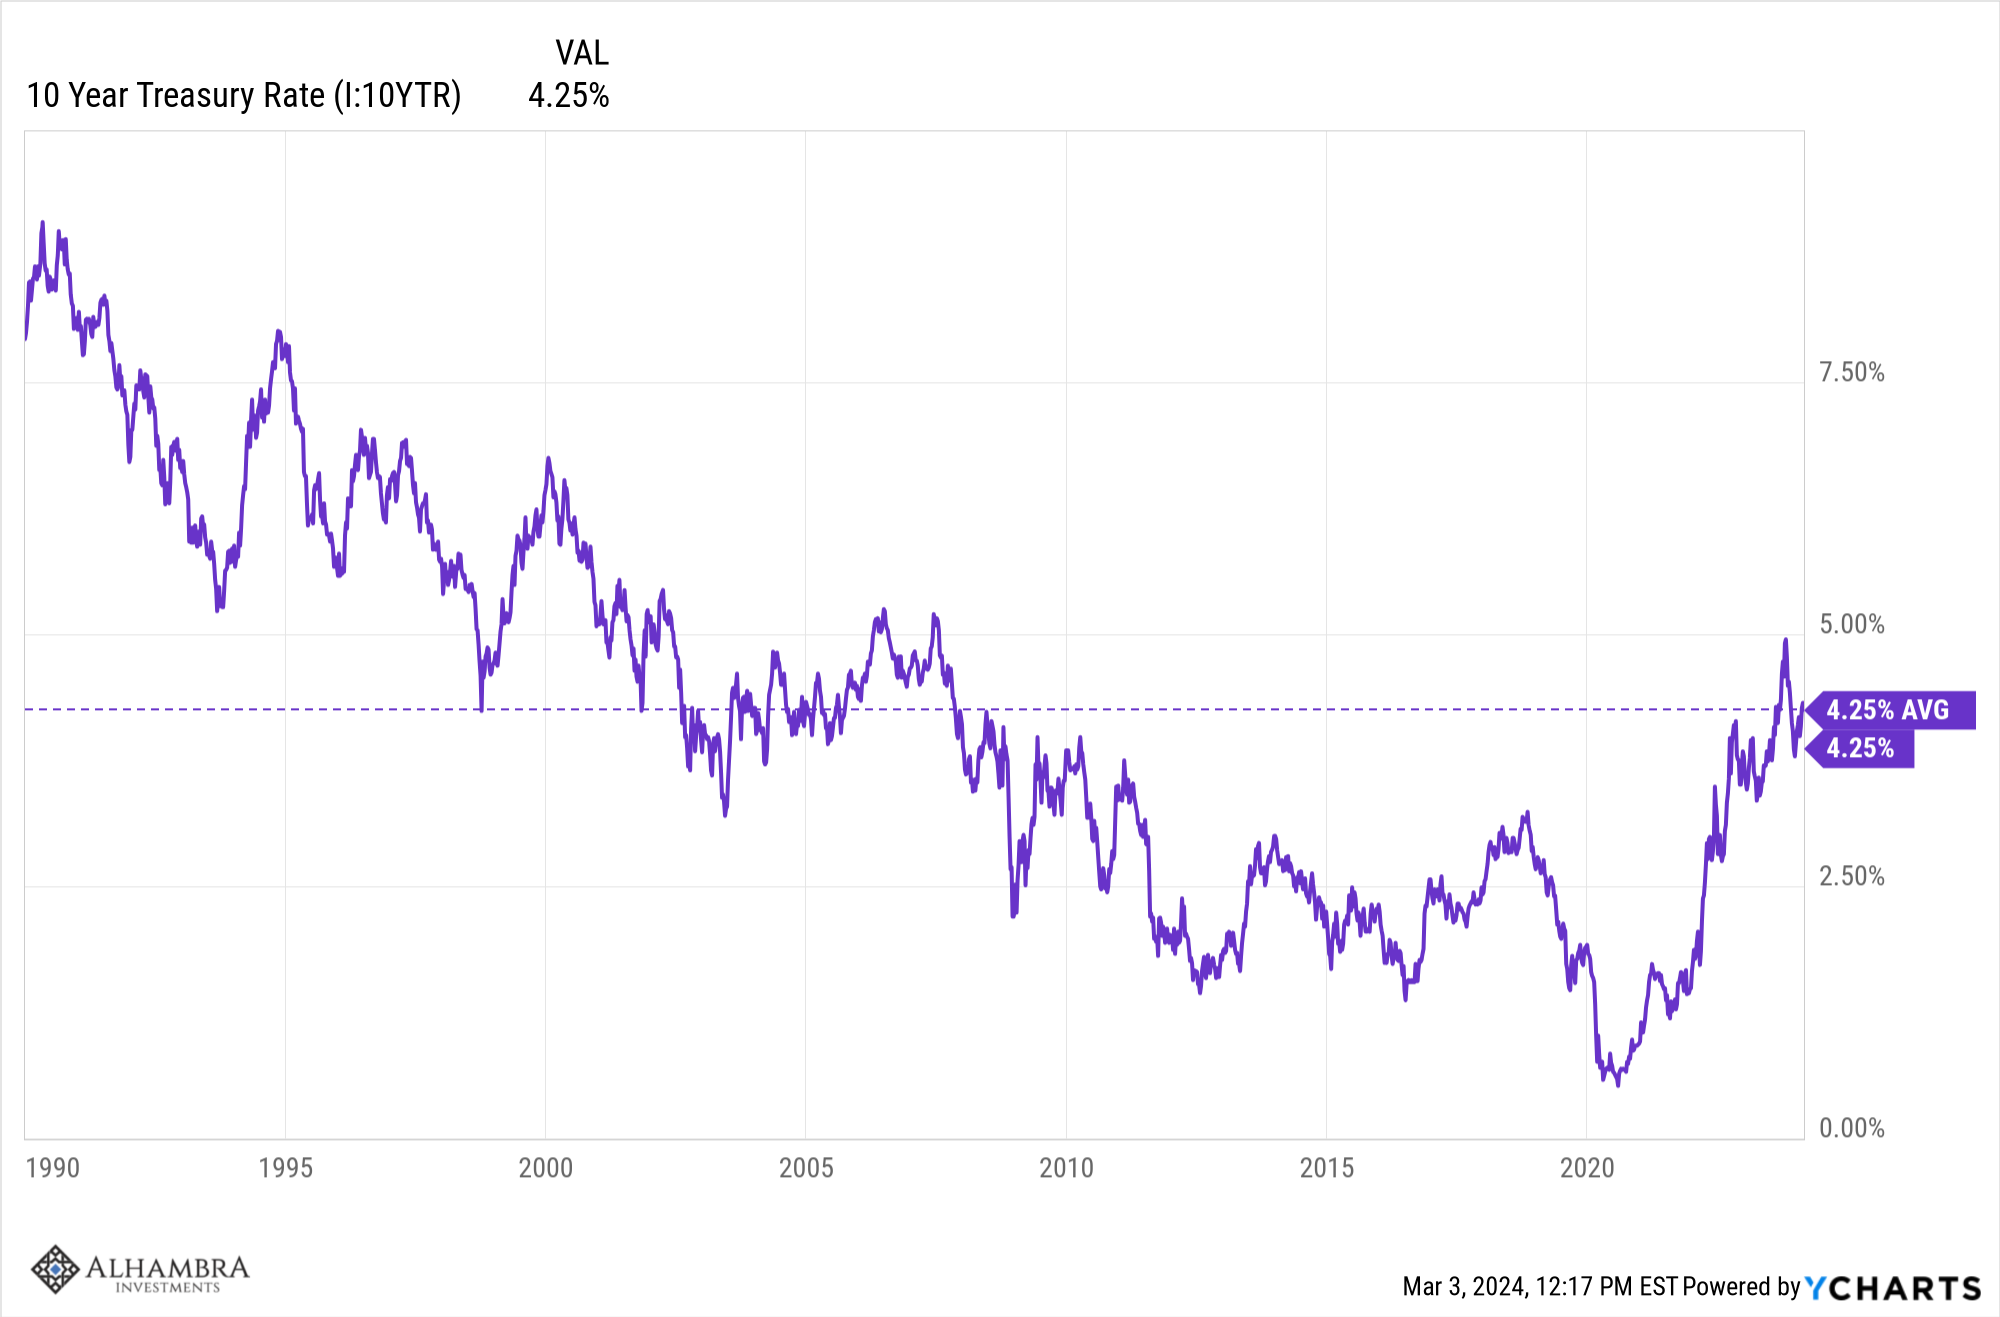
What about the economic environment? Is there some economic reason we should be concerned? The easiest way to look at the economy is through the lens of interest rates and the value of the dollar. As we noted above, corporate bond yields are about average for this century. The 10-year Treasury rate is also average if measured back to 1990 (I don’t have corporate bond data back that far):
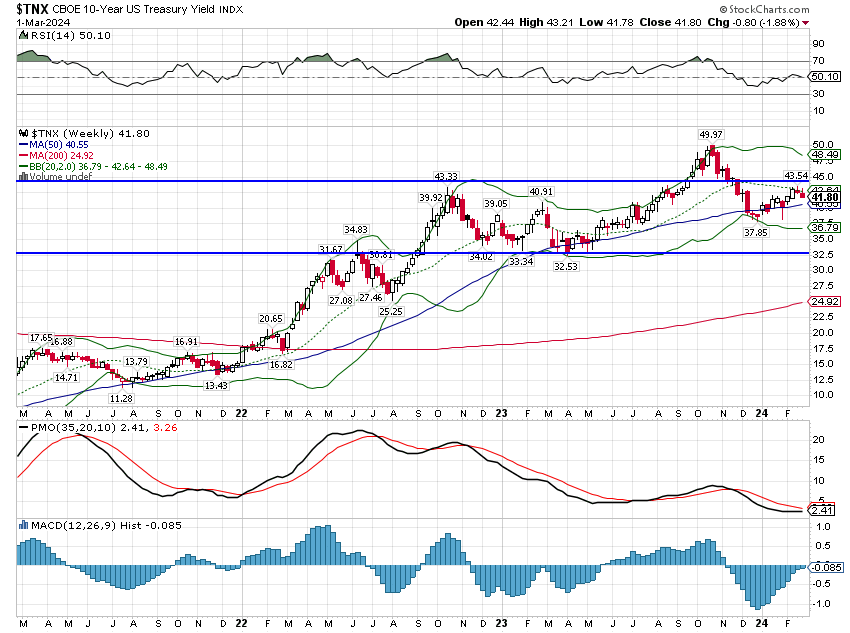
Bonds have been more volatile than normal since COVID but rates are actually pretty stable over the last 18 months. Yields are essentially unchanged since the stock market bottom in late 2022:
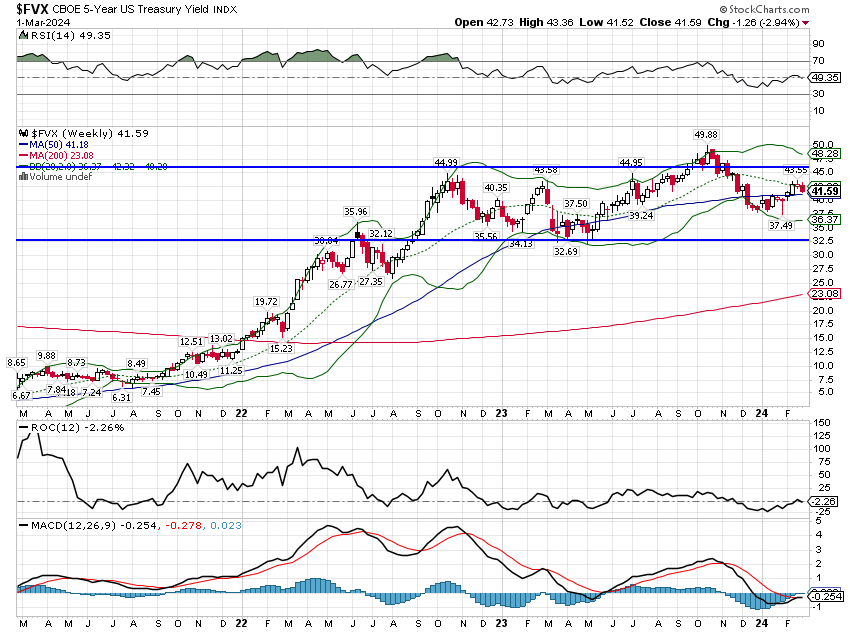
The 5-year shows a similar pattern:
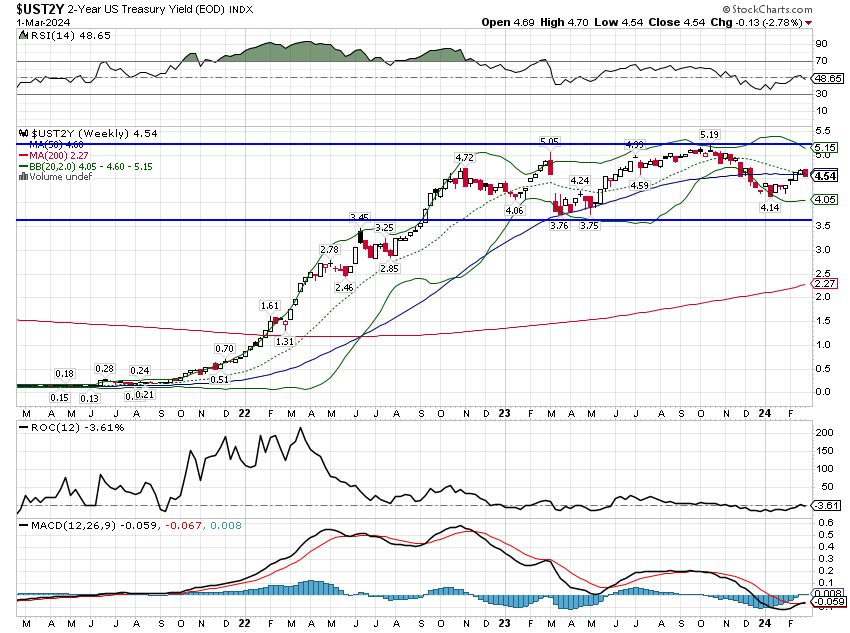
As does the 2-year:
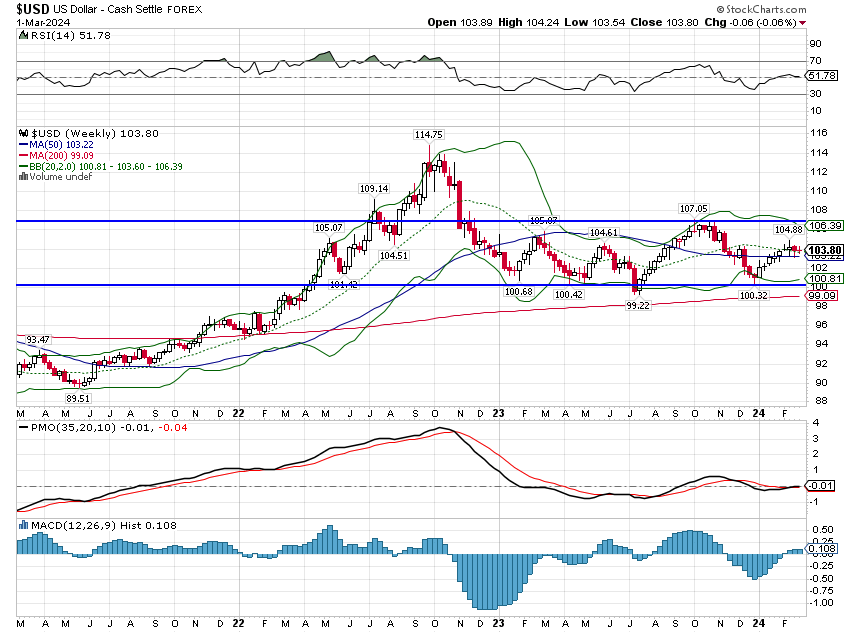
The dollar too:
Lastly, 10-year TIPS yields have also returned to a normal level and have been pretty stable since the end of 2022:
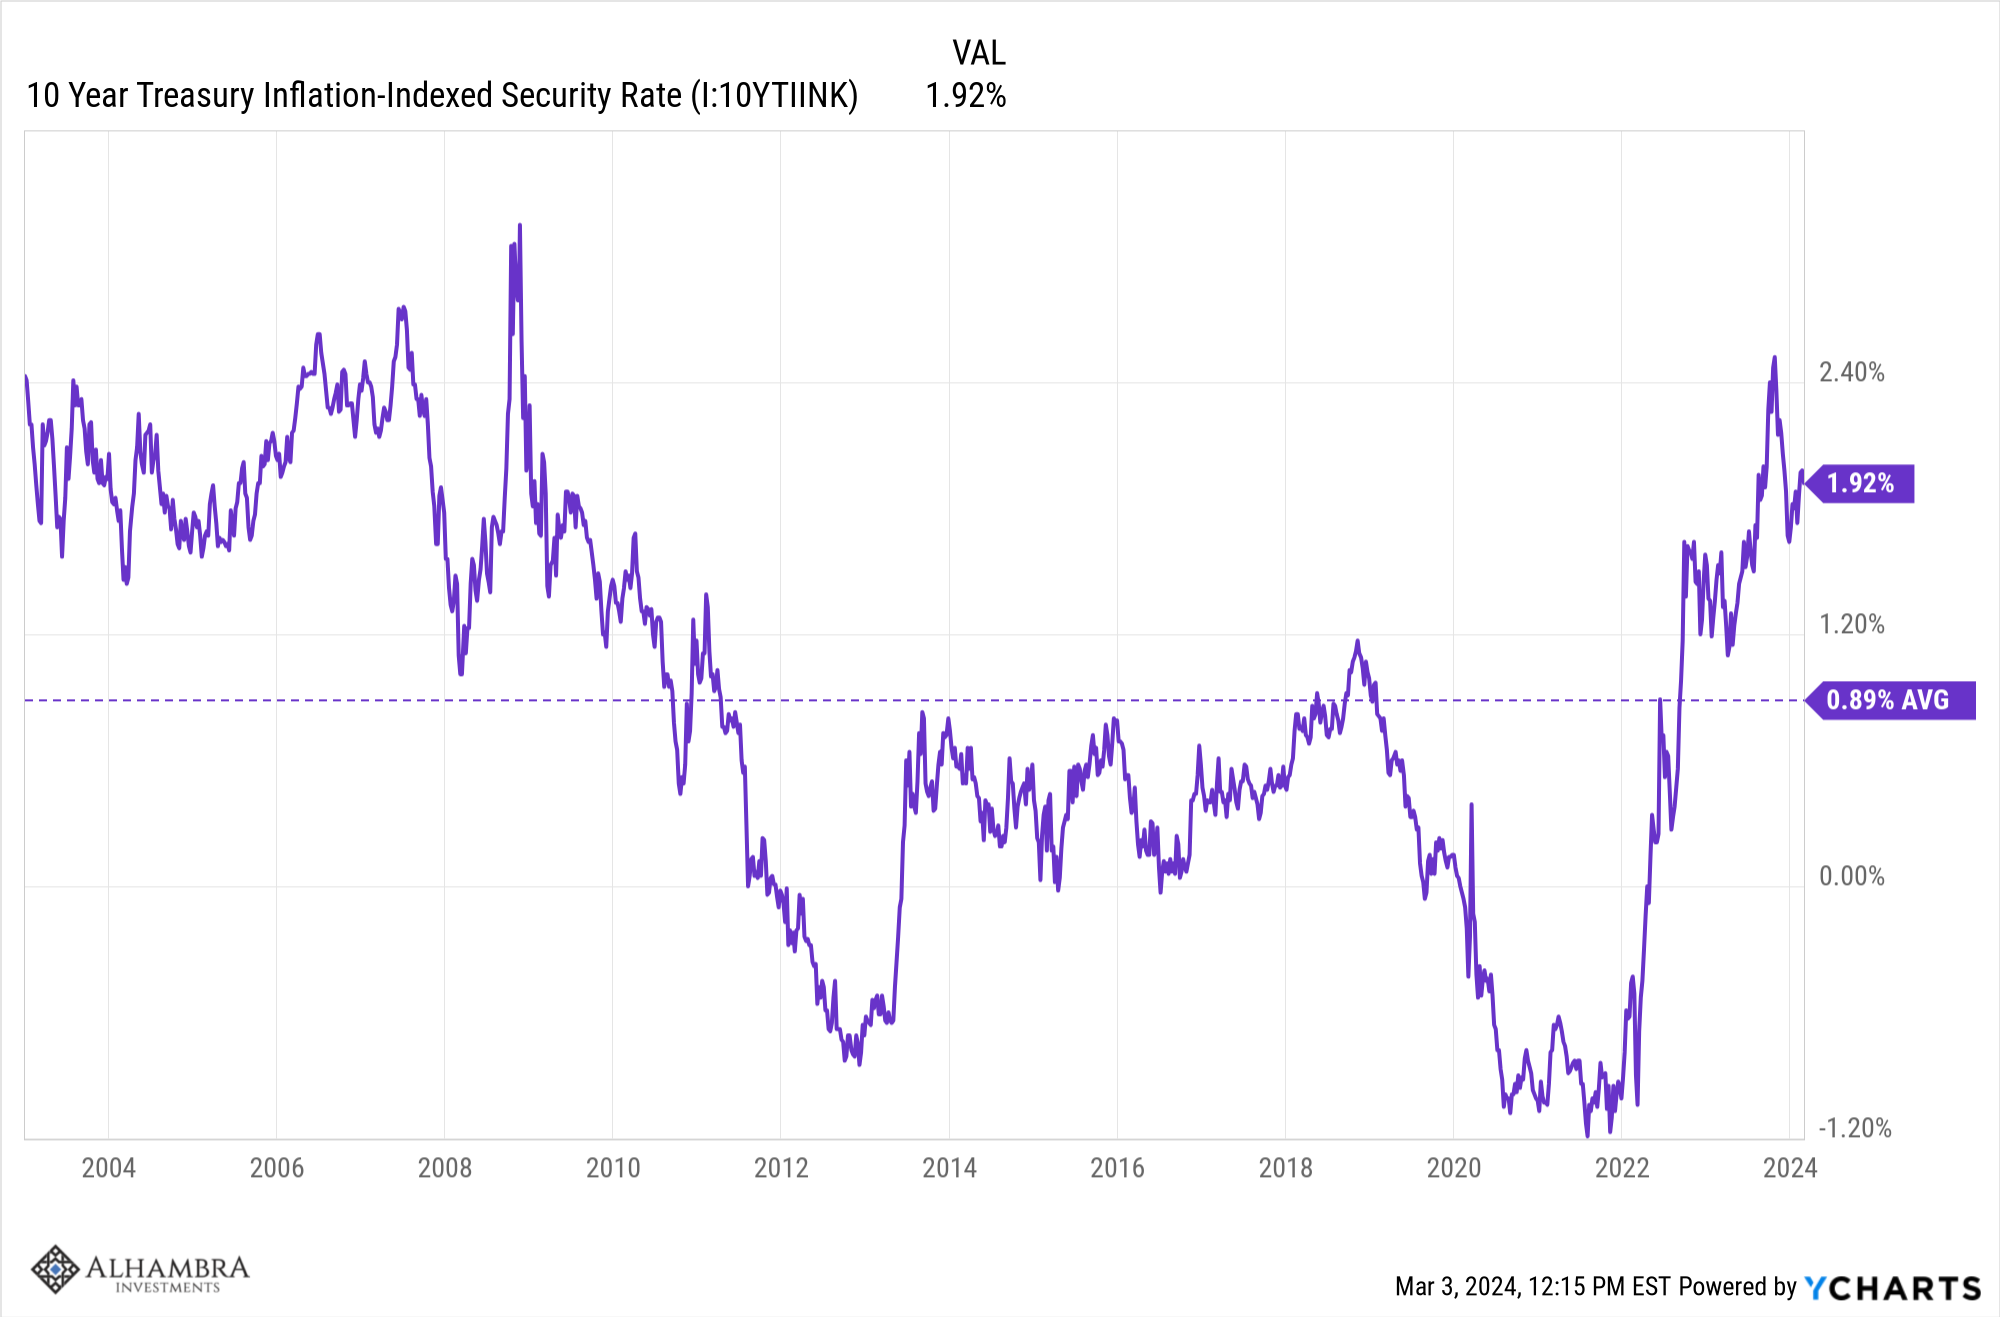
Real yields are elevated relative to the post-2008 crisis period but consistent with the levels prior to 2008.
All of these market-based indicators tell us that growth and inflation expectations have been, despite a lot of angst about Fed policy, remarkably stable. The 10-year inflation breakeven is currently 2.3%, no different than it was in the spring of 2021. Investors had a lot of faith in the ability of the Fed – or other forces – to bring down inflation and that faith has been rewarded as actual inflation has indeed returned to that level. The PCE price index, reported just last week, is up 2.4% over the last year.
By this view, the economic outlook is stable and, at least at present, not a source of concern for investors. Is that view correct? Well, I don’t know because I can’t tell the future but as I’ve said before, the best estimate of the future economy is found in markets, not Wall Street or Federal Reserve research. Because I watch markets for my economic clues, I’ve been consistent in my positive view of the economy over the last two years even as many of my fellow investors have fretted continuously about recession or inflation or the dreaded stagflation.
That doesn’t mean I have no concerns about the economy because, like most people, I do. We have seen a number of weak economic reports recently – durable goods last week for instance – but in general, the economy appears to be tracking to about the long-term trend of around 2%. I think we could do better than that, but it isn’t cause for alarm.
The stock market may well be due for a correction of the current overbought condition but overall I don’t see the degree of speculation I would expect before a major disruption. If you don’t own the S&P 500 – and we don’t – then I don’t think today’s markets warrant much concern. A correction – a drop of 10% or less – can happen at any time and trying to avoid it is more likely to result in a mistake than a successful exit and re-entry. Rather than fret about one area of the market – growth stocks – I think investors would be better served by focusing on the areas that are not expensive and overbought.
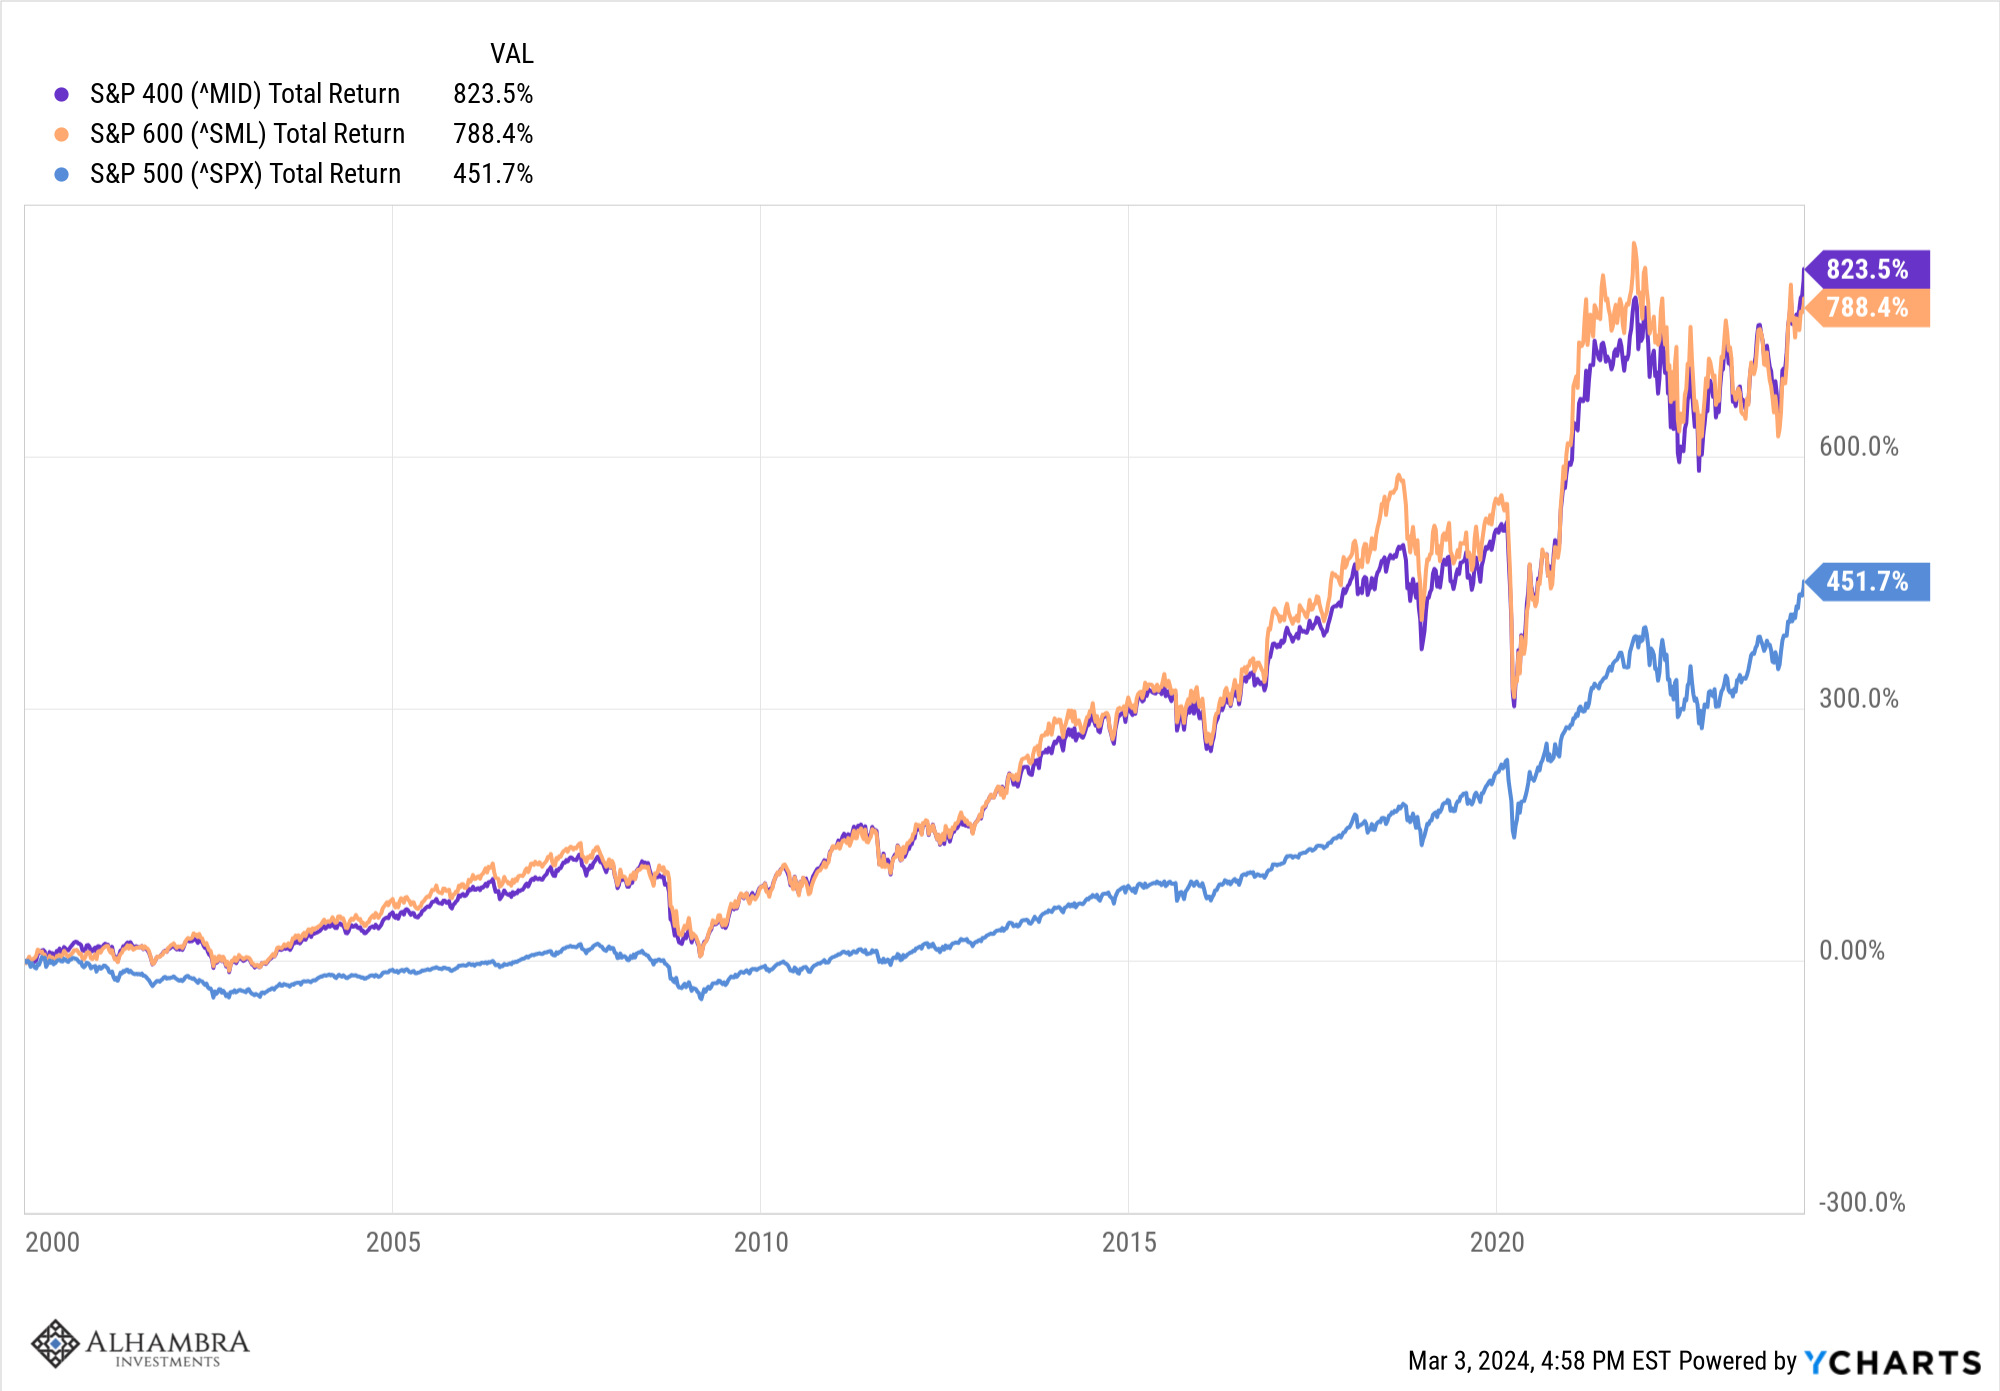
As shown above, the small and mid-cap indexes are not overvalued and are expected to post big earnings growth this year. Interest rates could play a role, with lower rates relieving anxiety about refinancing debt coming due soon and higher rates raising those concerns as well as concerns about economic growth. Small and midcap companies are more domestically oriented and so more sensitive to domestic growth. One last thing to consider is that while large caps have outperformed over the last decade, small and midcaps have drastically outperformed large caps this century. Returning to that mode is merely returning to normal, a theme you’re probably tired of hearing about from me.
There are plenty of other markets that aren’t overbought like the large indexes. REITs are almost universally hated – especially those invested in office space – but there are other types of REITs that don’t have the same concerns such as medical properties, retail, and multi-family. Frankly, I think office offers the most upside because companies are pushing hard to get workers back in the office and I expect them to succeed. Like anything else, the time to buy an asset is when it is disliked and cheap; REITs certainly fit the bill.
I would also point to energy stocks which, aren’t as hated as REITs, but are also far from well-loved. These companies are buying back stock, hiking dividends and oil prices are on the rise. Oil production growth in the US is slowing and OPEC+ is trying to keep a lid on production, which should support prices.
Assuming the economy stays resilient and interest rates are well-behaved, I think the likeliest outcome is for the current narrow rally to broaden to other parts of the market. Small and midcap stocks outperformed strongly in February so this spreading out may already be underway. We will get a correction at some point and if you own any of the overvalued large-cap indexes, I’d suggest a little profit-taking right now. Otherwise, it is best to stay focused on the basics of long-term investing. Focus on the things that are out of favor and offer a good risk/reward tradeoff.
Joe Calhoun
*If you use the Russell 2000 as your small-cap proxy you would likely need to use a lower-rated bond. We use the S&P 600 or CRSP small cap index which are of higher quality.
Stay In Touch