
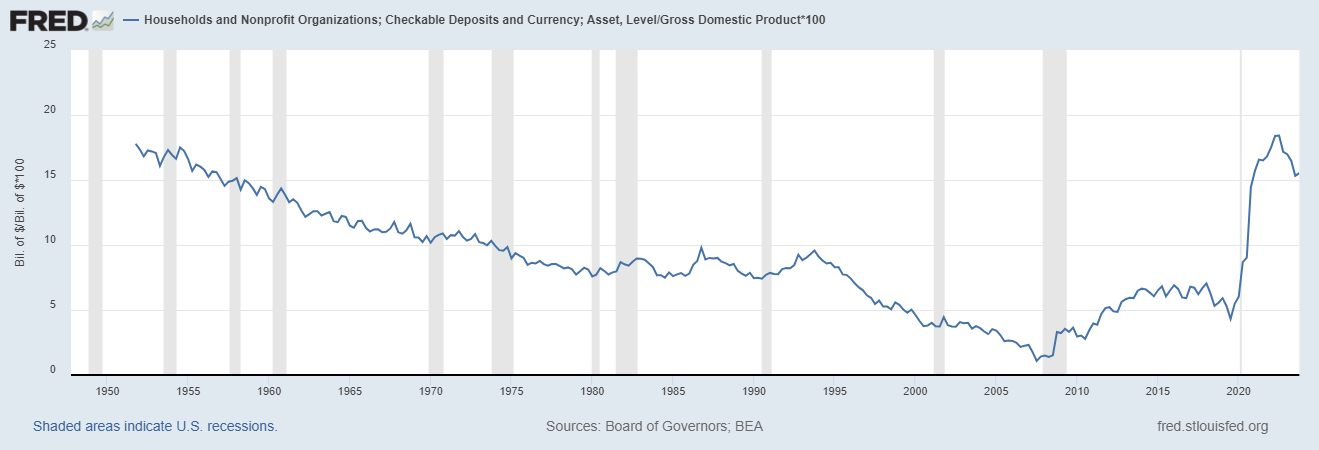
Over the last two years, the evolution of the US economy has been driven by a return to “normal”. The distortions of the response to COVID had a profound impact on the economy that I believe will persist for many years. The change in cash levels at the household level were large and have proved more persistent than most expected. At the end of last year, checkable deposits and currency were still elevated well beyond the pre-COVID levels at 15.5% of GDP.
Checkable Deposits and currency, households and non-profits
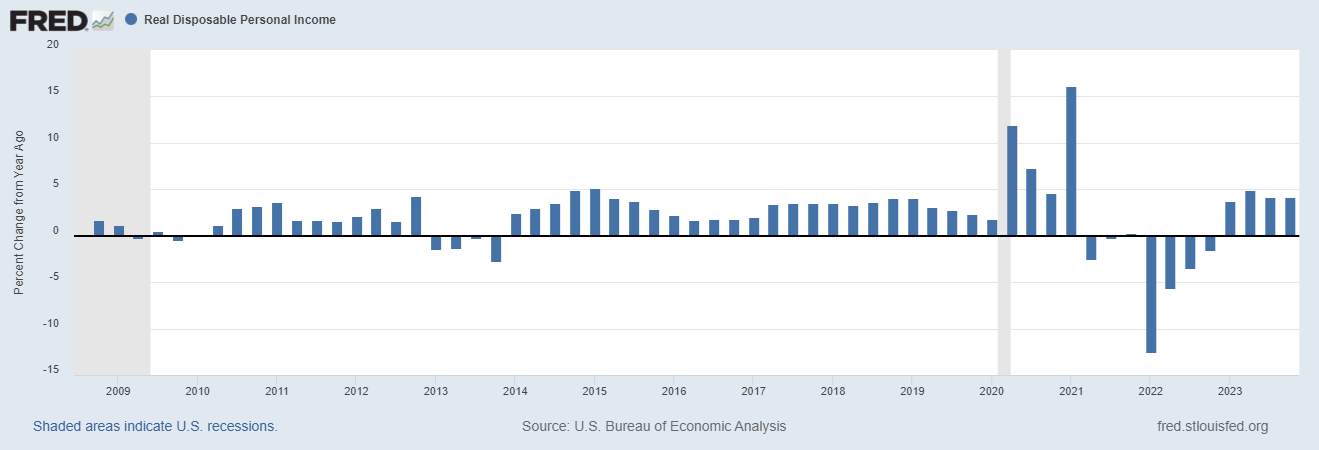
Real incomes (adjusted for inflation) have also been rising robustly over the last year. The COVID response produced a big jump in incomes in 2020/21, then a large drop in 2022 as those programs expired. As things have returned to normal over the last year, Real Disposable Personal Income has been rising at an annual rate over 4%, much higher than the 2.7% from 2010-2019, 2.3% from 2000-2009 and even the 3.1% from 1990-1999.
In addition, the biggest gains have come for the lowest earners with many occupations seeing gains of over 15% since the onset of COVID. The only cohort to lose was the top 20% of earners, who have seen an actual decline.
Real disposable personal income quarterly annualized change
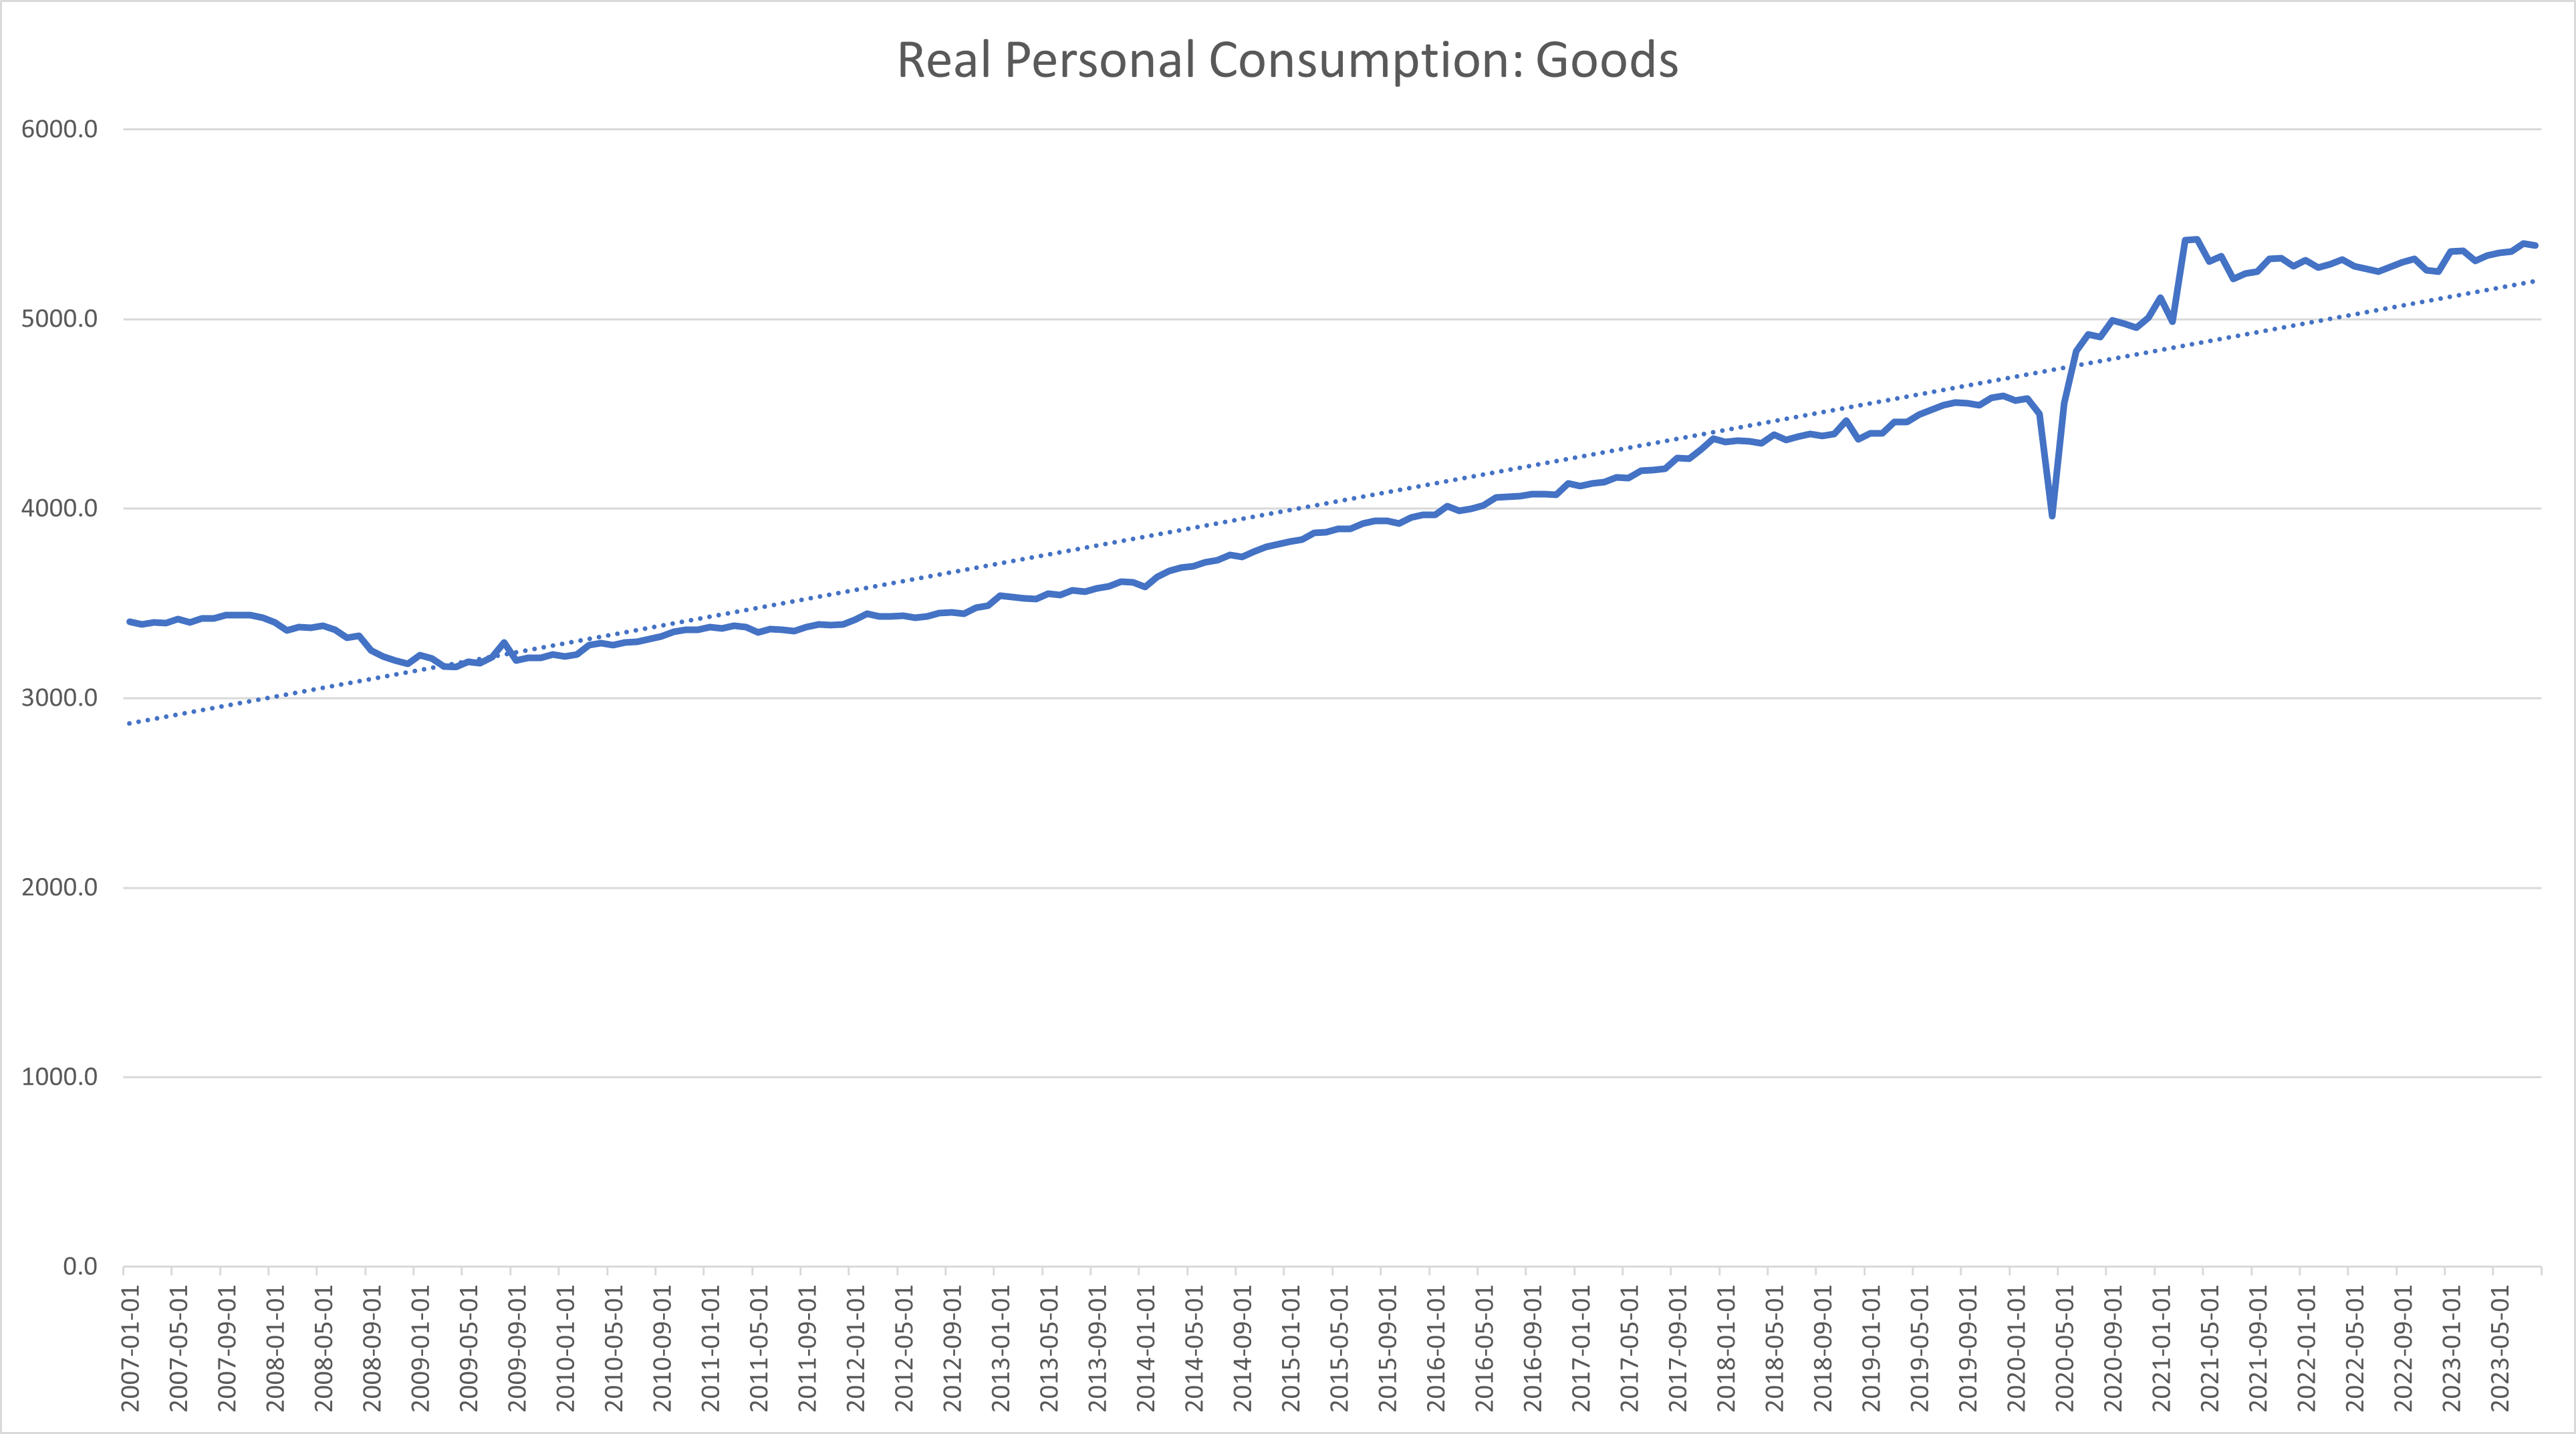
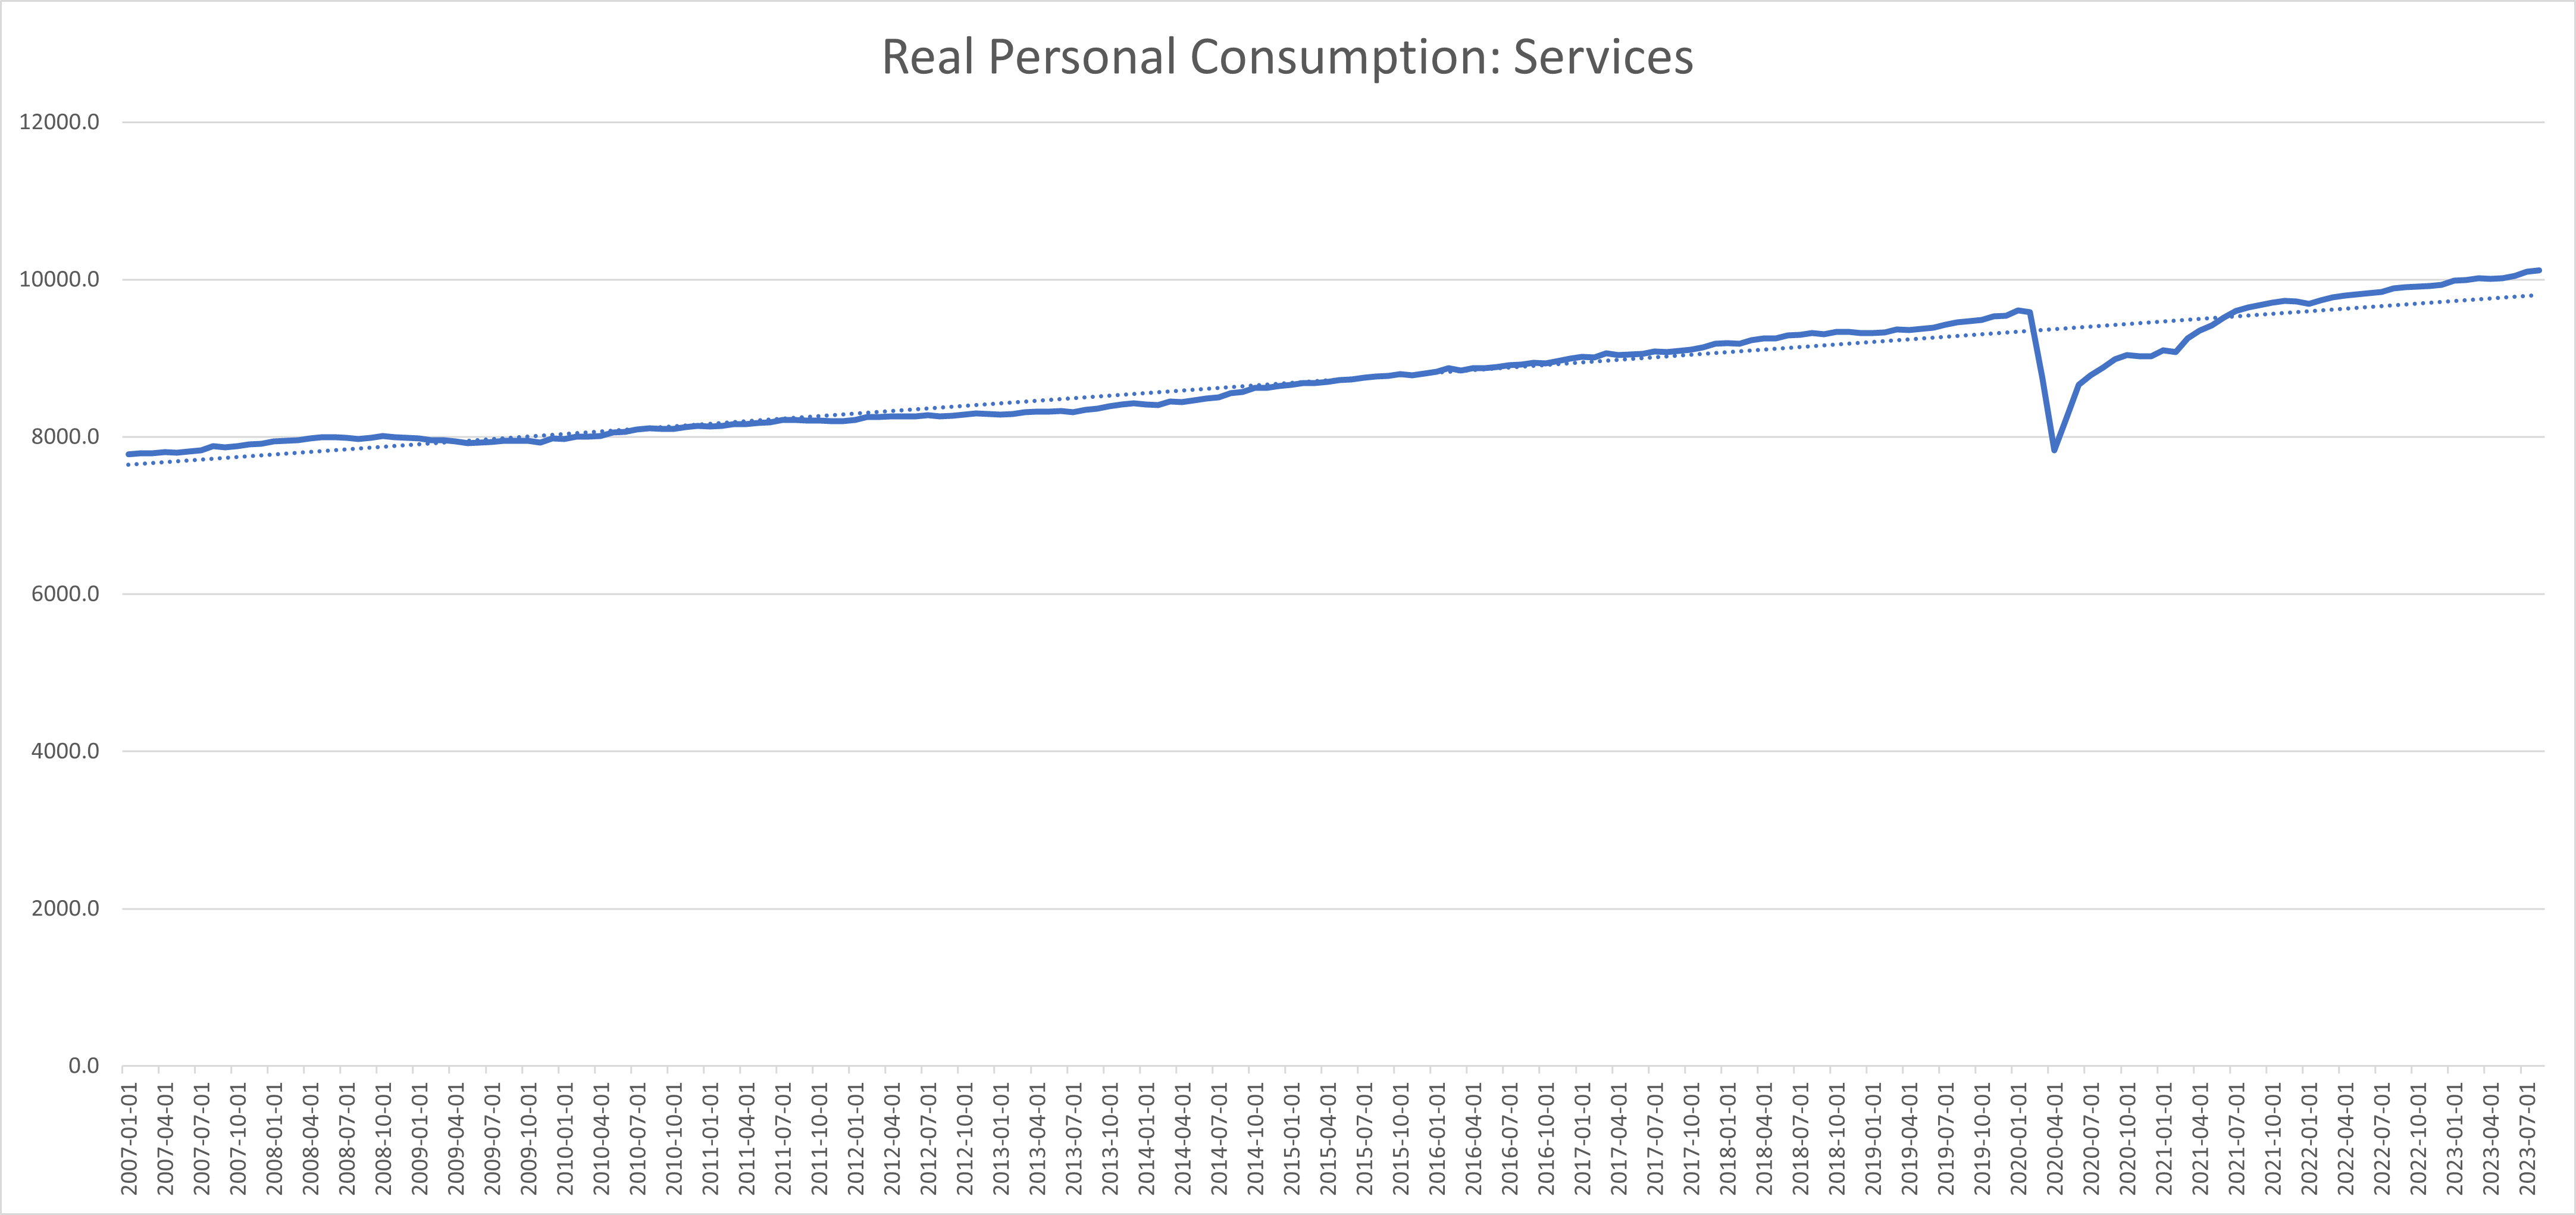
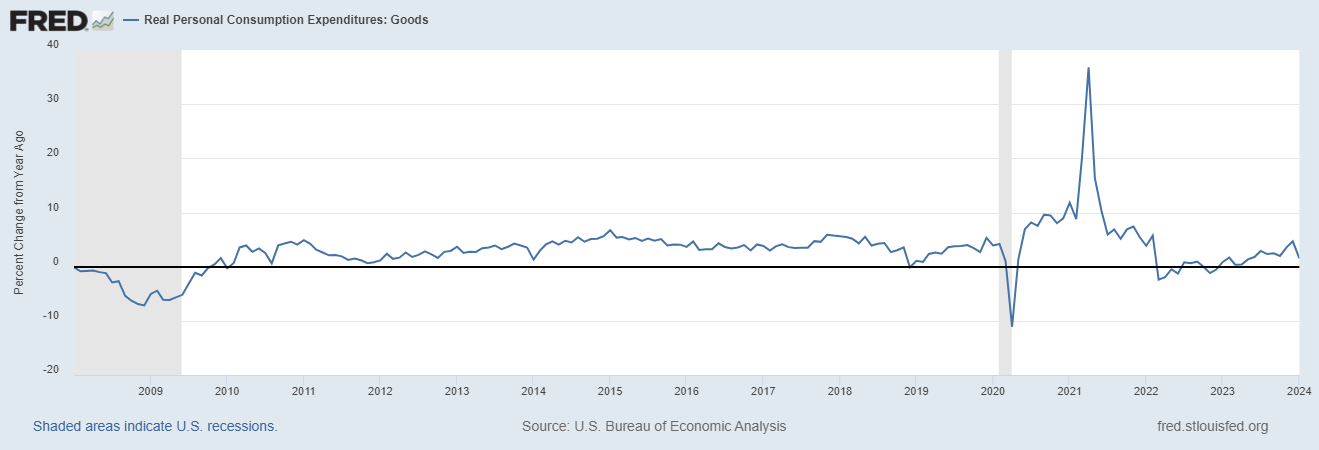
The change in household balance sheet cash and rising real incomes has fueled above trend consumption of both goods and services. The rise has not been uniform though as goods and services consumption was out of sync until recently. Goods consumption recovered first during COVID as services remained constrained by the virus. As vaccines reduced the impact of the virus, services started to recover while goods consumption stagnated. This stagnation of goods consumption ended in 2023 and the two are now back to normal.
Real Personal Consumption: Goods
Real Personal Consumption: Services
The surge and later stagnation of goods consumption created an inventory buildup due to over-ordering of goods to compensate for clogged supply chains. Clearing this overhang of inventory is what produced the recession angst of the last two years. Goods production slowed considerably, creating recession level readings in the Leading Economic Indicators as well as the manufacturing PMIs (purchasing managers indexes) and regional Fed surveys. The LEI is manufacturing centric and has never acted as it has over the last two years without a recession. It may be significant that the Conference Board, which compiles the index, has recently pulled back on their recession call. The PMIs and Fed surveys have not fully recovered yet but they have lifted off their lows as inventory/sales ratios have fallen.
The delayed recovery in the services side of the economy is what saved us from recession. As goods consumption stagnated, services consumption recovered. The net result was an economy continuing to grow at the long term trend of about 2% in 2022. As goods consumption resumed its growth in 2023, overall growth moved above trend.
The economy has slowed back to trend over the last year as the Fed’s rate hikes have impacted some areas of the economy, particularly housing. While the slowing has been modest, there is a concern that if rates are held at these levels – “higher for longer” – it could lead to recession. At the beginning of this year, the market was anticipating as many as 6 interest rate cuts in 2024. Due to the resilience of the economic data, that has been dialed back as the year has progressed.
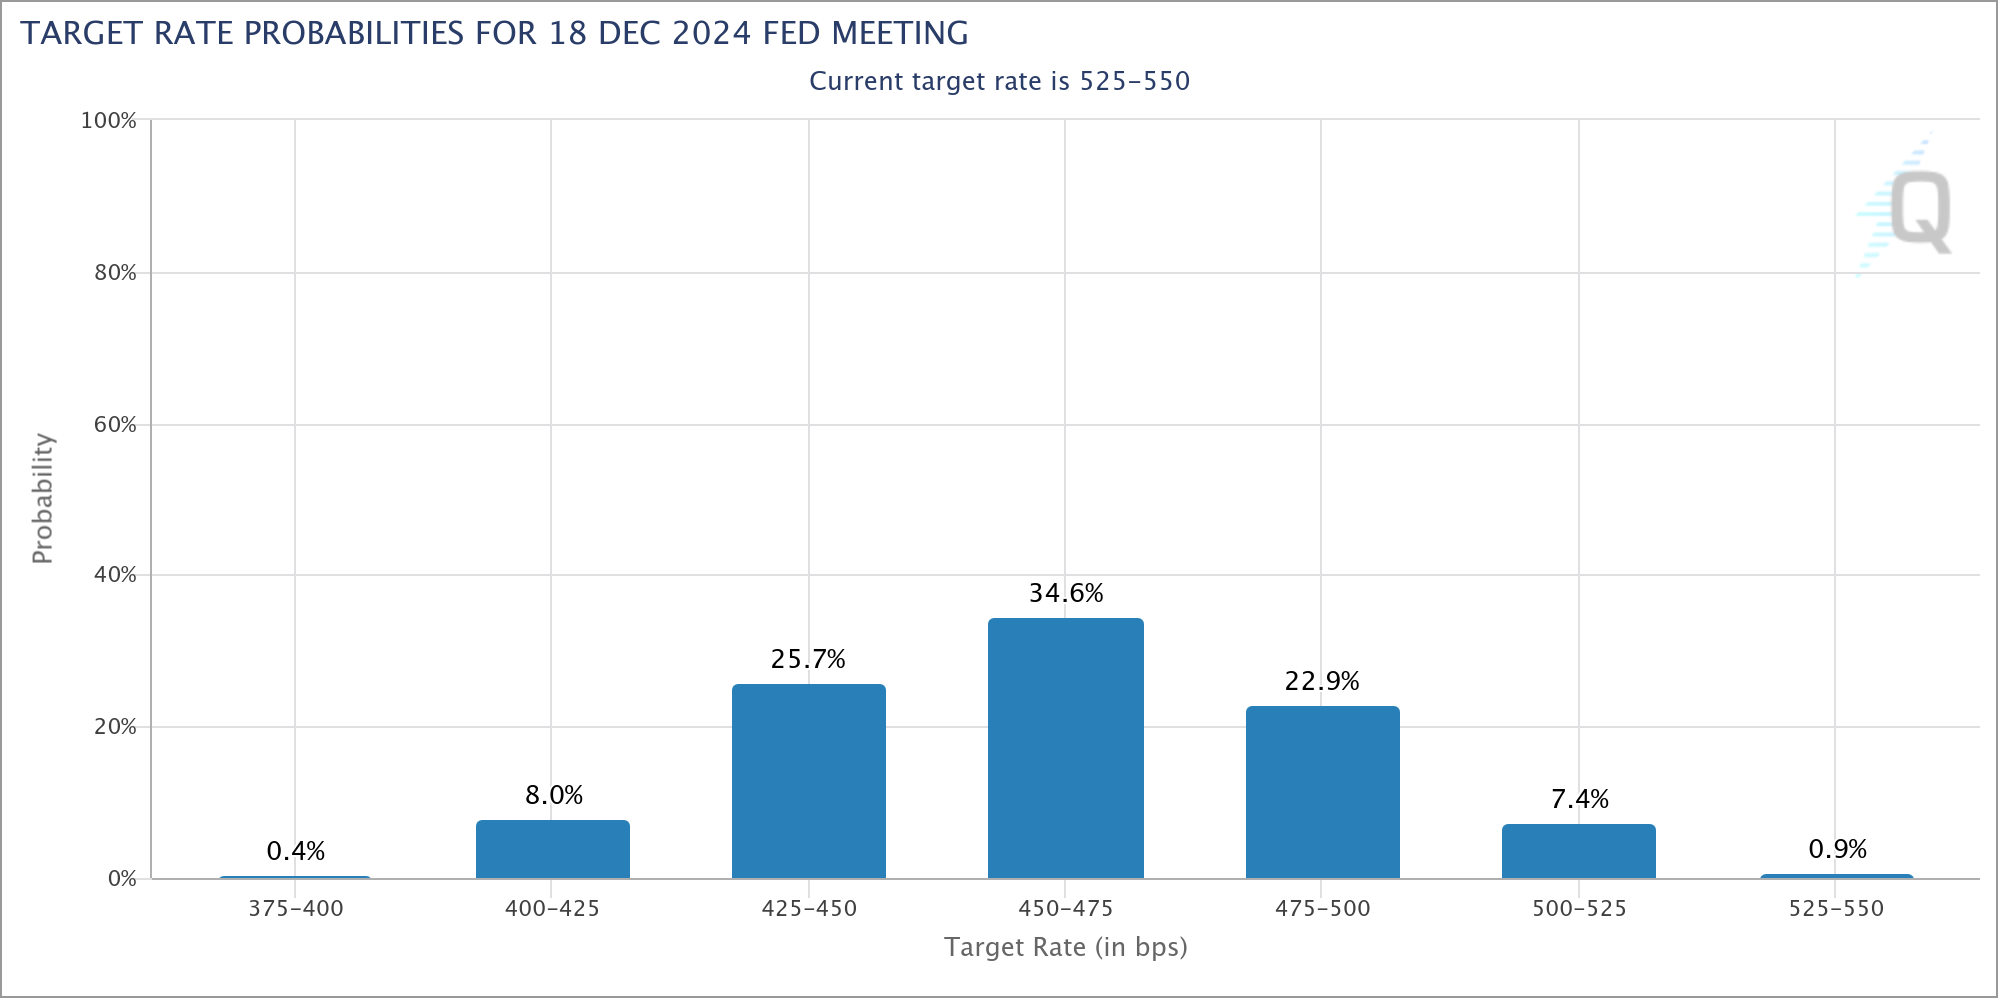
Currently, the market puts a 58% probability of the first rate cut coming in June and the total number of anticipated cuts is down to three with the odds on the third in December at just 34%. The Fed Funds market moves every day so that is just a snapshot but goes to show how much the view of the economy has changed just since the beginning of the year. Theoretically, the Fed would like to cut rates before the economy slows significantly to avoid a recession but they will need more evidence than what is currently available.
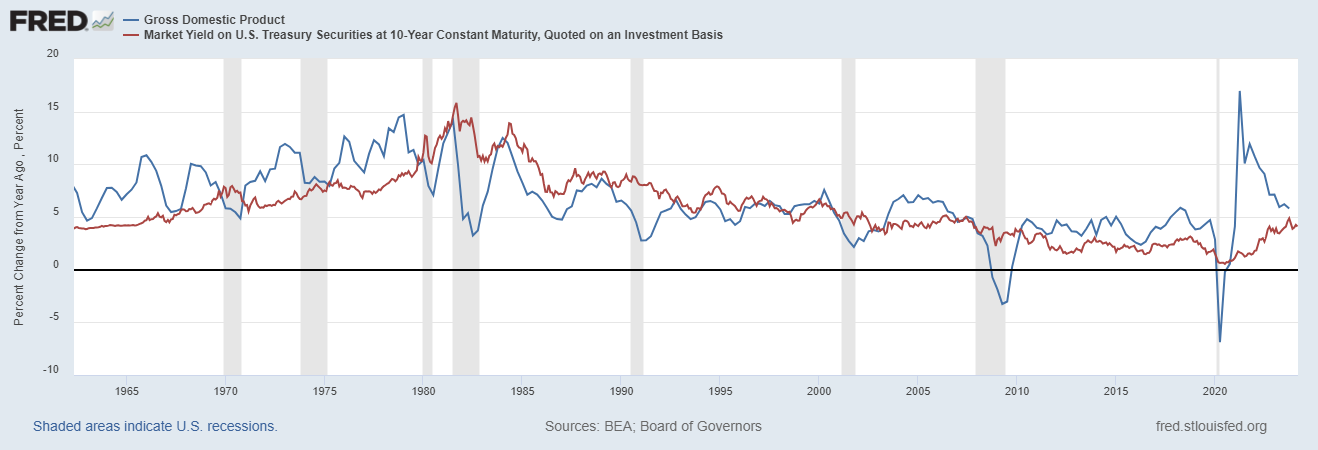
The year-over-year change in Nominal GDP (Real GDP + Inflation) at the end of the year was 5.8%. The year-over-year change in Real GDP was 3.1% leaving inflation as a remainder of 2.7%. That is actually a great result even with inflation somewhat above the Fed’s 2% target. The 10-year Treasury rate is a good proxy for NGDP growth expectations and the current rate of 4.3% implies a further slowing from the current 5.8% change in NGDP. If one assumes that real growth slows to trend of 2%, that also implies a further drop in inflation to near the Fed’s target.
If the economy doesn’t slow further, interest rates will likely adjust to a higher NGDP growth rate. For investors, this is a double edged sword as faster nominal growth translates directly to higher corporate earnings (earnings are nominal) but also raises the discount rate. Periods of rising long term interest rates over the last two years have coincided with stock market corrections but rates would likely have to rise above the previous highs – 5% – to seriously impact stock prices.
Nominal GDP & 10 year Treasury rate
Concerns
I have been consistent over the last two years that recession was not imminent and that inflation would moderate even as most observers worried about a downturn based on indicators such as the yield curve. Those who focused on the yield curve didn’t take into account the, sometimes, long lead time to recession. The average has been 13 months from inversion to recession and we’re now at 16 months.
These analysts also didn’t recognize that the yield curve returns to normal – long-term rates higher than short term – prior to recession. This is driven by Fed rate cuts as the economy nears recession; short term rates fall faster than long term rates and the curve normalizes. That has not happened yet because the Fed has not cut rates and, at least for now, seems unlikely to do so soon.
Now, the consensus is for either a soft landing of the economy, which would involve a further slowing but only a mild recession or flat growth for some period, or no landing at all where the economy continues to grow while inflation falls to target. If either of those comes to pass, I wouldn’t call it miraculous but it would be a rare occurrence. It is my nature to go against the crowd and while I don’t see a recession as imminent, I am starting to get more concerned.
I have been expecting a rebound in goods production as inventory accumulation has stalled over the last year. The inventory figures are not adjusted for inflation so the real inventory of goods – the number of widgets – has been falling.
Total Business inventories
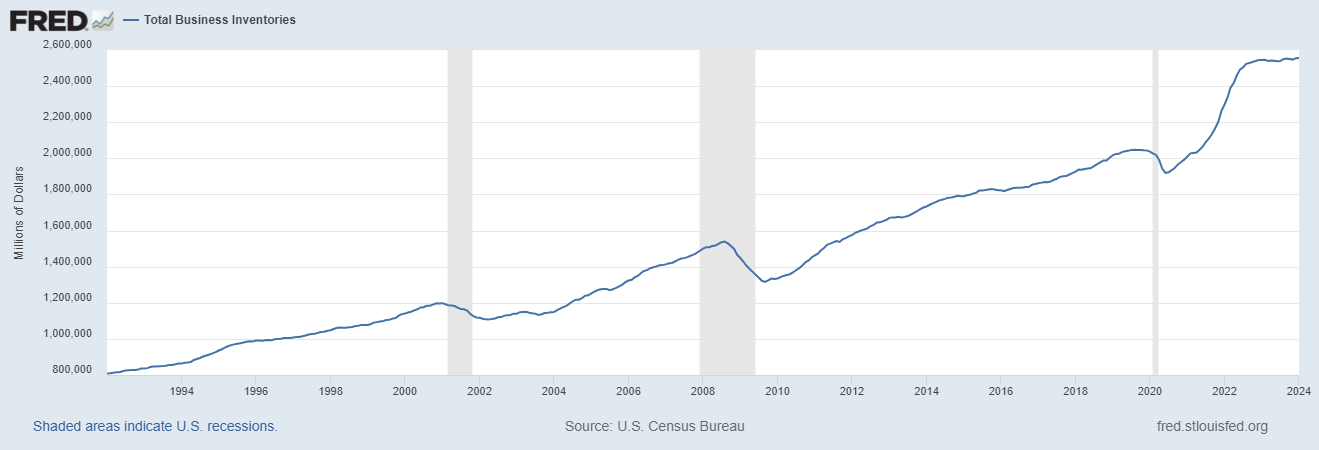
A recovery in goods production would bolster the economy if and when services consumption falls back to the old trend. Unfortunately, that doesn’t seem to be happening yet. It seemed that the ISM manufacturing survey was recovering, rising back to near 50 in January (49.1). But February’s release saw the index fall back to 47.8.
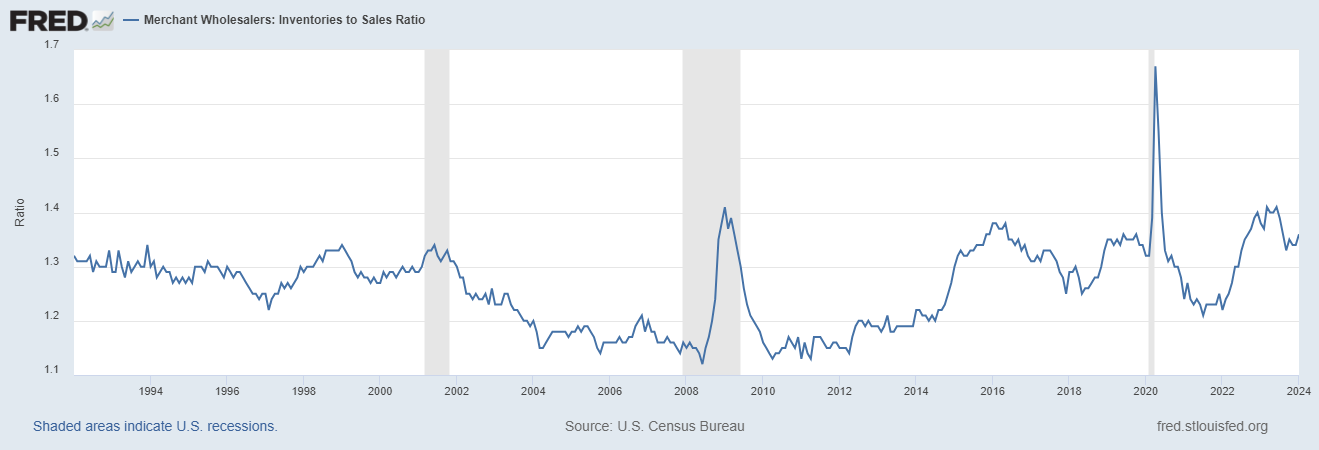
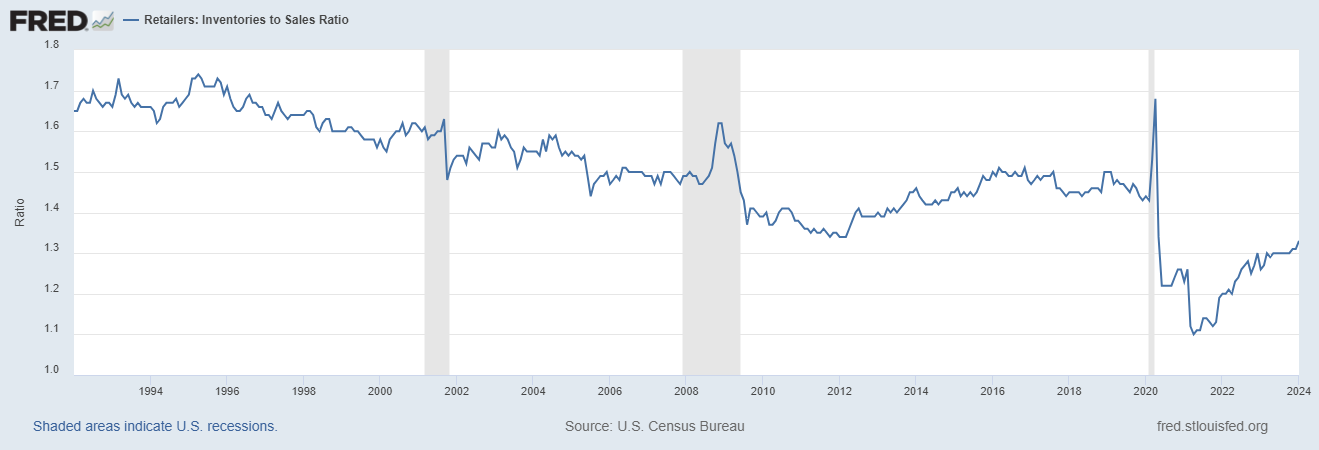
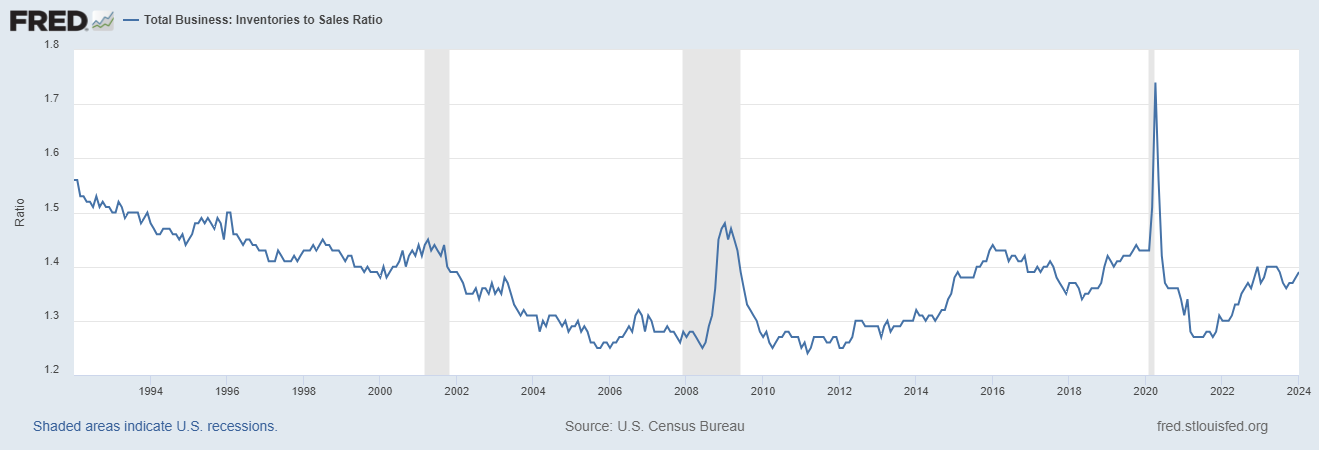
Meanwhile, inventory to sales ratios have stopped falling as goods consumption appears to be moderating again.
Wholesale inventory to sales
Retailers inventory to sales
Total business inventory to sales
Real personal consumption of goods, yoy % change
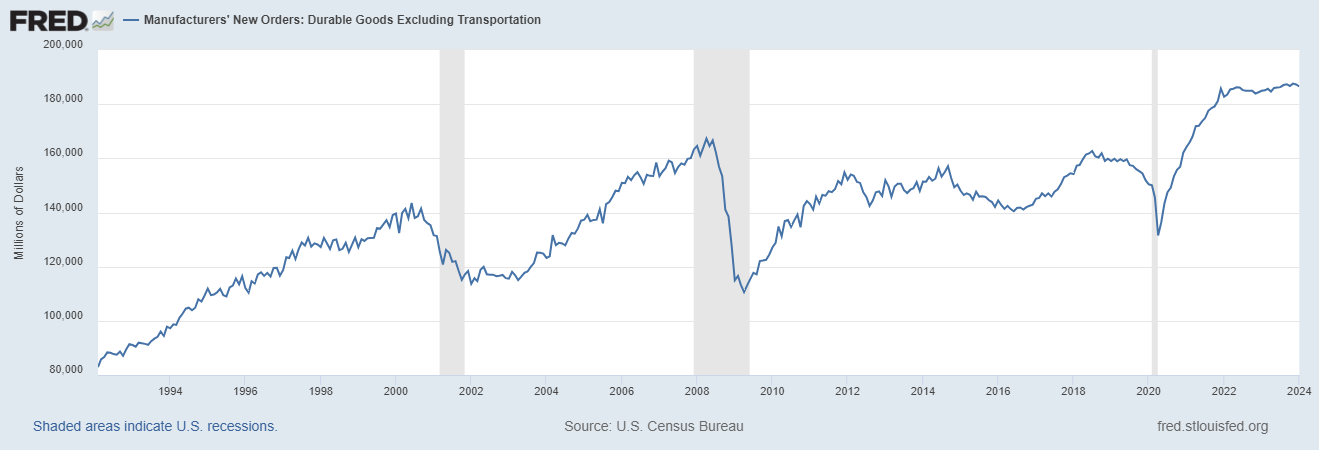
New orders for durable goods ex-transportation in January were disappointing and continue to flatline:
Manufacturers new orders for durable goods excluding transportation
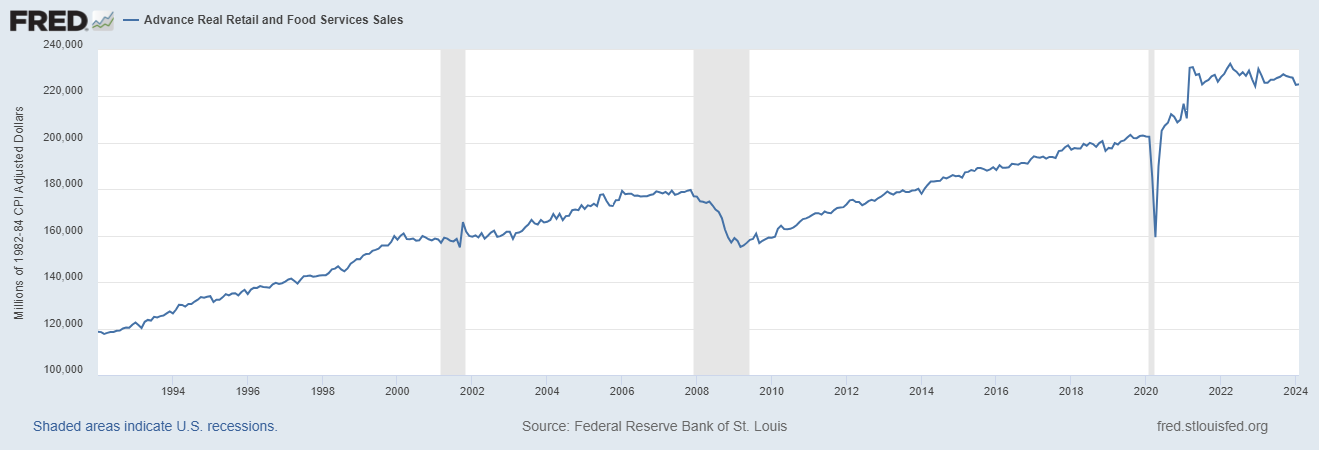
Real retail sales are essentially unchanged since the summer of 2021:
Real Retail Sales
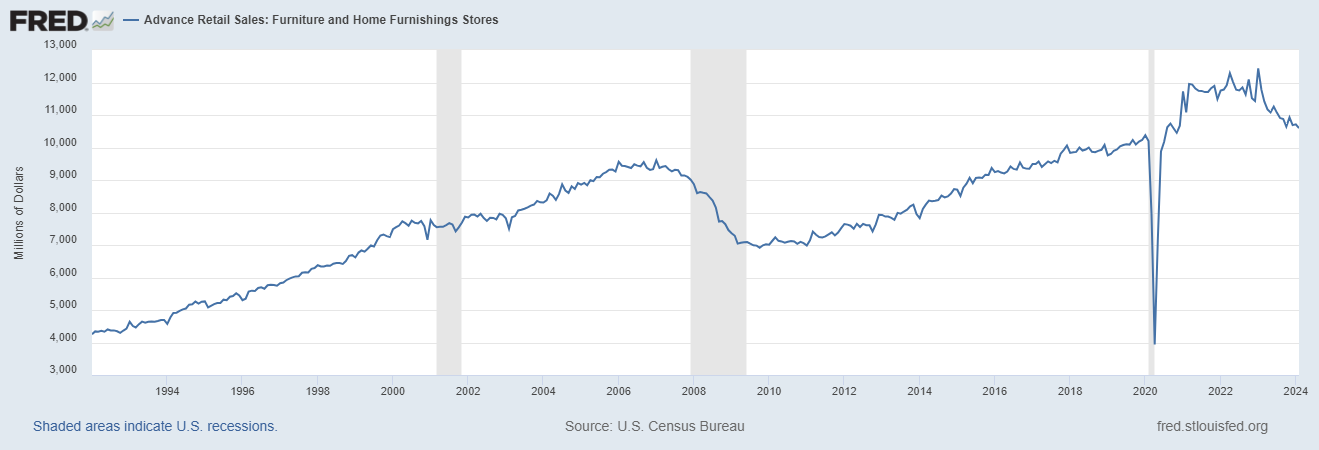
Some of this weakness is coming from the slowdown in housing.
Advance retail sales : Furniture & Home furnishings stores
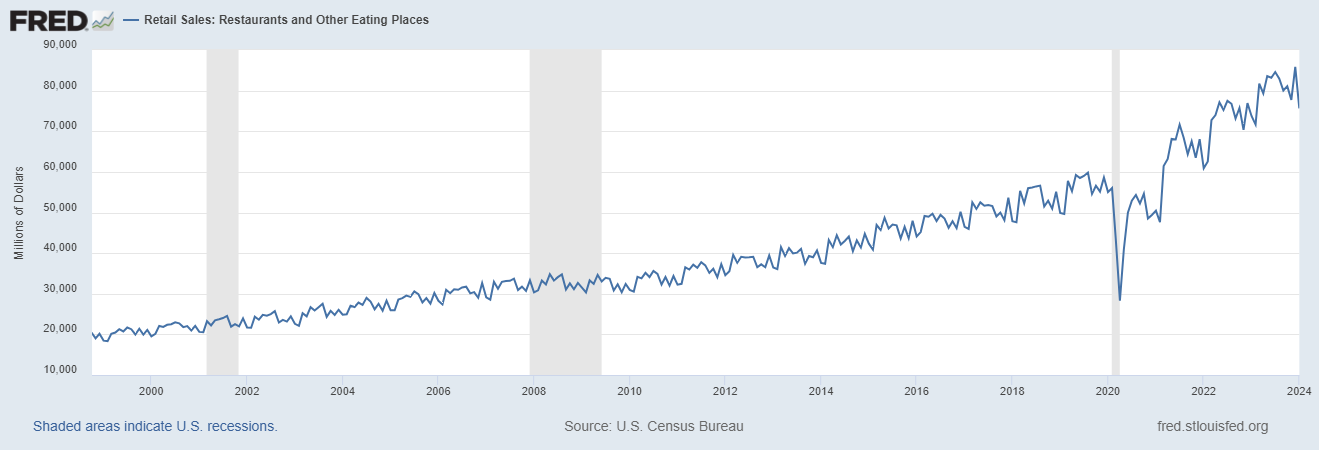
But we’re also starting to see some weakness on the food service side. Restaurant sales fell nearly 12% in January.
Retail Sales: Restaurants and Other Eating Places
Meanwhile, progress on reducing inflation appears to have stalled:
Consumer Price Index, yoy % change
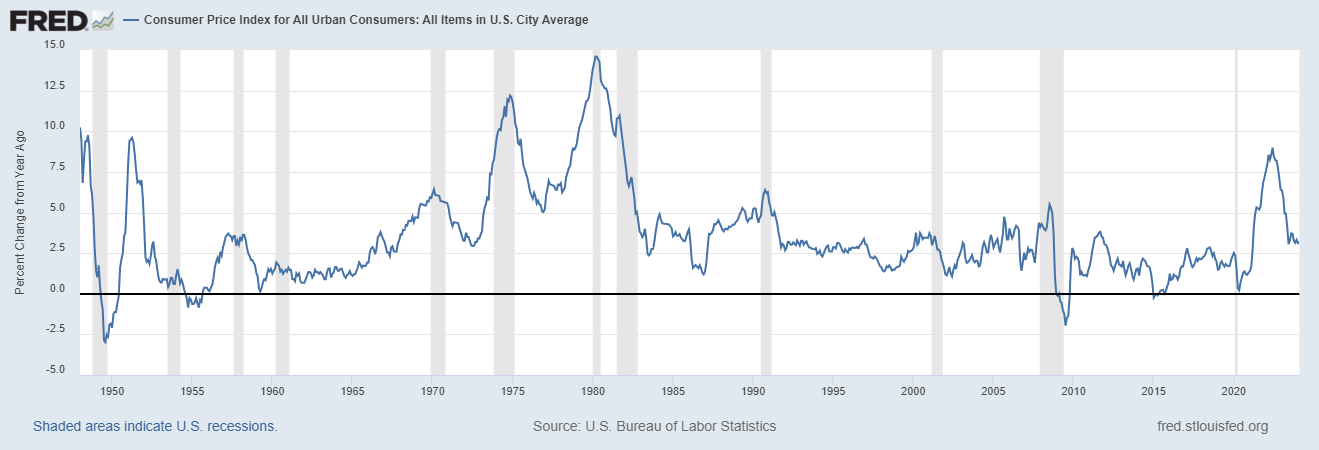
The combination of weaker economic growth and inflation that remains higher than desired is not a good combination. The Fed is more focused on inflation than growth and if they delay rate cuts because of that, they risk making a mistake similar to the one they made in 2008. Back then they were reluctant to cut rates because oil and other commodity prices continued to rise sharply until mid-year.
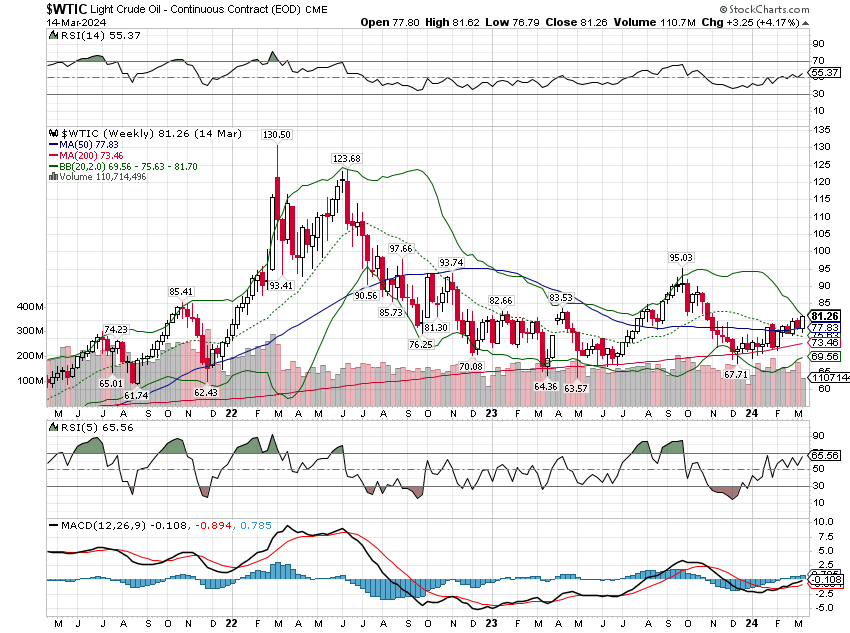
Coincidentally, oil prices are back on the rise, up from $68 in December to over $80 now. With US shale production growth stagnating, supplies are already starting to tighten. I would not expect relief from Saudi Arabia or Russia.
These concerns are mitigated to some degree by other facts. Services consumption continues to rise at an above trend pace and shows little sign of downshifting. Goods consumption is also still rising and durable goods orders are notoriously volatile; one month doesn’t make a trend. The ISM survey is offset by the S&P manufacturing survey which returned to growth in January at 51.1 and continued to improve in February at 52.2. The S&P survey covers a wider range of business sizes while the ISM surveys primarily large businesses, so it is, potentially, a better indicator of the entire economy. All the regional Fed surveys also improved in February with the Philly Fed returning to positive territory. The NY Fed improved from -43.7 to -2.4 while the Dallas, Richmond and Kansas City versions also improved.
Incomes also continue to grow at a robust pace with average hourly earnings up 4.3% over the last year. As mentioned above, real disposable personal income (after tax, adjusted for inflation) was up at an over 4% annual rate in the last quarter. Productivity growth has also been better than expected at 3.2% in the 4th quarter. Rising incomes and rising productivity are not what recessions are made of.
Inflation should also continue to moderate over this year as shelter inflation continues to moderate in the official figures. The Consumer Price Index ex-shelter was only up 1.8% year-over-year and was actually negative in October, November, and December.
All economic cycles go through ups and downs and this one more than most. The economy is mostly back to normal but we are still trying to determine what normal is in the post-COVID world. The change in household and corporate balance sheets was profound and the long-term implications are still uncertain. We are also dealing with an ongoing labor shortage which should keep wages firm.
Lastly, no one knows yet the productivity implications of new technological developments. Productivity growth has grown above the previous decade’s pace recently but that is in the context of the recovery from COVID. It will have to continue to do so for the economy to grow faster than the period after the 2008 financial crisis. I am hopeful it will but we likely won’t know the outcome until years in the future.
Joe Calhoun
Environment

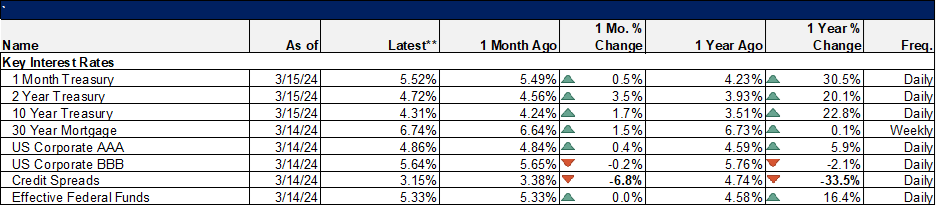
The 10-year yield was up 21 basis points last week based on some hotter than expected inflation readings. Frankly, I don’t think it means much since the other economic data was pretty weak on the growth side. In any case, no trends were changed even if it was mildly bad week for bonds.
The dollar didn’t respond as strongly but did rise 0.4% on the week. The short term downtrend remains in place.
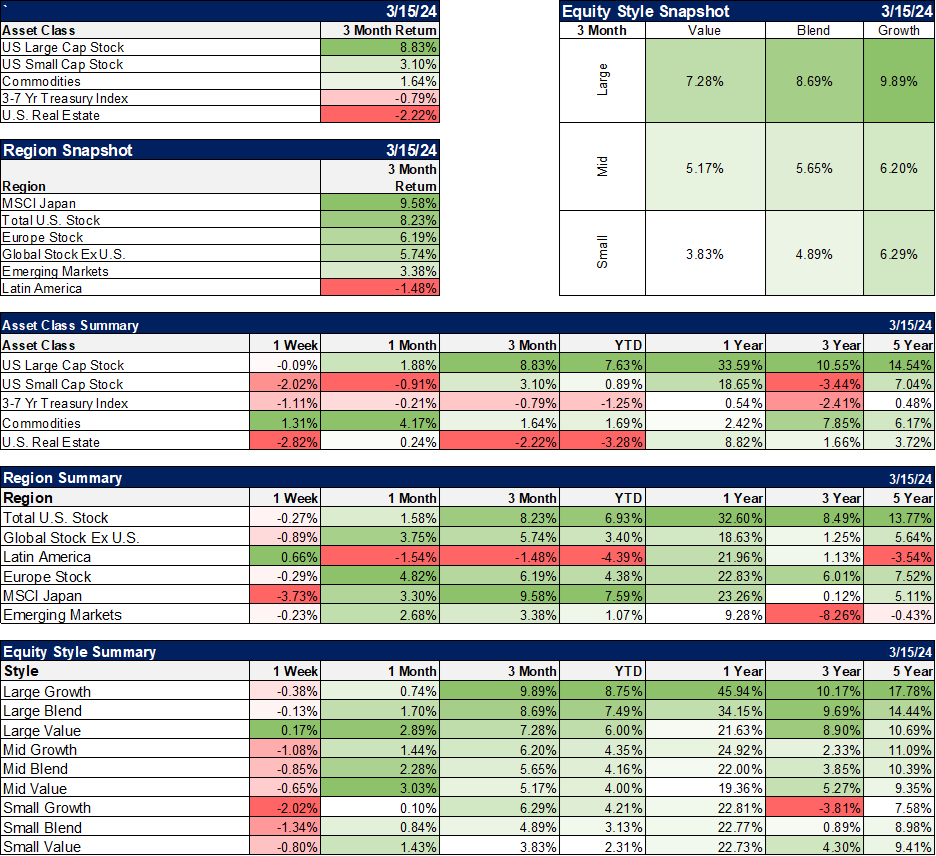
Markets
Interestingly, with interest rates and the dollar both up, the only asset class to put up a positive return for the week was commodities. Crude oil was up 3.3% on the week but the gains in commodities were widespread with copper up 6%, gasoline up 7.4%, palladium up 5.6%, agriculture commodities up 5.2%, silver up 3.6%, and platinum up 3.1%. Is inflation really dead?
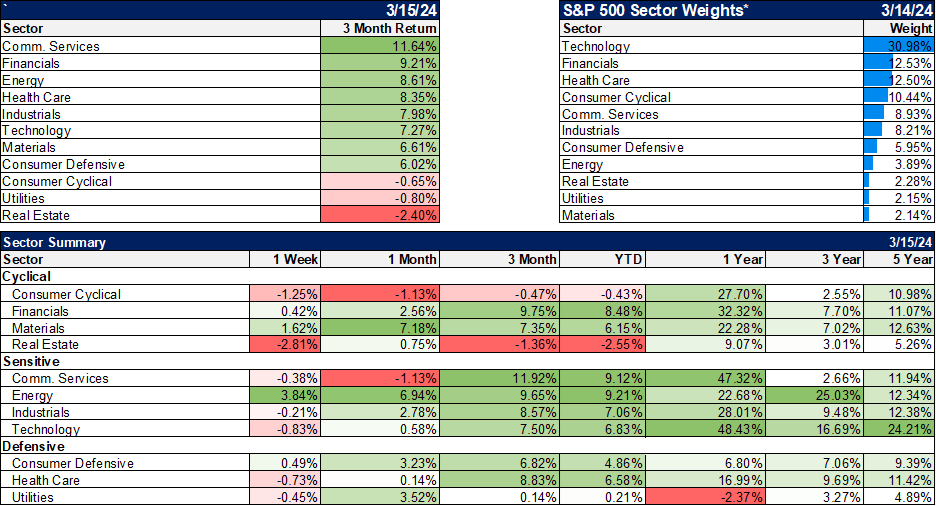
Sectors
With commodities ripping higher, the big winners for the week were materials and energy.
Market/Economic Indicators
Worse than expected reports:
-CPI Core up 0.4% vs 0.3% expected
-PPI up 0.6% vs 0.3% expected
-Core PPI up 0.3% vs 0.2% expected
-Retail Sales up 0.6% vs 0.8% expected
-Export prices up 0.8% vs 0.2% expected
-NY Empire State manufacturing index -20.9 vs -7 expected
None of these are really that bad but better than expected data appears to have peaked.
Credit spreads are 14 basis points from the lows set for this cycle at the end of 2021. Current levels are lower than any time in the post-2008 financial crisis period until that 2021 reading. The lowest since the late 90s is 2.46% in May of 2007 so we aren’t far from that. Is that complacency? Misplaced confidence? Or an indication that there is not stress at all in credit? Maybe junk bond investors aren’t looking hard enough?
Stay In Touch