

The first quarter of 2024 is in the books and the US economy and markets continue to defy expectations, which coming into this year were that growth and inflation would both moderate and the Fed would be able (or forced, depending on how much things slowed) to cut interest rates 0.25% as many as six times this year. In fact, at the beginning of this year there was a better than 50% chance the first cut would come in the month we just ended. That, of course, didn’t happen because while real growth and inflation both likely slowed in the first quarter (we don’t have all the data yet), it wasn’t enough to get the Fed too excited. The consensus opinion in the last two years has been that a recession was/is just around the corner and it has been nothing if not consistent – and wrong. And it still is.
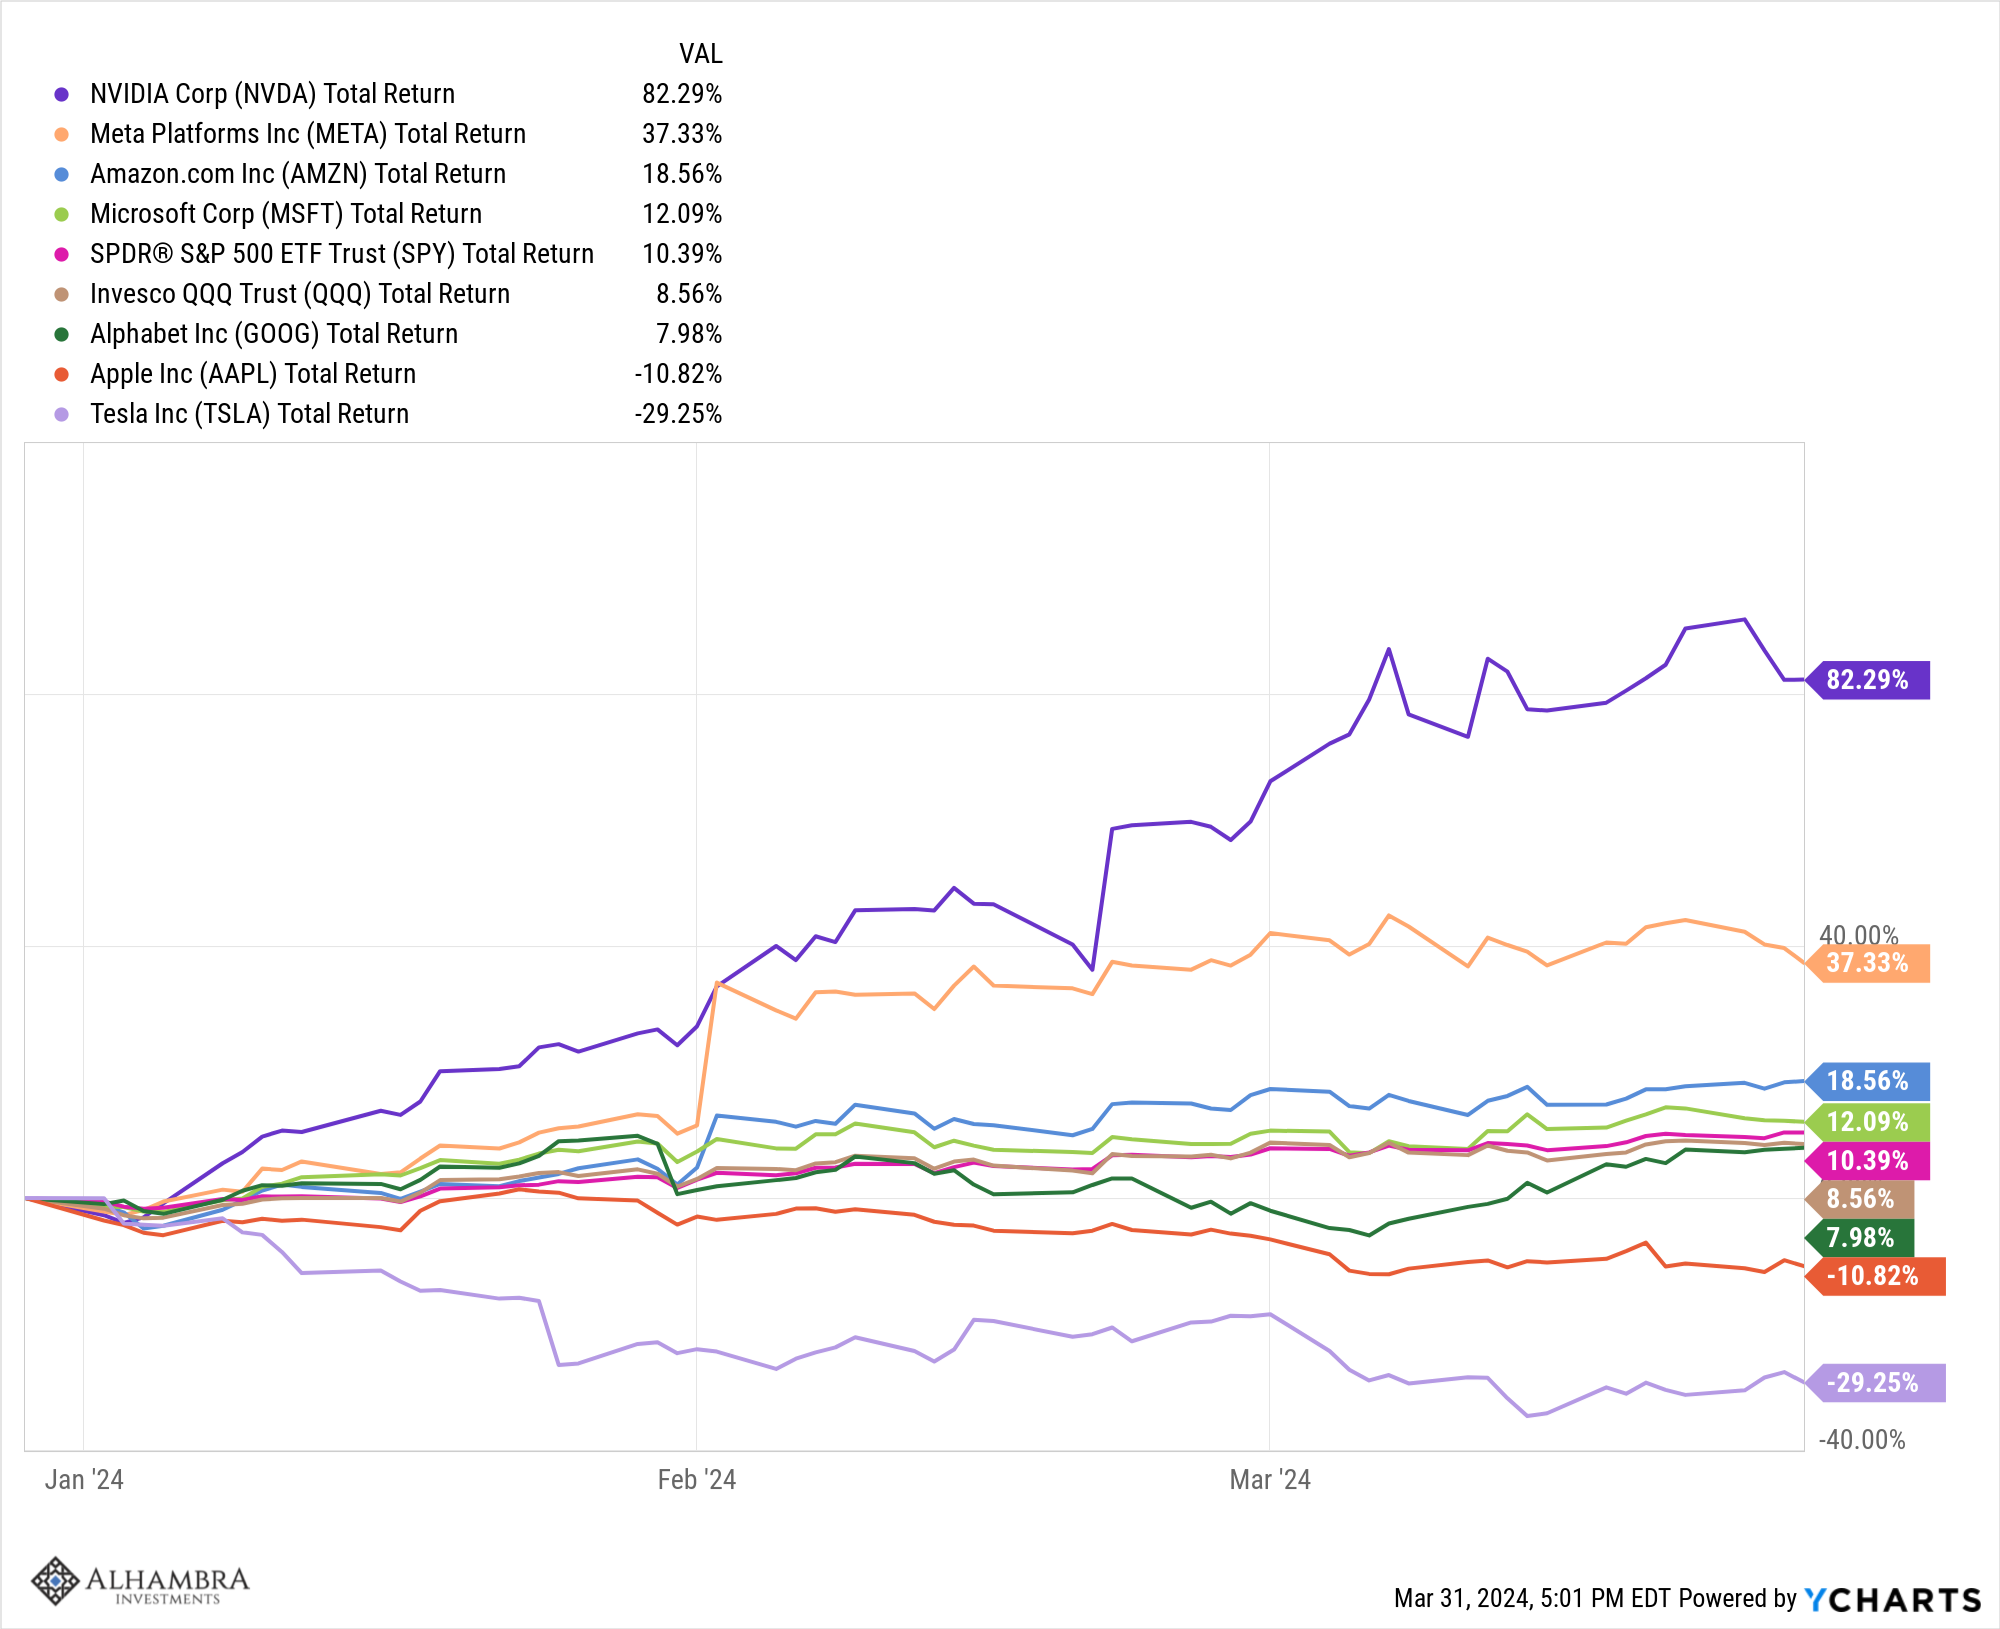
In markets, the narrative all year has been about how the market is only going up because of the “magnificent seven” and most stocks were not participating in the rally. That turned out to be dead wrong too. Of the magnificent seven, 4 outperformed the S&P 500 while 3 underperformed, with two of them – Apple and Tesla – actually losing money for the quarter. The NASDAQ 100 also underperformed the S&P 500.
Magnificent Seven
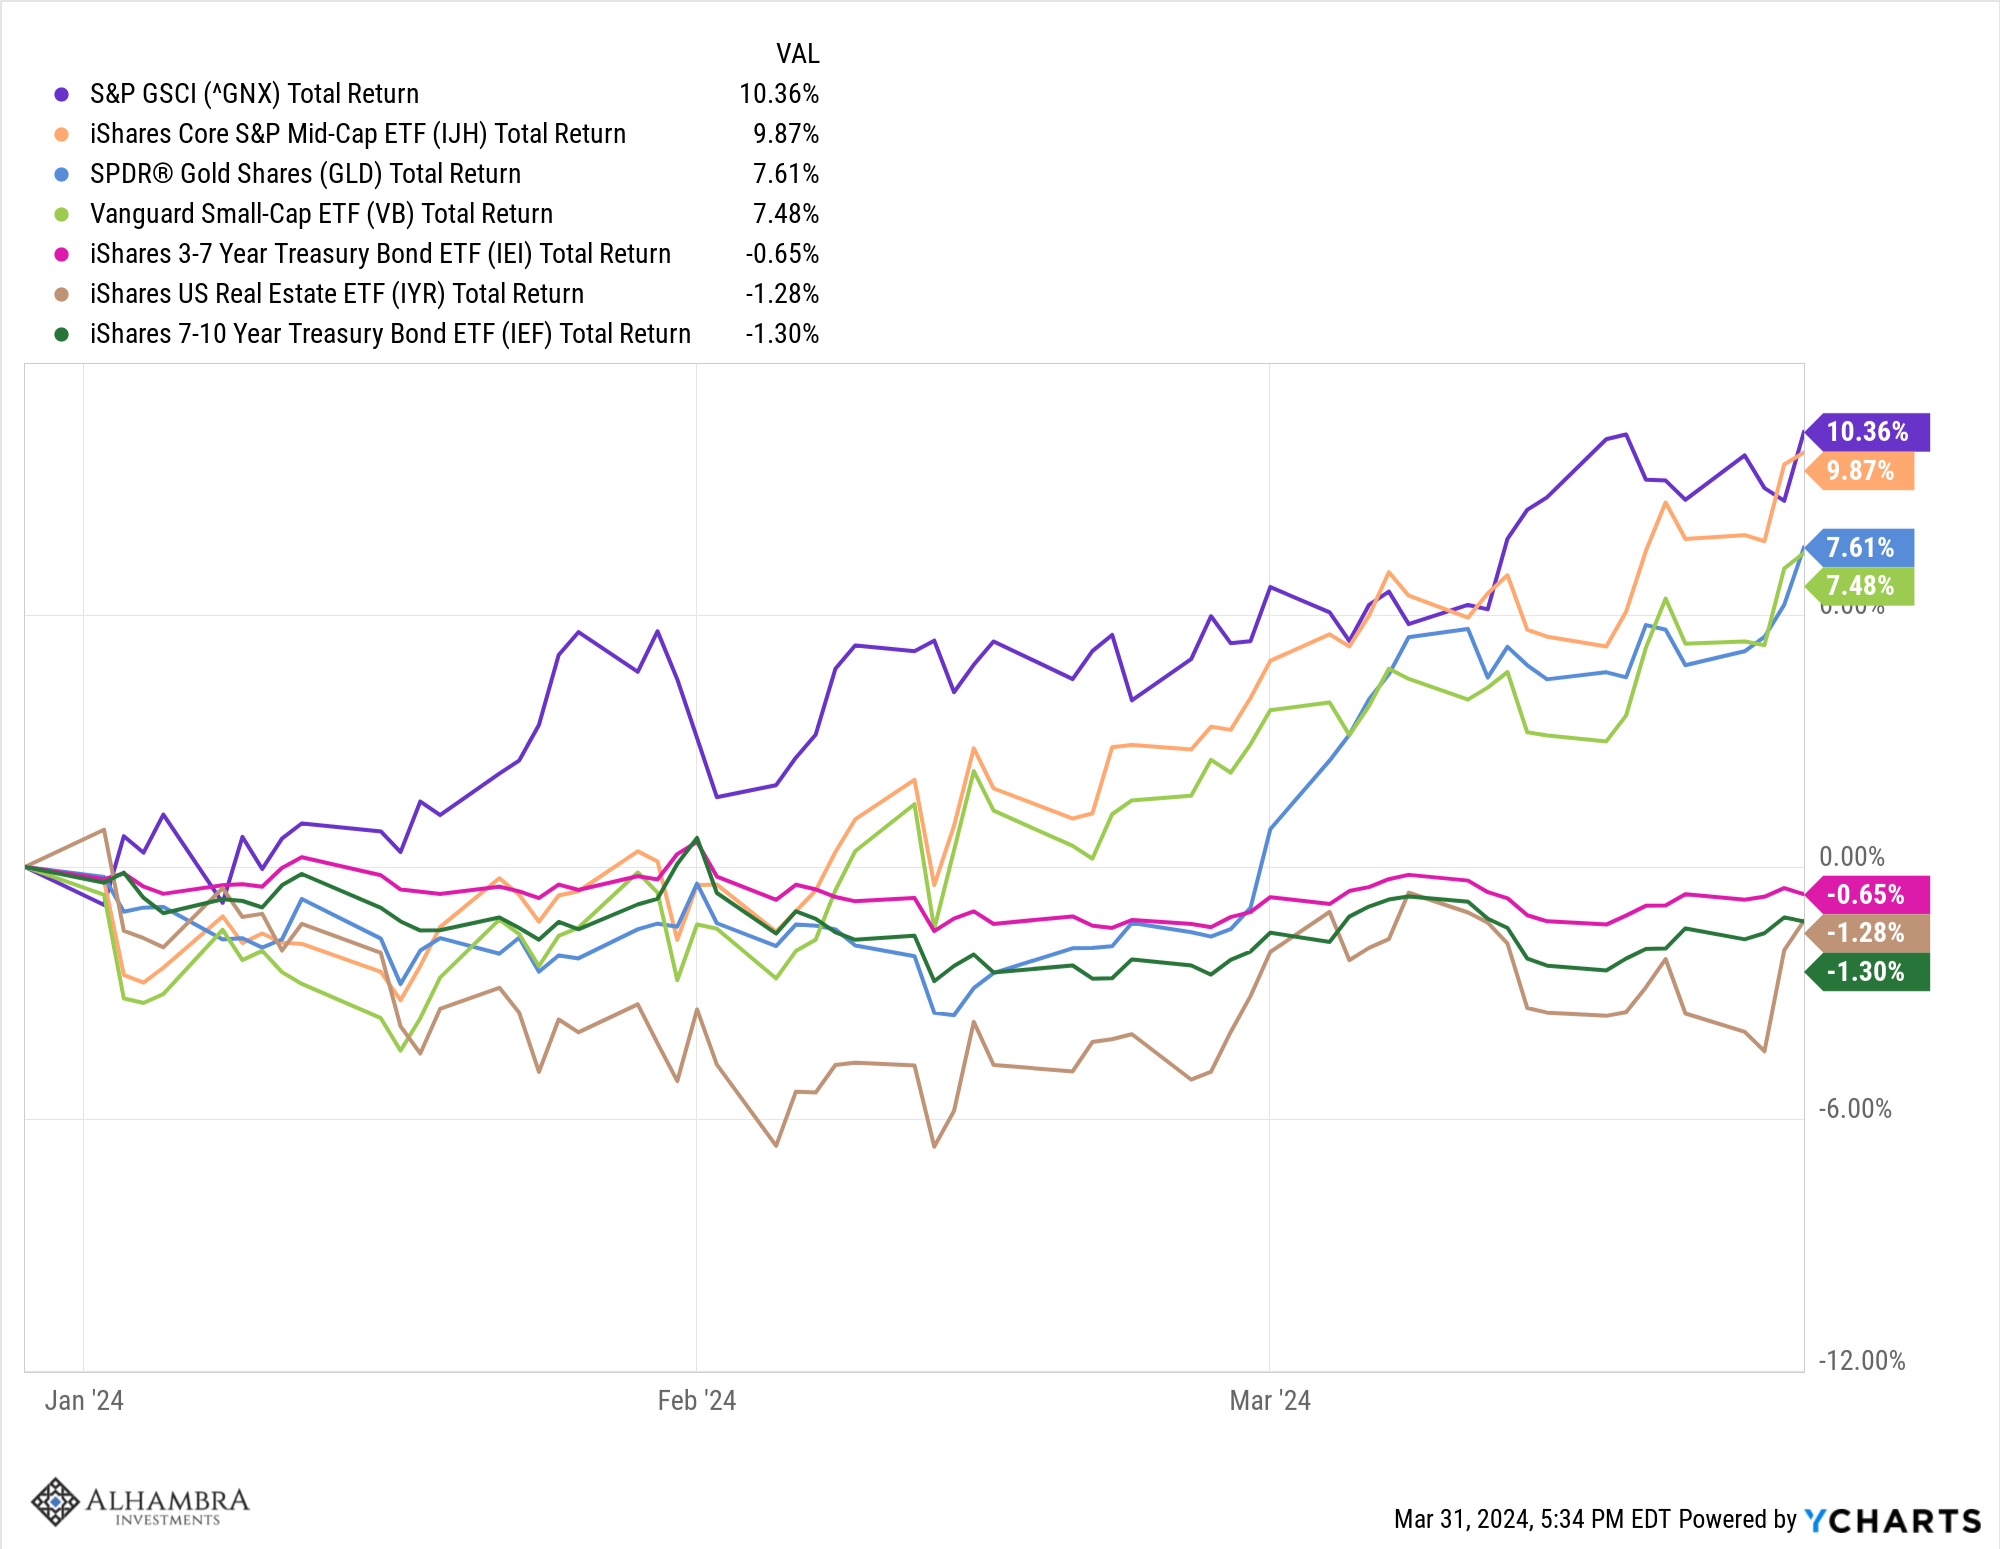
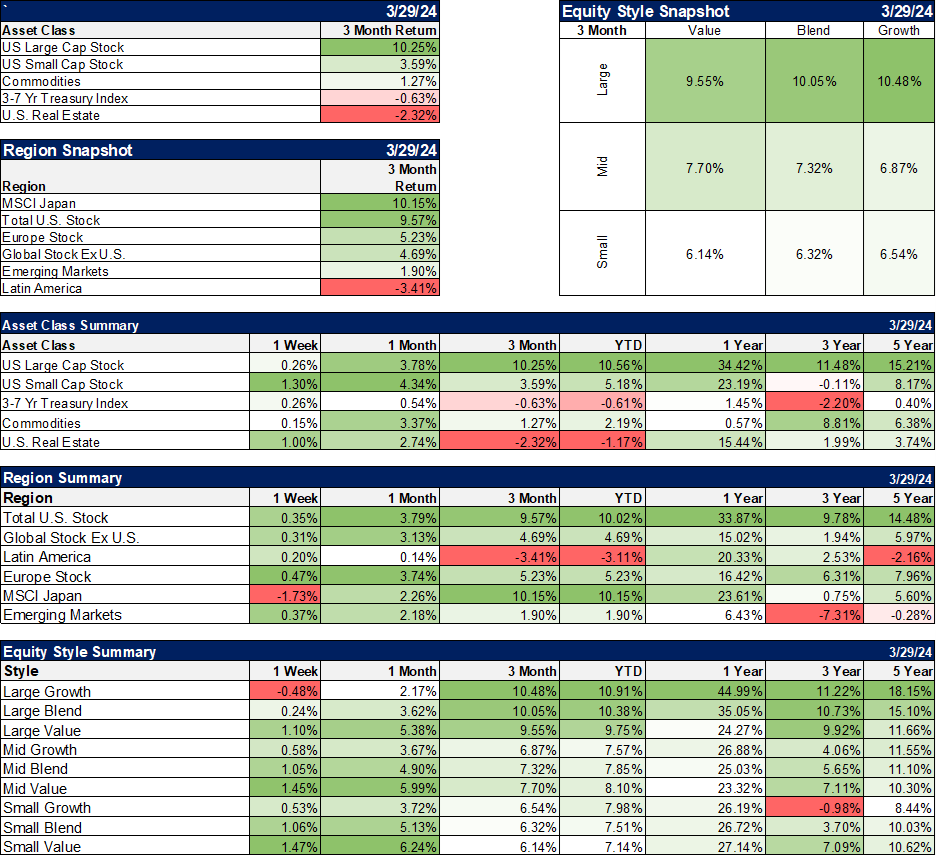
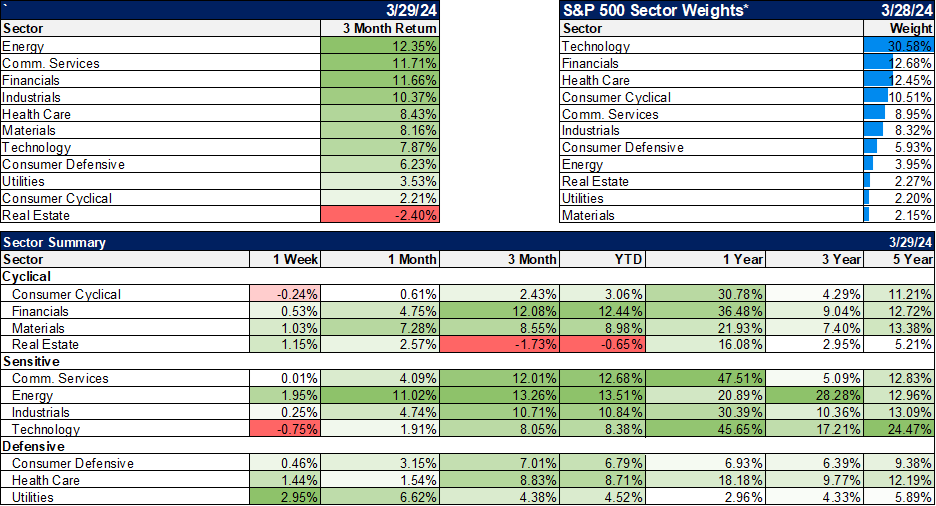
The best performing sectors in the quarter were decidedly not technology but they were magnificent for those who owned them. Energy stocks were the leaders as oil prices rose strongly in the quarter, lower crude oil demand being another consensus opinion taken out behind the woodshed during the first three months of the year. Financials and industrials outperformed as household names like Berkshire Hathaway, JP Morgan, Bank of America, Wells Fargo, American Express, GE, and Caterpillar* all outperformed the S&P 500 and most of the magnificent seven to boot. Digging down to the industry level, homebuilders had another good quarter and insurance stocks handily beat the market. Other asset classes also produced solid gains. Gold and commodities both rose while small and mid-cap stocks also had solid quarters. About the only losers were bonds and REITs, both down in a rising rate environment. Even so, the losses were minimal as the rise in rates was modest.
Asset Class Returns
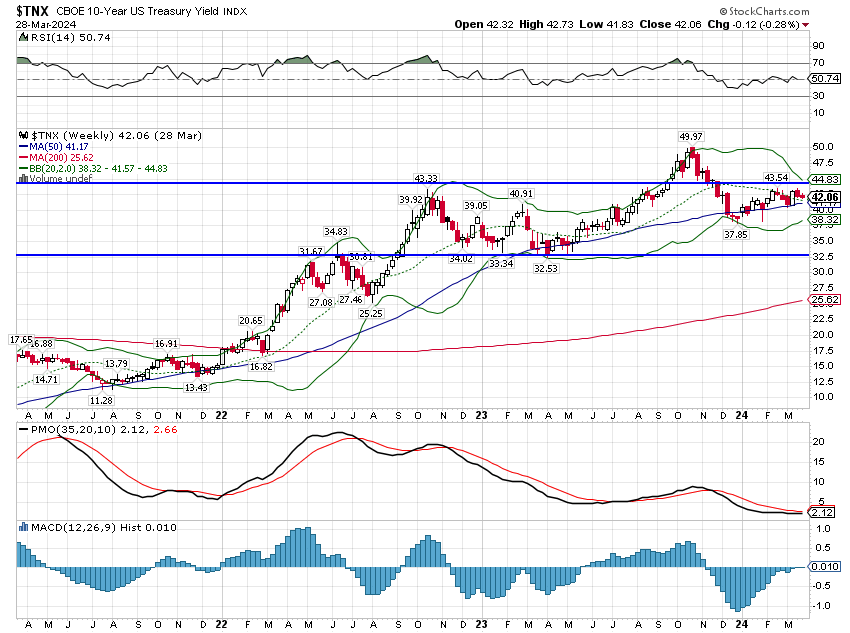
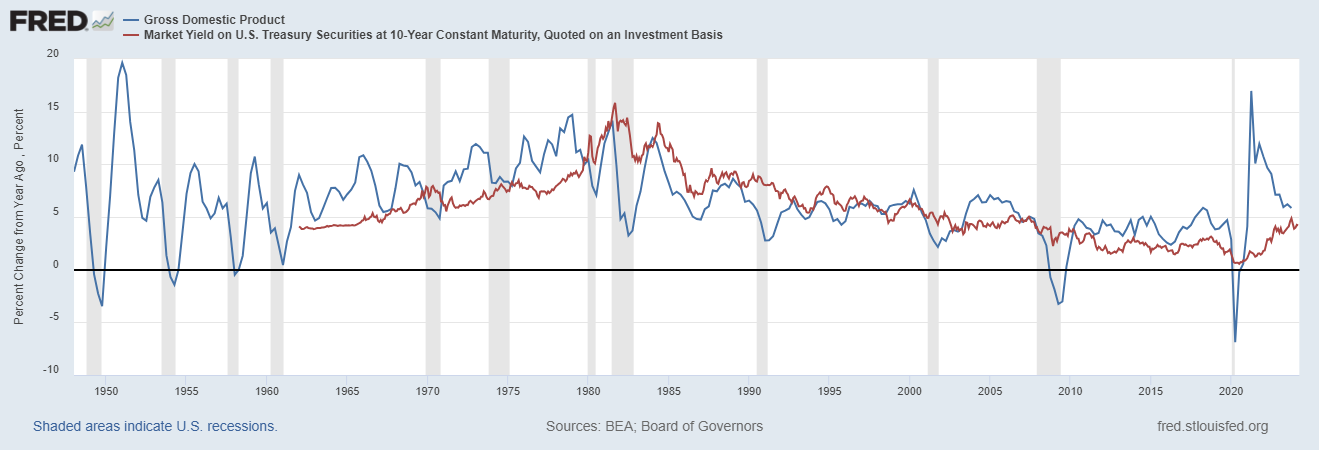
As we enter the second quarter, the outlook for investors is highly reliant on the evolution of the economy for the balance of the year. We watch bond markets for clues about future real growth and inflation. Both the 10-year nominal Treasury yield and the 10-year TIPS yield moved higher in the quarter which means that nominal and real growth expectations both rose during the quarter. Nominal rates rose more though so it was really inflation expectations that rose the most. 10-year breakeven inflation moved up 16 basis points during the quarter and is now at 2.32%. Real growth appears to be rising at about trend as indicated by the CFNAI released last week. The monthly reading rose to 0.05, barely above trend which is represented as 0 in this series. The 3-month average actually fell slightly but at -0.18 shows an economy growing slightly below trend. The current Atlanta Fed GDPNow has Q1 growth at 2.3%, which is a step down from the 4.9% and 3.4% of the last two quarters but still right around the long-term trend of 2%.
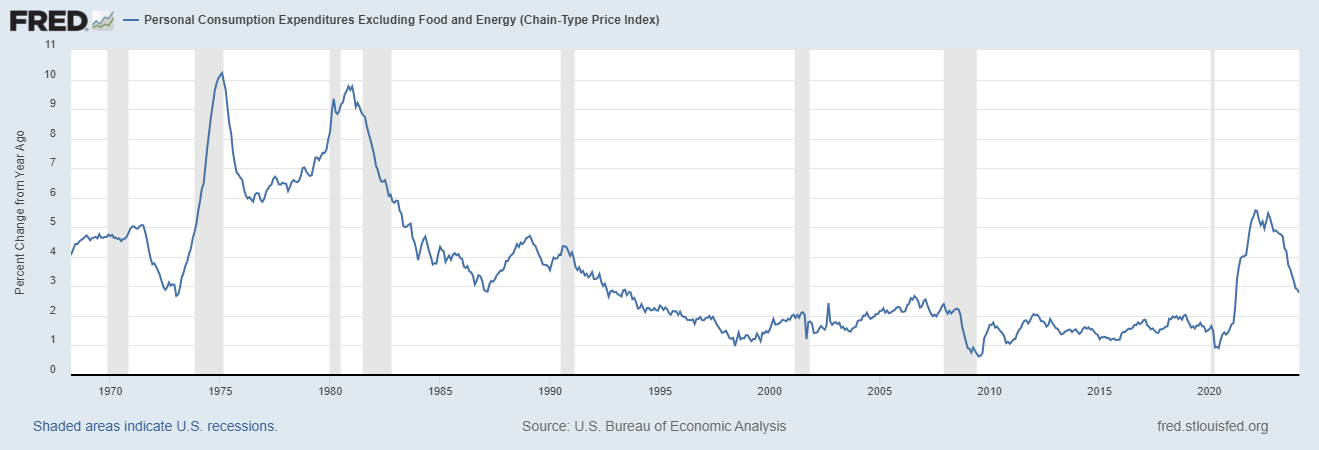
Inflation expectations have risen somewhat because the rate of decline appears to have stalled a bit during Q1. We got the February reading on the PCE price index (the Fed’s preferred measure) last week and while the February readings were about as expected, January’s reading was revised higher. Part of the reason prices aren’t falling as rapidly as they were is the rise in gas prices (futures up nearly 30% in Q1) but the rest of the inflation narrative is basically wrong. The perception is that food and gas prices are causing inflation which not only gets the causation backwards but is mostly wrong. Inflation has been driven since last year by the rise in services prices which are up 3.8% over the last year. Goods prices are down 0.2% year-over-year. Much of that is from durable goods (things that last at least 3 years) which are down 2% over the same time frame, but non-durables (which includes food and energy) are only up 0.8%. PCE prices ex-food and energy are up 2.8% year-over-year, which is still higher than the Fed would like.
PCE prices ex-food and energy
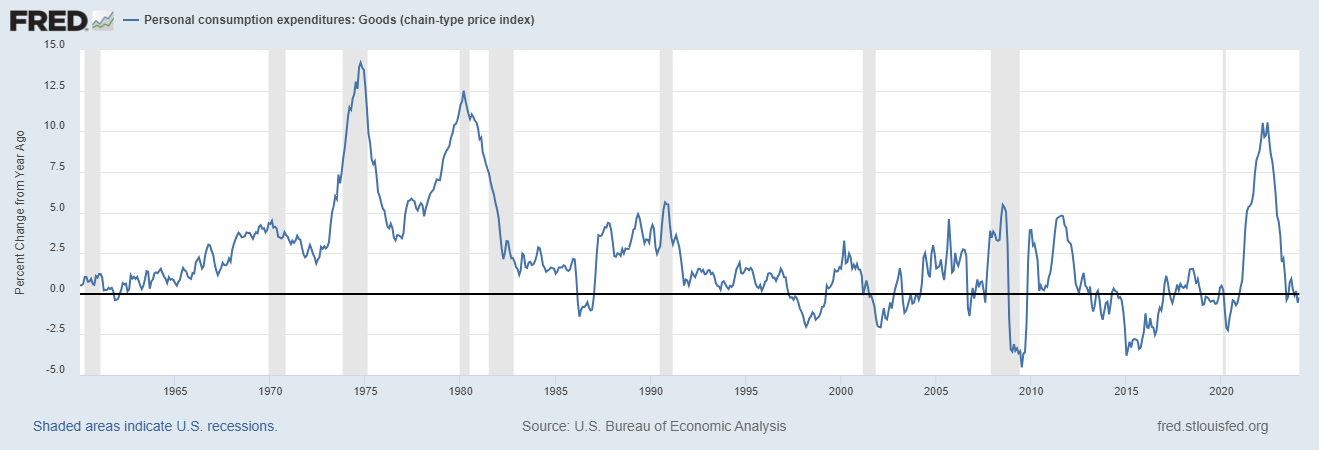
PCE Goods prices
PCE Durable Goods prices
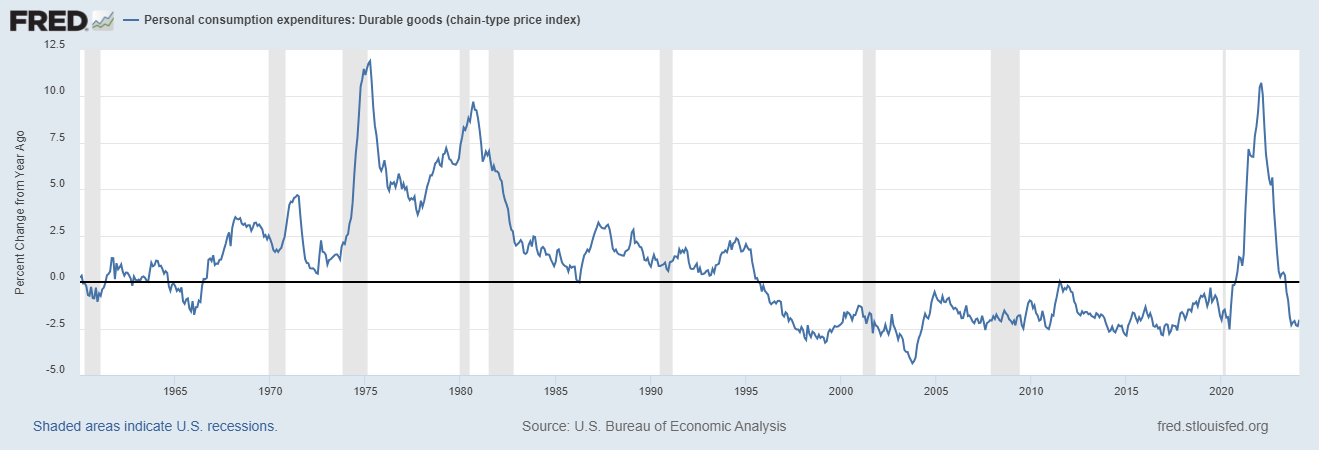
You’ll notice that durable goods prices have been falling since the mid-90s so a return to negative territory is just a return to the normal state of affairs. This trend is long established and likely a function of increasingly free trade after the signing of the first NAFTA. If you want to know the consequences of imposing ever more trade barriers, here is a partial answer. To the degree that goods are not able to avoid or evade the tariffs, prices will rise. But the key to that line of thinking is the avoid/evasion part. We know that China and other countries take action to minimize the impact of the tariffs including moving production to (or routing products through) countries not subject to the tariff. That’s one reason our imports from Mexico and other countries not named China are rising so rapidly. And by the way, China is, right now, ramping up production of goods in an attempt to fill the hole in their economy left by their imploding home building industry. I’d venture to say that goods prices aren’t going to suddenly become a problem.
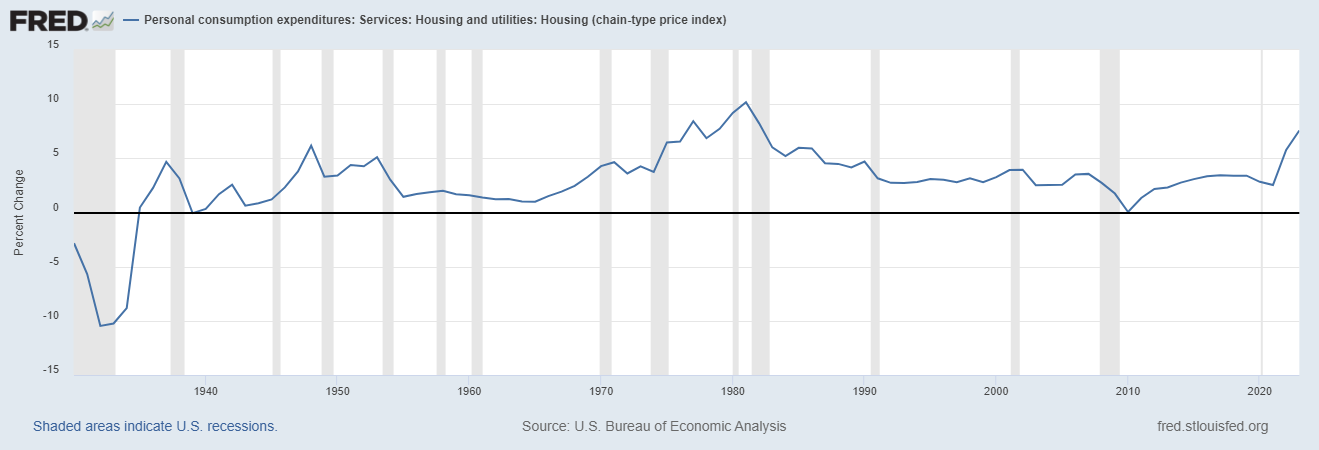
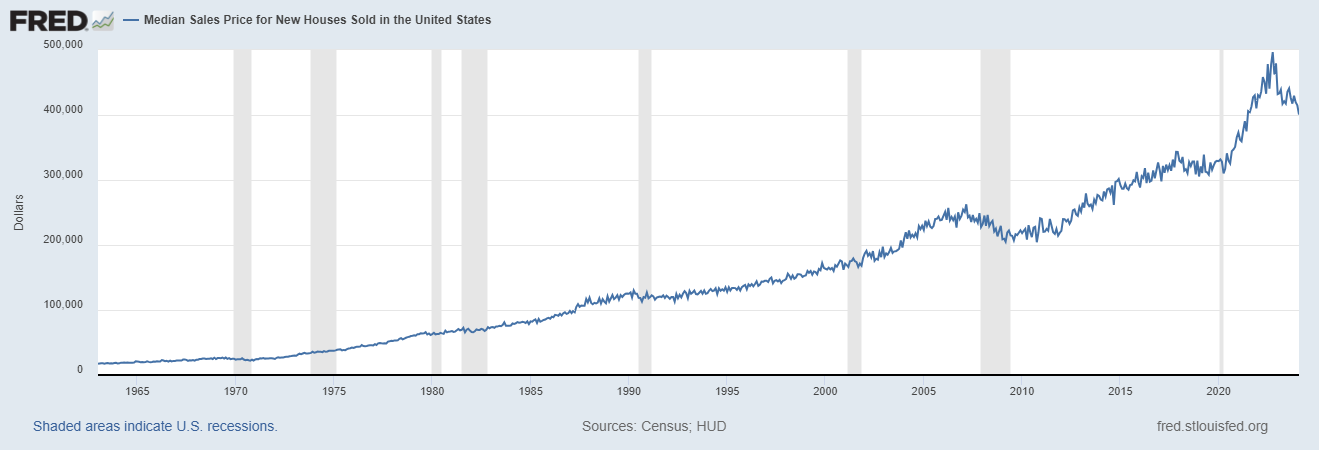
Services inflation is being driven by housing costs which rose 7.6% in 2023. Housing, as reflected in these price indexes, lags the real world and we know that rents have at least stopped rising in most places; in some areas, rents are actually falling. While it takes some time for this to be reflected in the inflation data, it does appear quite likely that services inflation will continue to moderate. We know, for instance, that the inventory of existing homes for sale is finally rising which should help to ease pressure that has kept home prices rising. The Case-Shiller home price index for January, released last week, showed prices falling by 0.1% month-to-month and up 6.6% year-over-year. New home prices are actually down over the last year. The price of the median new home is down from $496,800 in October of 2022 to $400,500 in February of this year. Have house prices peaked? Maybe.
The consensus about the economy now is that it will still slow and the Fed will be able to cut rates at least twice and there is some probability of up to four cuts. I suppose if inflation continues to come down, two cuts might make sense but frankly, I’m not sure the Fed needs or wants to do anything. The current 10-year Treasury rate is about average since 1990 and that includes the period of exceptionally low rates after 2008. This is normal and there is no reason to believe the economy can’t function with normal interest rates. It takes time for people to adjust but they are doing so, even in the housing market, where existing home sales are up 12% over the last three months (through February) and new home sales are up nearly 9%.
There are some early signs that the economy is starting to re-accelerate as production picks up to replenish inventories that have been flatlining for over a year. Personal consumption expenditures, reported last Friday, rose more than expected and the majority of that was due to services, but goods rose too so maybe the nascent recovery in production will catch. If it does and we get better real growth along with a further moderation of services inflation, that would be about as good as it gets for investors. I wouldn’t be shocked by such an outcome but then I’m rarely shocked by anything that happens in the economy or markets.
What’s happened since the beginning of the year isn’t what was expected. The Fed may not need or want to cut rates but that isn’t bad news. The market’s climb wasn’t concentrated in a few stocks and that isn’t bad news either. Nothing went the way the majority expected and yet the diversified investor did just fine. My advice is to keep calm, make no sudden moves, and enjoy it.
Joe Calhoun
*Alhambra or its clients own some or all of the stocks listed.
Environment

The trend of the 10-year Treasury rate hasn’t changed, still neutral, trending sideways since October 2022 except for the brief sojourn to 5% in October of last year. While the consensus is that rates will break lower this year as the economy slows, the economy hasn’t gotten the memo on that. I would expect rates to trade down at some point as the economy nears recession but that doesn’t mean it has to be from these levels; inflation does continue to moderate but real growth has not. The 10-year rate and the year-over-year change in NGDP will eventually converge, probably around 5% but whether that is closer to 2% real growth and 3% inflation or 3% real growth and 2% inflation is impossible to say.
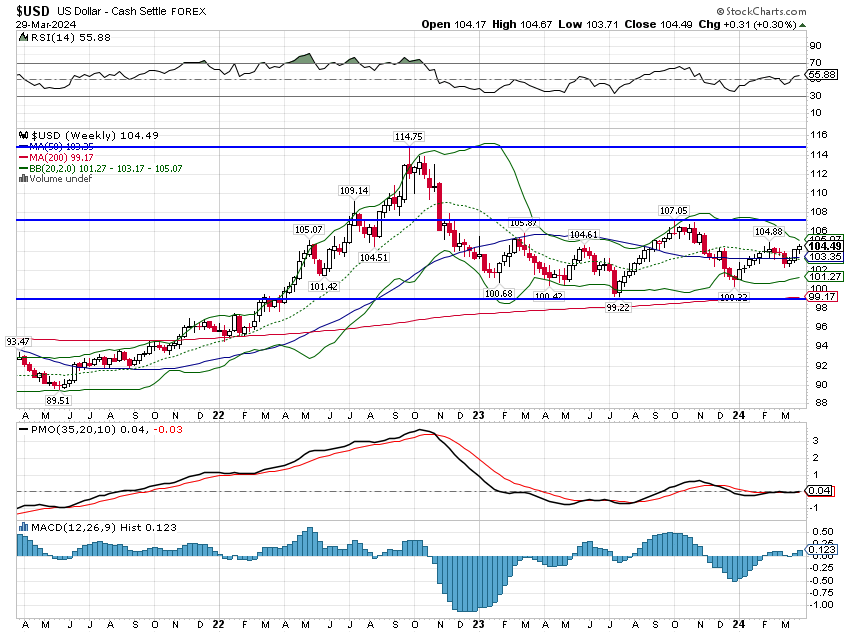
A few weeks ago in my weekly commentary I said that the dollar had resumed its short-term downtrend and it’s mea culpa time. With US economic data staying firm the dollar has rebounded, although still well below last October’s peak at 107. While it appears to me that the rest of the global economy is turning up, so may be the US economy which means relative growth hasn’t really changed much. The dollar, like the 10-year rate, is trading in the range it has been in since November of 2022. A trendless dollar isn’t a bad thing; in fact I would gently suggest that a stable dollar is exactly what the Fed ought to be aiming for but I don’t get a vote on that. From a portfolio standpoint it means the currency is neutral for asset returns; US and Non-US assets can both perform well and that has happened. But US assets still have a comfortable lead over the last year. Until the dollar starts to trend, up or down, there is no reason to heavily favor US or Non-US assets.
Markets
Interest rates were down slightly last week although we don’t know yet how they will react to the PCE inflation figures released Friday when the market was closed. My guess is that the numbers, which were largely in line with expectations, won’t move the market much but one never knows for sure. But for the four trading days of last week, interest-sensitive assets led the pack. REITs were up about 1% and small-cap stocks also outperformed, up 1.3%.
The quarter was still mostly a large cap affair with the S&P 500 up over 10% YTD, beating most everything although Japan was neck and neck. There wasn’t much difference between value and growth in the quarter across all market caps. Bonds and REITs were down in the quarter but the losses were modest and other areas of real estate performed better. Homebuilders and building supply companies and retailers outperformed the S&P, posting mid-teens returns for the quarter. Timber REITs also posted positive returns but in the 3-5% range. Considering that interest rates were up across the yield curve, it’s pretty impressive actually.
Commodities also performed well in the quarter if not quite as well as large-cap stocks. Gasoline was up over 29% while crude oil gained over 16%. Natural gas still can’t find a bottom, down about as much as gasoline was up. The commodity index ETFs were up mid to high single digits while oil stocks were up 13-15% in the quarter. Industrial metals were mixed with copper up a bit and platinum and palladium both down.
Natural gas supply has risen with shale oil production so the latter will probably have to peak before Nat Gas can, although that may not be far off. I would also point out that if electricity consumption continues to grow as the digital economy expands (not even taking into account electric vehicles and such), natural gas demand is going to have to be the fuel of choice for new generating capacity. Solar and wind can’t meet the 24/7 production requirements of a data center.
Gold was up 8% in the quarter despite a relatively strong dollar. Of course, the dollar over the last six months is down slightly so it really hasn’t been the driver of gold.
Sectors
As noted above, energy had a great quarter, beating all other sectors, including technology. Not exactly the narrative out there right now is it? In fact, YTD technology only ranks as the 7th best sector with financials and industrials ranking higher. Communication services, which is essentially another form of tech these days, did perform second best to energy. Again, not the dominant narrative right now. What technology rally there was was confined primarily to the semiconductor sector, which is where you’ll find Nvidia. As an industry, the semi space has a history of being very cyclical, boom and bust so if you think you missed the AI rally I’d suggest just being patient. Nvidia’s high margins today represent a target and someone will hit it. Or maybe the demand for these high end chips will just get satiated at some point before supply peaks. It wouldn’t be the first time we’ve seen something like that in the chip industry.
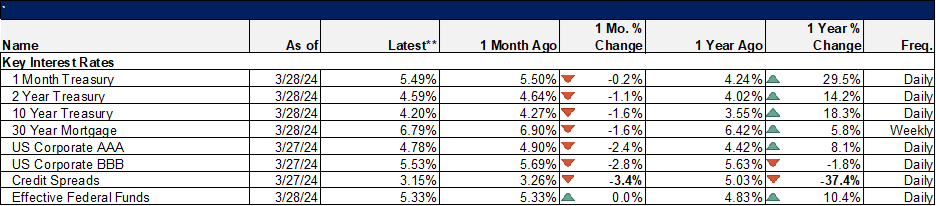
Market/Economic Indicators
Credit spreads recently hit 3.05%, a mere 4 basis points from the cycle low which was lower than any time since 2007. The word that keeps coming to mind is…complacency. Credit spreads narrowing is a good thing right up to the point when it isn’t. Spreads can get narrower still – they’ve been tighter in the past – but at these levels the risk/reward tradeoff seems tilted quite bit in favor of risk. The pickup in yield to buy lower rated bonds hardly seems worth the effort.
Stay In Touch