
Our friend and colleague Eric Hull pointed out that NYSE margin debt was just a hair below record levels in March (the latest figure available), at $379 billion. Eric also noted that the past two peaks in NYSE margin debt have corresponded with 3-5 months of additional “exuberance” (given the persistence of QE’s in this climate, I would argue that “irrational” is once again needed as a qualifier here).
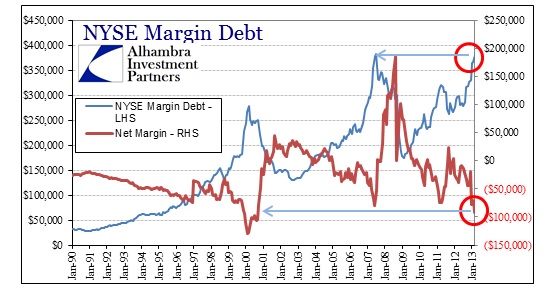
The previous NYSE margin peak was in July 2007 at $381 billion, indeed just a few months before a major market top – with liquidity instability growing between that peak and the ultimate stock price apex in October 2007. To gain a full picture though, we also need to add the “NASD” clearing firms balances as well (I use quotes because there is no distinction now in the FINRA data, however before January 2010 the margin data was segregated by NYSE clearing firms and NASD clearing firms). Historically, margin balances at the former NASD clearing firms were net positive, balancing out the NYSE extremes somewhat.
For example, total margin balances across the whole FINRA firm set also peaked in July 2007 at $416 billion, but net margin balances (margin minus free credit) actually topped out the month before, in June 2007, at -$61 billion. That means that while investors were still borrowing to purchase stocks into the summer, they were also, in the aggregate, reducing risk levels at the same time by beginning to sell and raise cash (free credit).
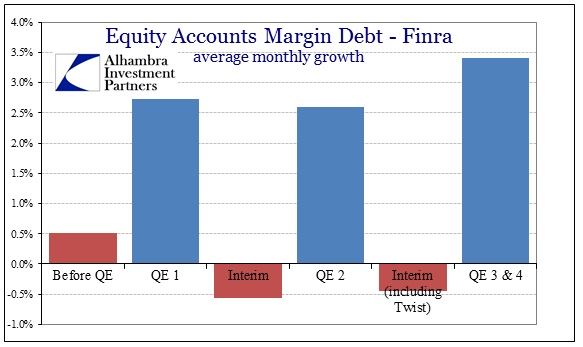
The FINRA data as a whole shows total margin balances back above $400 billion for the first time in March 2013, but the overall growth rate slipped somewhat in February and March. The prior pace of margin debt during QE 3/4 had been about 4% per month. But despite that, overall net margin is actually back at dot-com levels.
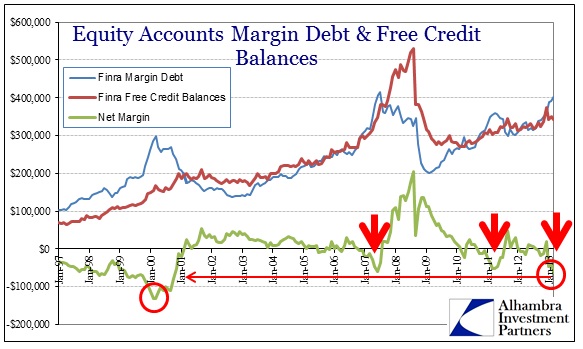
The reason is a decline in cash balances at clearing brokers at both the NYSE and formerly NASD.
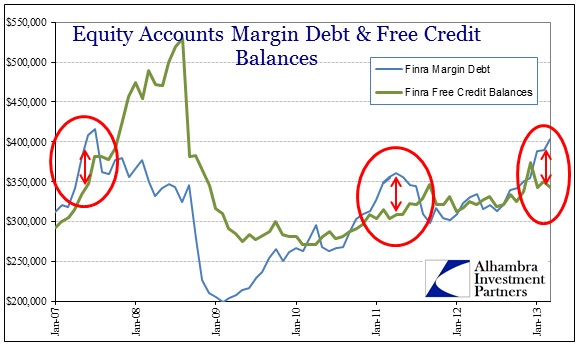
These last few times where we have seen investors pile into margin without a proportional increase in cash have indicated changing market structure (in the first six months of 2007, cash balances increased by $48.5 billion, but margin debt levels rose $105 billion; from the outset of QE 2 in September 2010 until April 2011 when repo collateral tightened, cash balances rose $26 billion while margin debt grew $92.5 billion).
As Eric pointed out, this type of complacency is consistent with exuberance, mania or however you want to classify extreme investor behavior. The driving force behind this bubble-type behavior is also not a mystery, as I pointed out a few months back. Margin debt balances are highly correlated with QE’s, as are stock prices.
How long can this last? If Eric’s analysis is correct, maybe even a few months more.
Stay In Touch