
The potency of QE is theoretically driven by how it is expected to influence economic agents’ perceptions of inflation. The concept of negative real interest rates after hitting the zero lower bound of nominal interest rates (ZIRP) is believed to nudge the behavior of participants in the economy to spend and borrow more as saving becomes relatively more expensive and debt becomes relatedly “cheaper”. So, under the rational expectations theory, QE works mostly by influencing how people perceive inflation in the not-too-distant-future, influencing their actions in a manner assumed to be economically beneficial (since we certainly need more reckless spending beyond our collective means and supplementing that by another run of astronomical debt accumulation).
The dramatic selloff in bonds has been rightfully assigned to nervousness over what the Chairman Bernanke and the FOMC have in store for the pace of QE interventions. The story is vastly different if we look at the treasury market’s implied views on inflation. First and foremost, the credit markets embedded inflation expectations do not at all conform to this idea that the economy is recovering and on track for “normalcy”; in short, QE theory isn’t being confirmed at all.
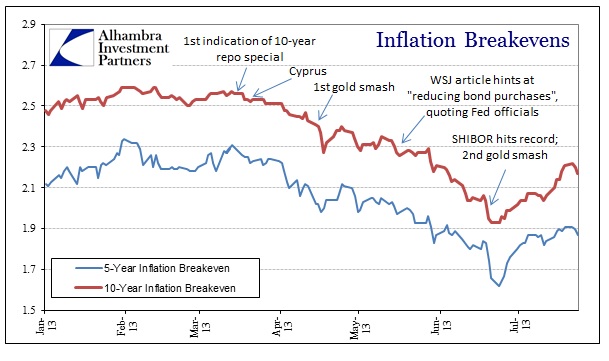
In many ways, the inflation breakevens shown above resemble closely the track of gold prices. Beginning with the first hints of collateral shortage in mid-March, breakevens began to move lower as the credit markets apparently perceived the opposite of what QE-tapering would mean. Throughout the rest of March and all of April, the treasury market moved in the same direction as the assumed “safety” of UST was bid in a slight risk flare.

The direction changed in early May, and then the selloff really began once the idea of “taper” became embedded, first through a seemingly planted trial balloon in the Wall Street Journal. Once the idea of taper gained traction through various Fed speeches and statements, the selloff gained pace.
But that fully contrasts with the breakevens. While the bond market continued to sell, TIPS were sold even faster, producing a decline in implied inflation expectations. That is far more consistent with economic data recently, and, more importantly, the idea of a growing liquidity shortage.
It is also consistent with the bond market pattern shadowing liquidity problems seen in 2008.
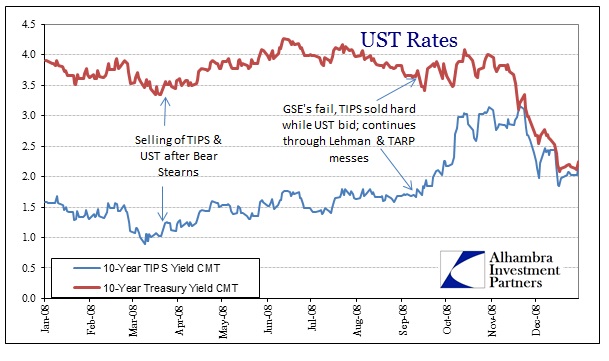
On Monday, September 8, 2008, the 10-year TIPS yield stood at 1.68%; October 14 it was 3.05% (the 10-year treasury yield over the same period sold from 3.66% to only 4.08%).
These are not hints of bond market confidence in economic or liquidity factors, in fact they show just the opposite. Furthermore, this action predated any hints or suggestions of reducing QE intervention rates. And it persisted (in the TIPS selloff) after the turn in US treasuries once taper became embedded. That suggests the bond markets are still susceptible to QE and interventions, but that there are other powerful forces at play that cannot always be reconciled under the central bank umbrella.
The violent action in both the taper selloff and TIPS rout have abated in July, but the action from earlier in the year has not been nearly undone. That would further suggest uncertainty still predominates despite so many persistent assurances that the economy is getting better and QE will not be tapered any time soon (alongside the renewed emphasis that monetary accommodation will remain into 2015).
Click here to sign up for our free weekly e-newsletter.
“Wealth preservation and accumulation through thoughtful investing.”
For information on Alhambra Investment Partners’ money management services and global portfolio approach to capital preservation, contact us at: jhudak@4kb.d43.myftpupload.com
Stay In Touch