
The first half of this year saw a lot of old trends turned upside down. Foreign stocks outperformed US stocks, gold had its best first half performance since 2007 and the dollar its worst start to a year since 1973. It was that year that the Bretton Woods system of fixed exchange rates breathed its last. It had started to come undone 2 years before when Nixon closed the gold window, instituted wage and price controls, and imposed a universal 10% tariff, in what became known as the “Nixon Shock”. The Smithsonian Agreement, signed in late ’71, was an attempt to manage the decline of the dollar but by early ’73 it had failed and the G-10 countries let their currencies float against the dollar – which proceeded to fall nearly 15% by mid-year. Stocks fell too, the S&P 500 down almost 12%, while gold rose 88%. That change, from fixed exchange rates and a qausi-gold standard, was a dramatic and radical change.
Are the changes being sought by President Trump as radical as those of the Nixon era? I don’t think we know yet but we may get a clue this week when the reciprocal tariff pause ends Wednesday. The Vietnam “deal” announced last week – which Vietnam says is still being negotiated – was touted as a win by President Trump but if a 20% tax on imports is a win for someone, I’m not sure who it is. There are no tariffs on US exports to Vietnam but with a per capita GDP of less than $5000, they aren’t going to buy much. The 40% tax on transshipped goods from China is also not a good sign. Will we be charging tariffs based on the Chinese content of a product? I can’t imagine how complicated that would be and how companies would plan for it. Adding complexity to trade is just a more sand thrown in the gears of commerce.
The president also said his administration would start informing countries of their new tariff rates over the next few days – 90 deals in 90 days was a pipe dream – and that “(b)y the ninth they’ll be fully covered. They’ll range in value from maybe 60 or 70% tariffs to 10 and 20% tariffs”. A “60 or 70%” tariff is tantamount to an embargo so I do wonder which countries might warrant the economic equivalent of war. Of course, whatever gets announced Wednesday is unlikely to be the final say on tariffs – they won’t start until August 1st in any case – but that just means the bewildering uncertainty will continue. We’re going to start getting earnings reports for the 2nd quarter soon and I can already predict company guidance for the rest of the year – we have no idea.
The ’73/’74 bear market was a bad one. From the beginning of 1973 to December 6th 1974, the S&P 500 fell 45% while gold rose 170%, but markets don’t move in a straight line. At the mid-point of 1973, everything was going in the wrong direction but it was only a few days into the second half that markets started to turn. From July 6th to July 26th, the dollar stabilized, gold fell 6% and stocks rallied nearly 8%. Gold continued to fall in August as the dollar rallied 4% but stocks retested their July lows. Stocks turned higher again and by the end of October, the S&P 500 was only down a little over 5% for the year although the dollar was still down 14% and gold was still up 50%.
That proved to be the high for stocks as the oil embargo and Watergate took center stage; the S&P 500 didn’t exceed its January 1973 high until 1980. The point here is not that we are about to repeat the ’73/74 bear market but that even in times of radical change, markets can and will surprise you. I can’t tell you what President Trump will do with tariffs this week except to say that there will be some surprises. What worries me is that these trends from the first half are all very extended, with sentiment to match. Everyone is negative on the dollar. Everyone is talking about how much International stocks have outperformed. Everyone is talking about how much higher gold can go. Some of these trends have already corrected some but no one seems to notice.
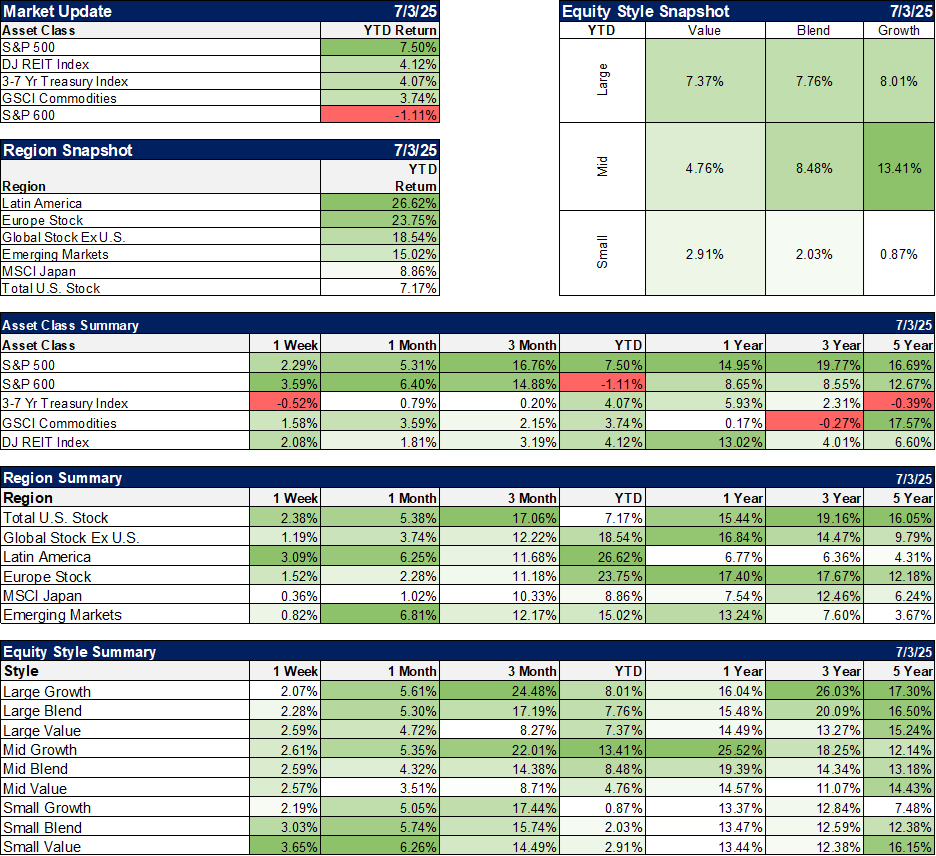
Since April 21st, the S&P 500 has outperformed EAFE by about 9% (22.1% vs 12.9%) and Europe by 7%. Gold peaked at the same time and is down 5% from its intraday high while the dollar is down less than 1%. As for US stocks, at new all-time highs, one can hardly call sentiment subdued. Put/Call ratios are very low and the Volatility Index (VIX) is back near its pre-liberation day lows. Last week’s American Association of Individual Investors poll had bulls at 45% with a bull/bear spread of 11.9%, the widest gap since inauguration week in January. Those are all signals that sentiment is getting overly bullish, that investors are overly confident. For sure there are other signs that aren’t so extreme but sentiment is definitely in the ebullient range.
The market movements in the first half of the year were somewhat odd in any case. The drop in the dollar and the rise in foreign stocks makes little sense with the US about to impose large tariffs on the rest of the world. One would logically expect foreign markets to get hit on the loss of exports to the US and economic orthodoxy says the dollar should rally if we impose tariffs on the rest of the world. Will that be the response to whatever is announced Wednesday? Was the pause just a reprieve? Are we at a crossroad? Will the trends of the first half prove fleeting?
I was told a long time ago, when I got in this crazy business, that I shouldn’t waste my time worrying about things everyone else was fretting about. Those things are already “well worried” as he put it. The implication of that is two fold. One is that whatever everyone is worried about is already priced into the market. The other is that what we ought to worry about are the things no one else is concerned about, the dog that isn’t barking, so to speak. With stocks at all-time highs, investors don’t seem all that concerned about anything. With some potentially radical changes coming for the global trade system, that ought to worry you.
One last thought on market sentiment. Last week, Congress passed the Invest America Bill, sponsored by Sen. Ted Cruz. This bill establishes tax deferred accounts of $1000 for every American child at birth (December 31, 2024 to January 1, 2029). The bill lists only one eligible investment for these accounts – the S&P 500. I may have never seen a more obvious sign of a market top in my entire 34 year career.
Joe Calhoun
Environment

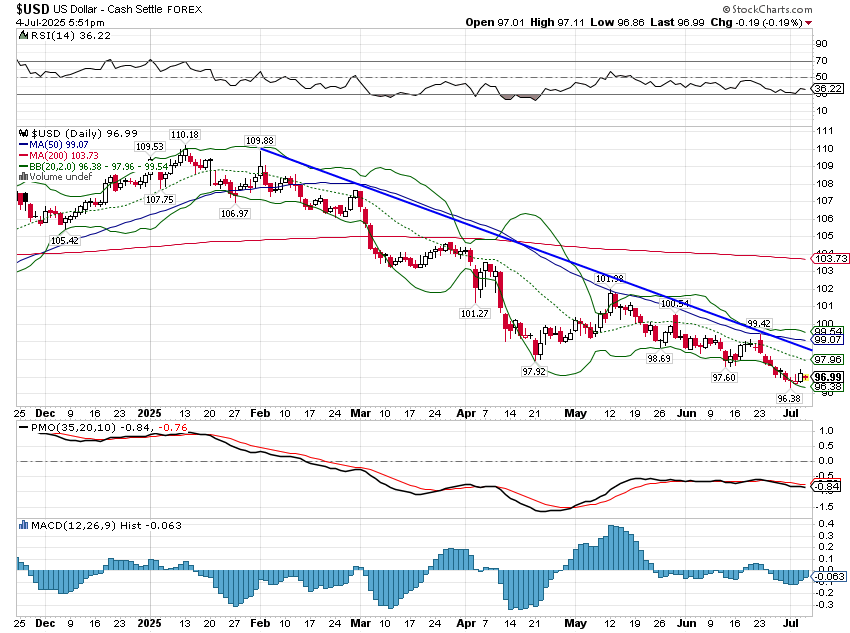
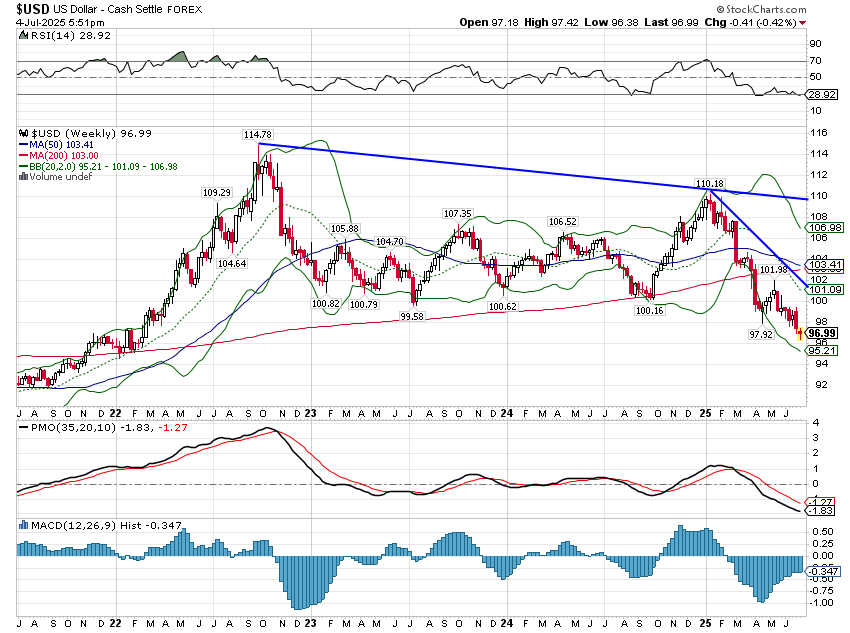
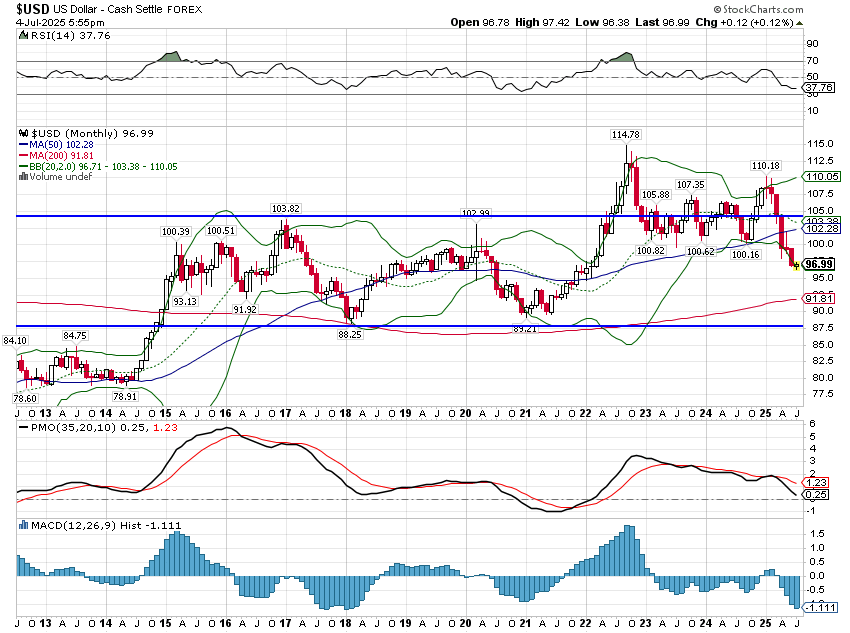
The US dollar is in a downtrend and I think we can dispense with the “short term” as it is now negative over a five-year period. It is a weak downtrend though and I continue to believe a countertrend rally will develop soon. Sentiment is so bearish that any news construed as dollar positive could easily push it up by 5%. The longer term target for this downtrend is now around 90 with potential to fall to 87.5; a countertrend rally would only delay that reckoning. What works in a falling dollar environment? That depends on growth too but in general: gold, commodities, non-US stocks, emerging market stocks, materials stocks, TIPS and high quality stocks have outperformed in weak dollar environments in the past. Some of those are already working, others are not yet.
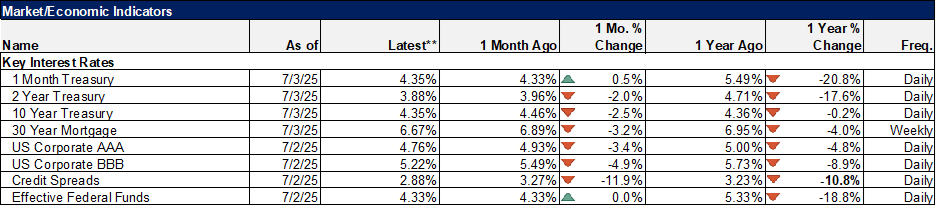
10-year Treasury yields rose 10 basis points last week and remain in the upper half of the previous range that has persisted for nearly 3 years. The soft uptrend I noted last week is intact but the more important factor right now is that rates remain range bound, indicating little change in nominal growth expectations.
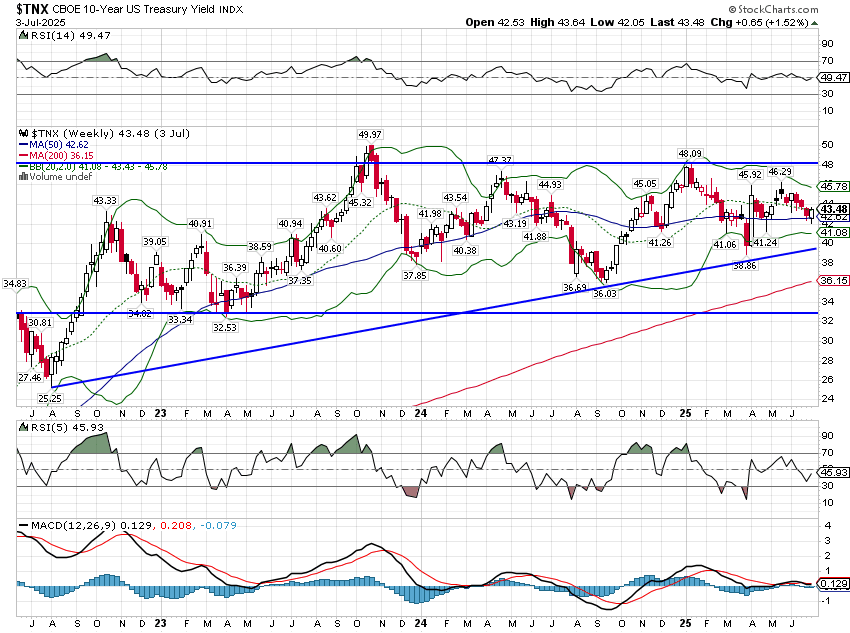
2-year Treasury yields rose but only by 2 basis points and is also still in its previous range. Unlike the 10-year, though, the 2-year yield is in the bottom half of it’s range.
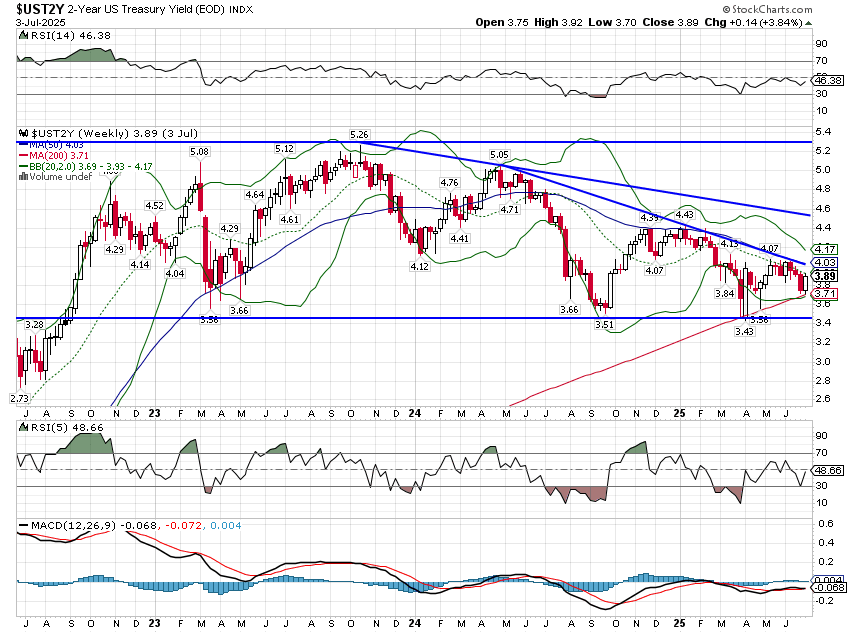
The 10/2 yield curve steepening has stalled and with the 2-year yield softer than the 10, that means real growth expectations have fallen slightly.
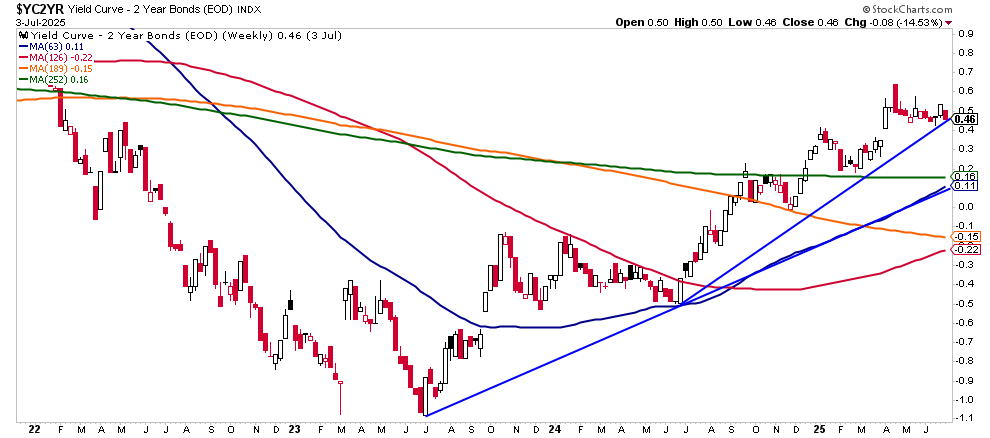
The 10-year/3-month curve, by the way, recently reinverted for the second time this year (the first was coincident with “liberation day”). Again, this is an indication of falling real growth expectations. An inverted curve is correlated with slower future growth.
Confirming that weakening of real growth expectations is the 10-year TIPS yield, now down 34 basis points since peaking right before the inauguration.
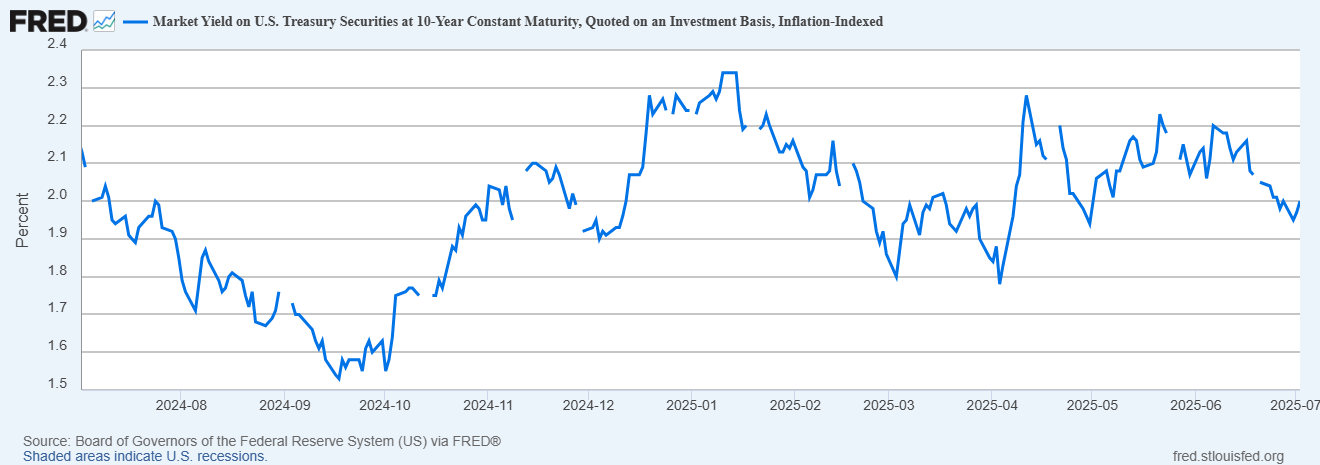
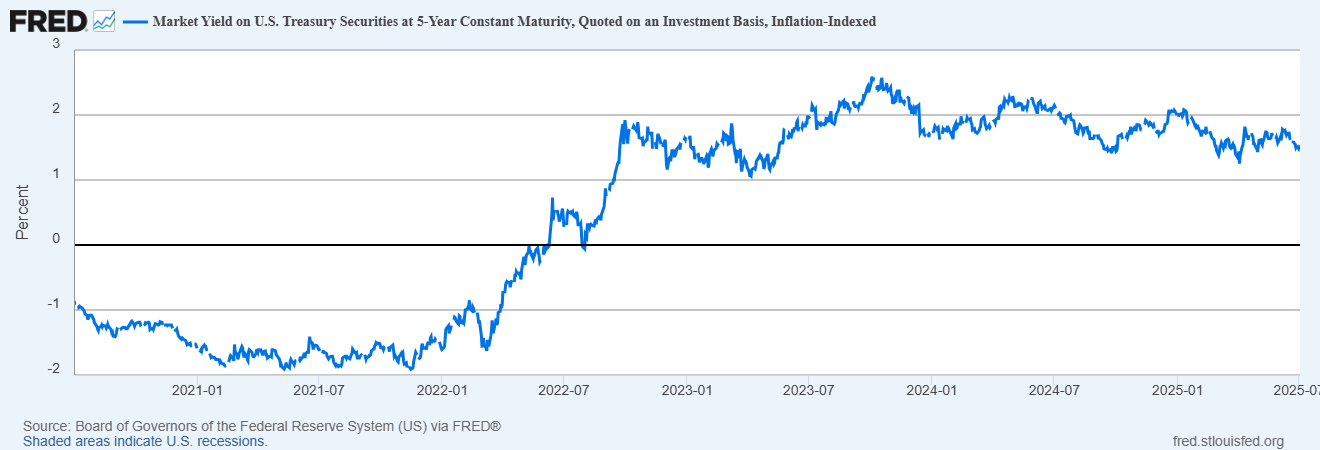
TIPS yields actually peaked all the way back in October of 2023 and the five-year version is down a full 100 basis points since then. Growth expectations have been waning slowly for the last 20 months.
Markets
Stocks had a good week with small caps outperforming in the holiday-shortened week (the numbers below are for the previous five trading days) although they are still down YTD. Small cap stocks were hit harder on “liberation day” and have not recovered as well. At the end of June all the small cap indexes were still trading below their 12-month moving averages, which we use as an up/down trend indicator.
International stocks continue to beat domestic shares by a wide margin. It will be interesting to see what happens next week when the administration reveals its tariff schedule. With the budget bill passed and the tariffs mostly settled next week, it may be a “buy the rumor, sell the news” type event. I would not be surprised at all to see a dollar rally and a correction of some kind in all stocks. Sentiment has gotten very frothy over the last couple of weeks with FOMO overriding any concerns about tariffs or, well, anything. Still, while growth expectations have waned a bit, I don’t think a correction would be signaling anything economic, at least not yet.
Growth/value trends are mixed with large and mid-cap growth leading and small cap value ahead. However, the gap between large value and growth is narrowing YTD and over the trailing one year. Over the five-year period, mid and small-cap value are ahead of growth and large value is catching up rapidly. With most people focused on shorter term 1 and 3-year periods, the value outperformance over the last 5 years has been a bit under the radar. If large cap value starts outperforming over shorter periods, attention is likely to shift.
Sectors
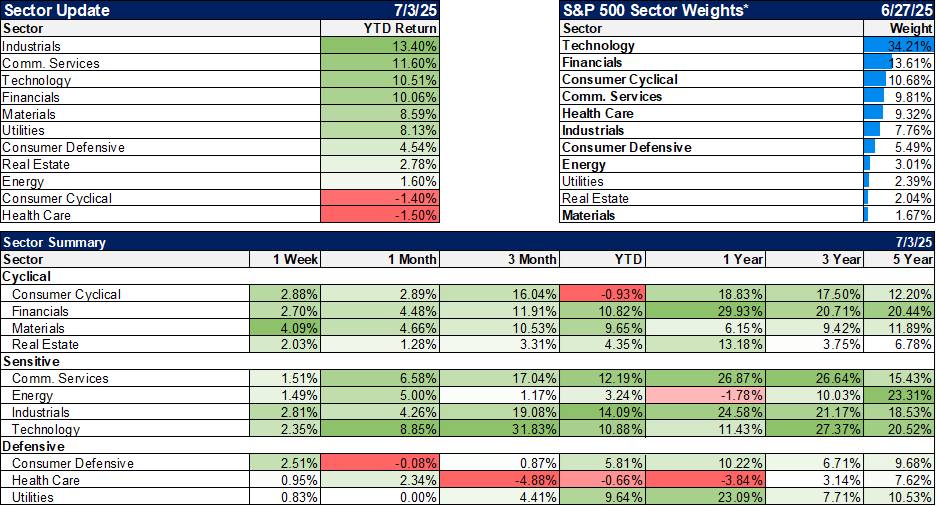
Not much change in the sector rankings with industrials, communication services and tech still leading the way. In communication services it is interesting to sort the components. Netflix is the leader YTD up 45.5% (and also leading over 1 and 3 years and #4 over 5 years) and META is in the top 5 but the other names at the top of the list are a little surprising: TakeTwo Interactive, AT&T and Paramount round out the top 5 while Charter, Fox, Live Nation, Newscorp and Verizon round out the top 10. What’s missing? Alphabet (Google). It isn’t in the top 10 for 1 year either and is 10th over 3 years and 6th over 5. The market doesn’t seem to be putting much value on Waymo or their AI ops. Interesting…
Economy/Market Indicators
If you want to see how frothy sentiment is look no further than credit spreads below. The high yield spread to Treasuries is nearly back to its inauguration day low. There is absolutely no fear in credit markets.
Mortgage rates have fallen some recently and refinance activity has picked up a little. But the spread to the 10-year Treasury hasn’t budged and rates are still elevated. No signal for the housing market yet.
Economy/Economic Data
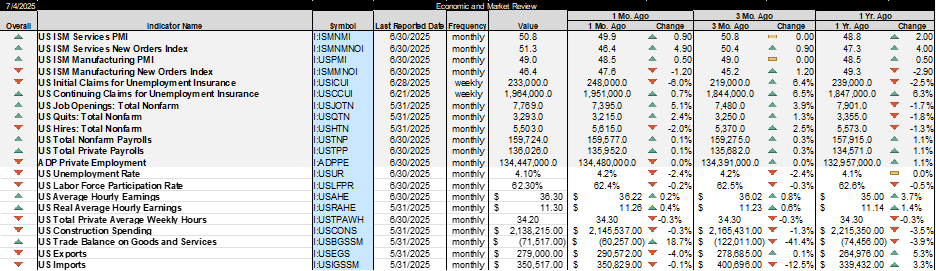
The employment report was reported as better-than-expected but the details weren’t as positive. Of the total of 147k new jobs reported, only 74k were private, with the rest in state and local government. 63k of the state and local government jobs were in education which is likely a seasonal adjustment issue. Teachers are normally off in the summer but the timing this year had them still at work. You’ll likely see a big drop in those jobs next month. In the Household report, the only thing notable was the drop in the civilian labor force of 130k for the month and 755k since April. The labor force is still up for the year but that recent drop is worrisome. The drop is all in the foreign-born labor force, down 1,144,000 since the March peak. I don’t want to put too much emphasis on this yet because it is with the bounds of recent trends but a drop in the labor force is going to have a direct impact on real economic growth. Remember, economic growth is labor force growth + productivity growth. The immigration impact on the economy may be quicker and deeper than the impact of tariffs.
Other economic data for the week:
- The ISM services index rose back above 50 after one month below. More importantly the new orders index rose strongly from 46.4 to 51.3. Still some concern here though as the year over year services consumption rate has fallen to 1.7% from 2.7% a year ago.
- The ISM manufacturing survey was up too but is still below 50 at 49.0. New orders fell from 47.6 to 46.4. Manufacturing employment was down in payrolls report too. Check the export figures for a clue as to why.
- Job openings rose on the month, up 5.1% but still down over the last year by 1.7%. Good news but hires in the same JOLTS report were down.
- The trade deficit worsened by nearly 19% to $71.5 billion. This time it wasn’t because of tariff frontrunning like we saw earlier in the year. Imports were down 0.1%. The real culprit was exports which were down 4%. I don’t really know why this administration finds this so hard to understand but if you reduce imports you will necessarily reduce exports too. Why? Because other countries get the dollars they use to buy our exports from the exporting their stuff to us. Tariffs will not eliminate the trade deficit unless you cut off all trade. We’d probably be in a depression but at least we’d be rid of that pesky trade deficit.
Stay In Touch