Next month, in the durable goods series, the Census Bureau will release the results of its annual benchmark changes. In May 2019, the agency will revise the seasonal adjustments going back to January 2002. Unadjusted data will not be, well, further adjusted.
None of this, apparently, will include any information gleaned from the comprehensive 2017 Economic Census. I haven’t closely followed the progress of the latter, though it does seem to me to be taking longer to wind its way into the government’s data stream than in the past. The full data won’t be made available, at least to the public, until later in 2021 – just in time for the 2022 Economic Census to begin.
In short, there are revisions coming. Which way they ultimately go, or if they don’t change much at all, we can’t really say for sure. In the past, the 2012 Economic Census was a huge blow to the “recovery.” What followed from it was years of downgrades, what looked like a semi-momentous uptick in growth that just sort of disappeared into 2015.
And what happened in 2015 was upgraded from at first a “transitory” annoyance years later into a full-blown, obvious manufacturing recession.
I tend to believe we are going to see something similar based on what’s going on right now. Why should we expect Euro$ #4 to be so different? It is a lot like 2015 all over again, especially outside of durable goods. In this particular economic series, what’s being measured is at the very least interesting as well as unique.
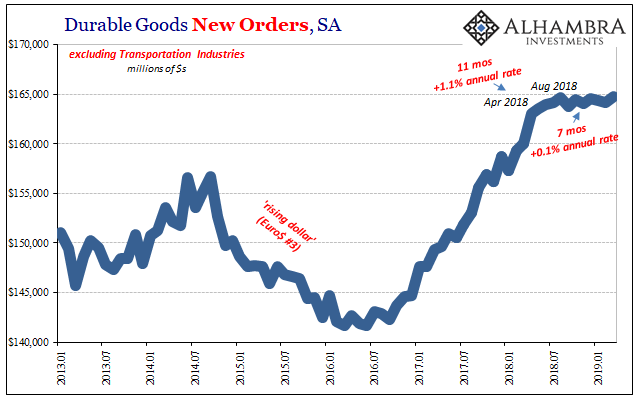
According to the current set of benchmark assumptions, new orders for long-lived goods placed outside of transportation industries have flatlined. Obvious sideways. This is very, very unusual.

The bend in this direction began, when else, in May 2018. The full exhaustion of what leftover momentum followed in September (not hurricanes). Since August 2018, a period covering now seven months with these advance durable goods estimates for March 2019, durable goods seasonally-adjusted have hit almost a perfect zero. Just slightly positive, rising about one-tenth of one percent at an annual rate.
You just don’t see something like this, which suggests, to me, revisions are coming. Are they likely to be much better, perhaps, some hidden economic strength which will be teased out of more comprehensive annual surveys (of seasonal adjustments)? Surprising no one, I’m quite skeptical. I don’t believe durable goods have flatlined, either.
This doesn’t mean the series would show recession, rather like 2015 I would guess there is more of a downward skew here than is currently being projected. But that’s something for the coming months.

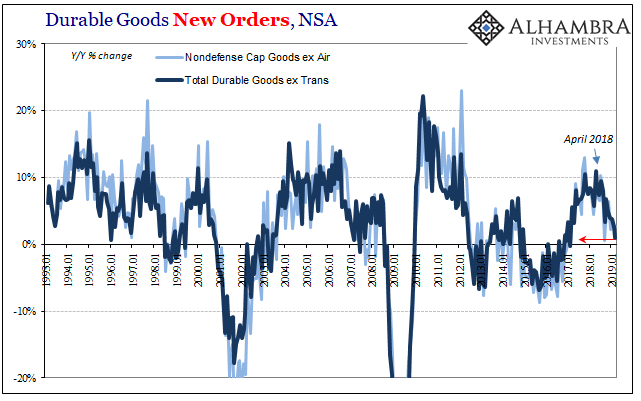
In the meantime, unadjusted, durable goods orders were up all of 1% year-over-year in March, down from 2.6% in February. March’s was the lowest rate since February 2017. Shipments gained just 1.9% year-over-year last month, down from (revised) 4.2% the month before. The direction is by now pretty well-established.
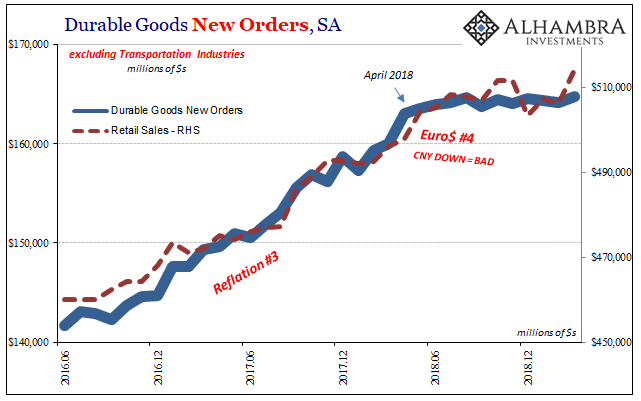
And it is corroborated by any number of other contemporary accounts, most notably retail sales. Consumers suddenly become more cautious about their spending, factory orders including both durables and non-durables weaken as inventory piles up, all “unexpectedly.”

For these reasons, you can appreciate why bond markets have behaved the way they have. The yield curve as well as eurodollar futures project now only rate cuts, figuring only when rather than if for them, simply because despite official protestations that things will pick up, they haven’t. Not for the first time, we’ve heard about “transitory” weakness perhaps once too often.
Nor does it seem like this year’s sharp “dovish” U-turn has made any difference. You might presume lags with a monetary policy shock, but outside of stocks (factoring in more of a punchbowl that doesn’t really exist) curves are following what is right now sideways.
Even should sideways stick through revisions, sideways is not growth. And seven months is a very long time to have gone without it.

Stay In Touch