
Where’s the global economic meltdown? We’re 3 months into a war with Iran, the Strait of Hormuz closed. 20% of global LNG is shutdown for the next 3 years, 20% of global crude oil production is being affected, 30% of global fertilizer supply is shut off, and roughly a third of global helium supply is bottled up in the gulf. Asia and Europe (to a lesser degree) take the brunt of the damage but the US isn’t immune from these supply chain disruptions. And yet…the global economy seems to be coping just fine, at least so far. The US economy in particular seems to have been almost unaffected except for the price of gas, although one can’t run the counterfactual. Is there a tipping point where the closure of the strait causes greater problems? There are a lot of people making that claim but I’d be careful assuming anything. Markets find a way and the global economy is already adapting to a world where the strait stays closed.
When I review the US economy today, what I find is not a booming economy as Republicans claim or one that is obviously failing as Democrats seem to believe, but one that is so average it fades into the background. The US economy is growing at trend. It is growing at the long-term average. It isn’t great, it isn’t terrible. There are problems in the details but most things are just fine in aggregate. Inflation is higher than younger generations are accustomed to but feels pretty normal to old dudes like me. Real growth – despite all the hype around bitcoin and AI and the shale “revolution” and Web3 and blockchain and the “app” economy and the gig economy and 3D printing and the metaverse (I can’t believe people fell for the VR hype again) – is trending at the same 2 to 2.5% annual rate that has prevailed since 2010. And 2000. And 1990. And 1980. Yes, a few detours along the way like the crash of ’87, the S&L crisis, the dot com boom and bust, the financial crisis of 2008, the Euro crisis in the early 2010s, and COVID. But always back to the trend.
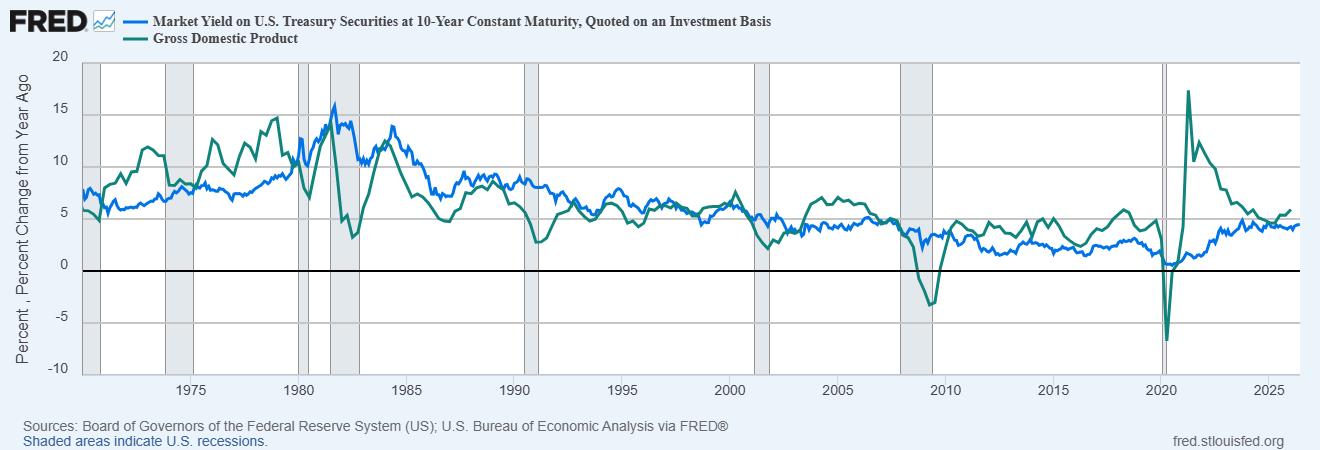
The markets we watch for clues about the economy all confirm this averageness. Interest rates, nominal and real, have been trading in a fairly narrow range for three years. The 10-year Treasury note yield is just 25 basis points above the average since 1990. The dollar is trading within 3% of the average since it started to float in 1972 and is unchanged since the beginning of 2016. Call it average, call it mediocre, call it what you want but this is the US economy. It goes through short periods of higher than average growth and it goes through short periods of below average growth and it goes through long periods of…average, dull, 2.5% growth. The average year-over-year change in real GDP since 1980 is 2.6%; the change over the last year was 2.6%. The average over the last 3 years is…2.6%.
There are some signs we may be on the verge of one of those above average periods but it is far from assured with uncertainty the only certainty of the second Trump administration. There have been some positive signs in the labor markets with job openings up 16% YTD and almost 6% over the last year. The quits rate is still falling so anxiety still stalks the working class but more job openings – especially when the fear is that AI will replace us all – is good news. That AI is adding jobs and creating job openings should not be surprising. That is normal for new technological developments and this one probably won’t be different. New business applications are up 17% since last October although the surge doesn’t include much change in high propensity applications (ones that expect to hire). That actually isn’t surprising either since, at least theoretically, AI should allow a lot of one person businesses to be quite productive.
The employment report last week was also fairly positive, with the economy adding 172k jobs. That makes 4 of the last 5 months positive and the 2026 monthly average 113.8K versus the lousy 2025 average of just 10k/month. There were, as usual, some parts of the report that were odd, with a 55k gain in local government jobs right at the top of the list. I have no idea what that is about or if it is real. There was also a surge in leisure and hospitality jobs (70k) which may have something to do with the World Cup. But every report has these anomalies and all this will get revised anyway. Check back in 6 months to see how things really were. The rise in job openings is welcome but with the labor force participation rate at 61.8% and falling, I do wonder who might fill those jobs. Too bad immigration is at a standstill.
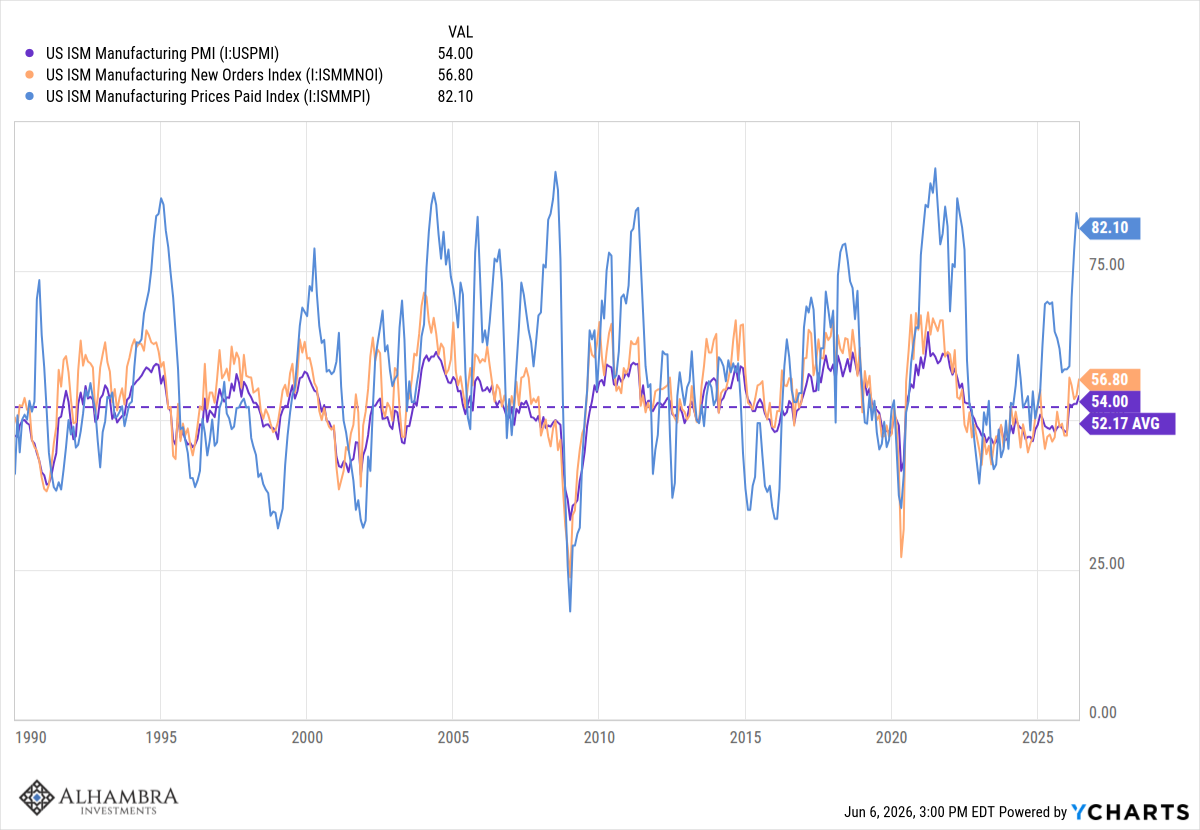
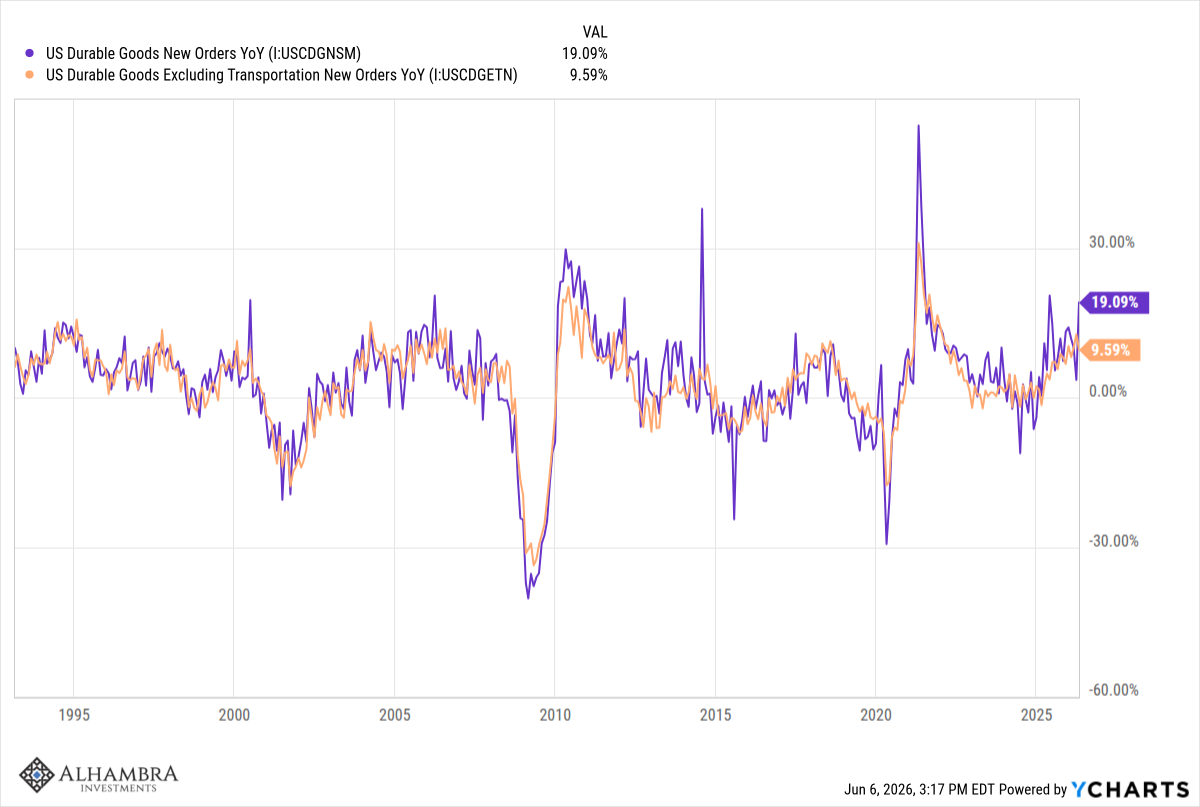
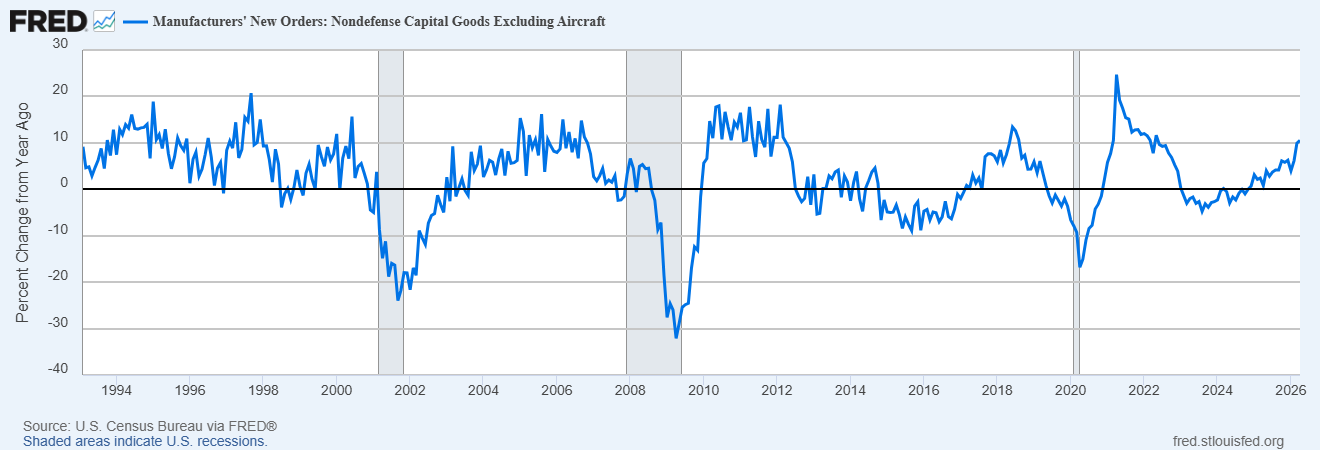
The goods economy seems to be perking up. The ISM manufacturing index is at 54 with the new orders index over 56 but the prices paid index is 82 which confirms the recent spike in the PPI. Durable goods orders are rising nicely, up 19% year-over-year and nearly 10% for ex-transportation. Core capital goods orders are up 10.5% year-over-year. A lot of that is AI related but not all. Primary metals and industrial machinery are both up double digits. There is a bit of front loading though due to the OBBB treatment of depreciation and fear of more tariffs to come. Just last week, the administration announced tariffs on over 50 countries of at least 10% to start in July. And some of this is restocking as inventories/sales ratios had fallen to levels where that should be expected (I wrote about that in last month’s economic update).
There’s a lot of hype, hope, and fear around how AI will affect the economy but as of now, the impact is pretty muted except in the area of investment. The need for capital to build out the AI infrastructure is immense and, if it continues at this pace, it seems likely to pull interest rates higher, especially real rates. As I said, interest rates have been trading in a range for the last three years but all maturities are near the top of that range and threatening to break out. You can see this in the year-over-year change in NGDP too which has turned higher and now sits at nearly 6%. The year-over-year change in NGDP has, over the long term, tracked the 10-year Treasury rate so either rates will continue to rise or NGDP growth will stall.
Peter Lynch, the great Fidelity fund manager, once said that “if you spend 14 minutes a year on economics, you’ve wasted 12 minutes”. I know that the great investor past time is to try and predict the next recession, the next crisis, but I’ve been doing this investing thing for 42 years now and I’ve yet to find anyone who can do it with any consistency. Every recession offers up another genius who predicted the downturn but repeat winners are exceedingly rare. The best we can do is get an outline of how things stand today and watch markets for clues about the future. And remember that even markets get it wrong sometimes; the crowd isn’t always wise.
I don’t know where the economy is going. I only know where it is right now which is right where it’s been for years. If that changes I’ll let you know.
Below are lots of charts about the economy and some brief commentary on each.
The Big Picture
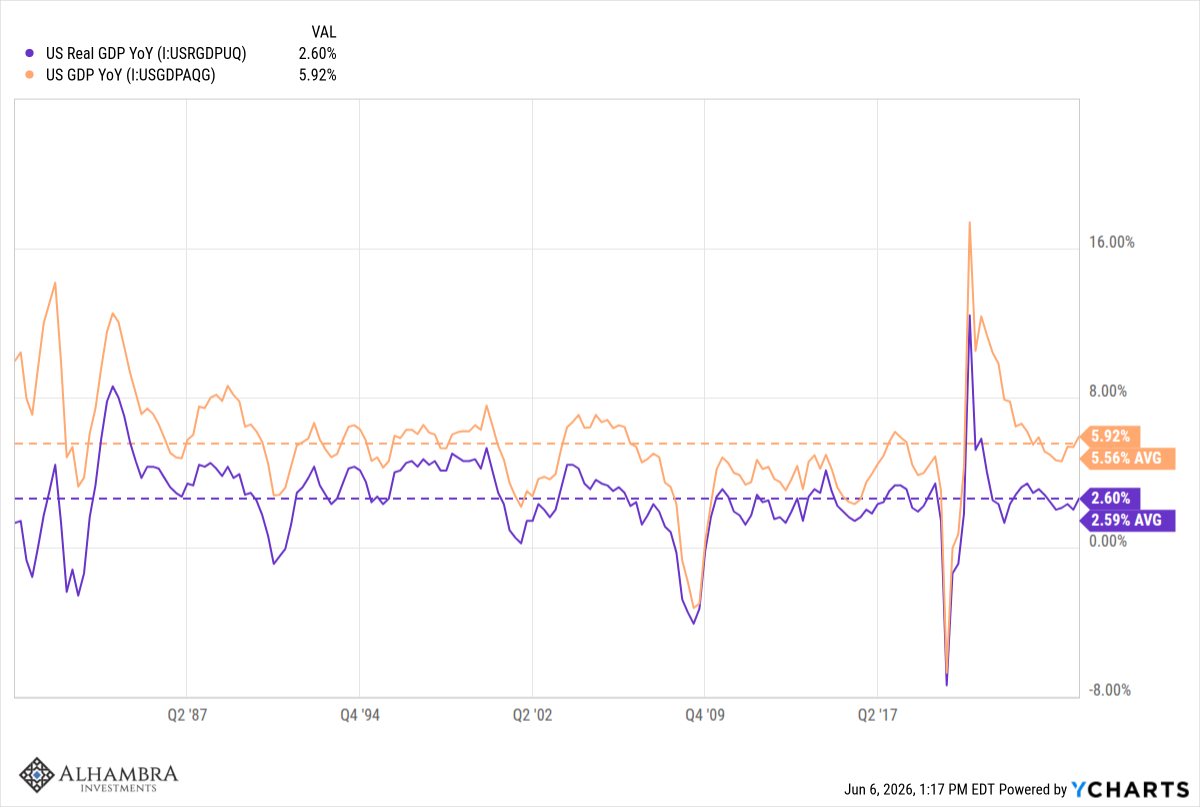
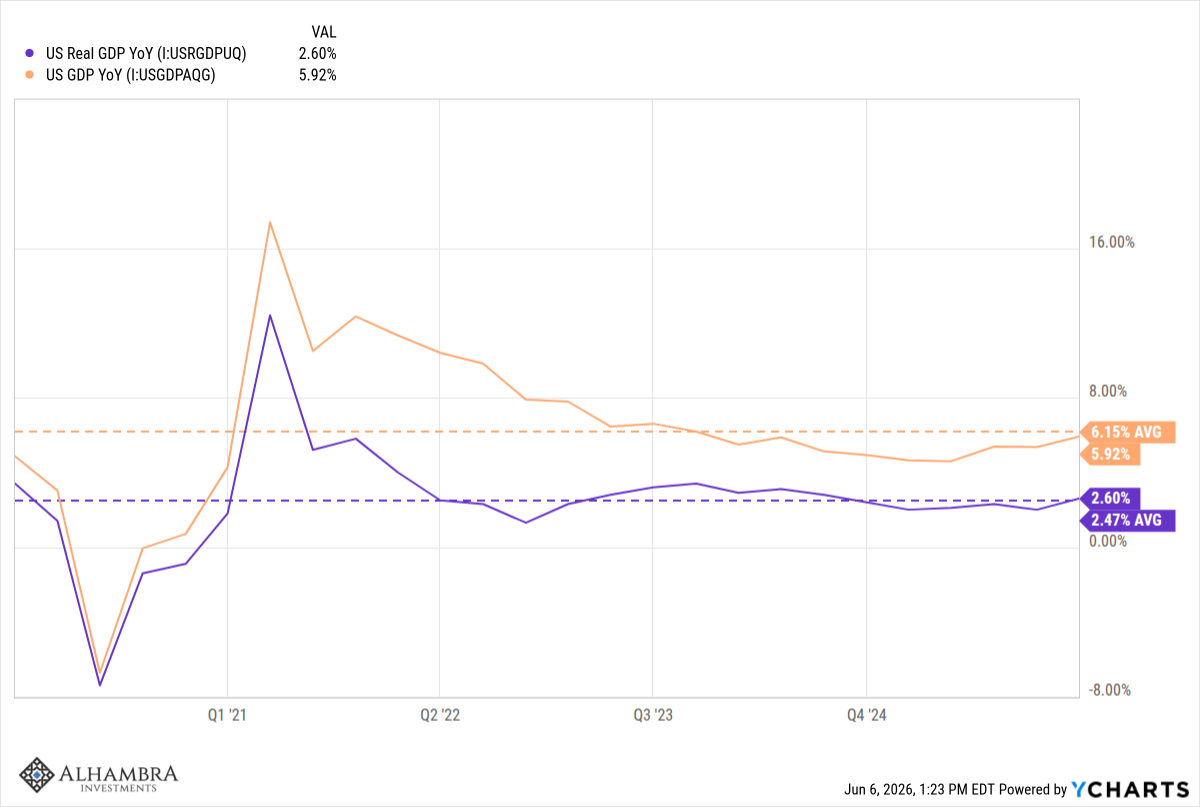
The year-over-year change in Nominal GDP (NGDP) is 5.92% while the change in Real GDP (RGDP; adjusted for inflation) is 2.60%. The difference between those two figures is the change in prices over the last year, 3.32%. The averages since 1980 are 5.56%, 2.59% and 2.97%. Like I said, about as average as one can get.
1980-Today
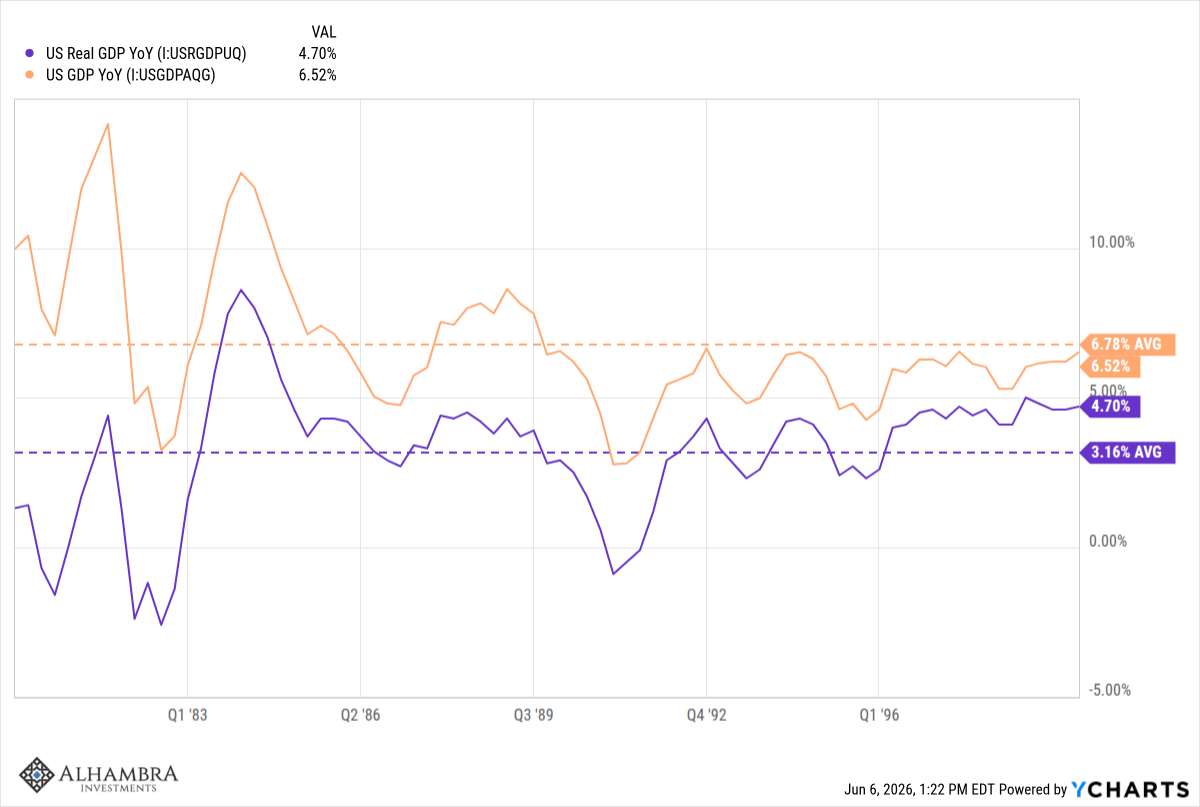
There have been differences between the decades though. From 1980-1999, nominal growth, real growth and inflation were all higher, mostly due to the high inflation of the early 80s.
1980-1999
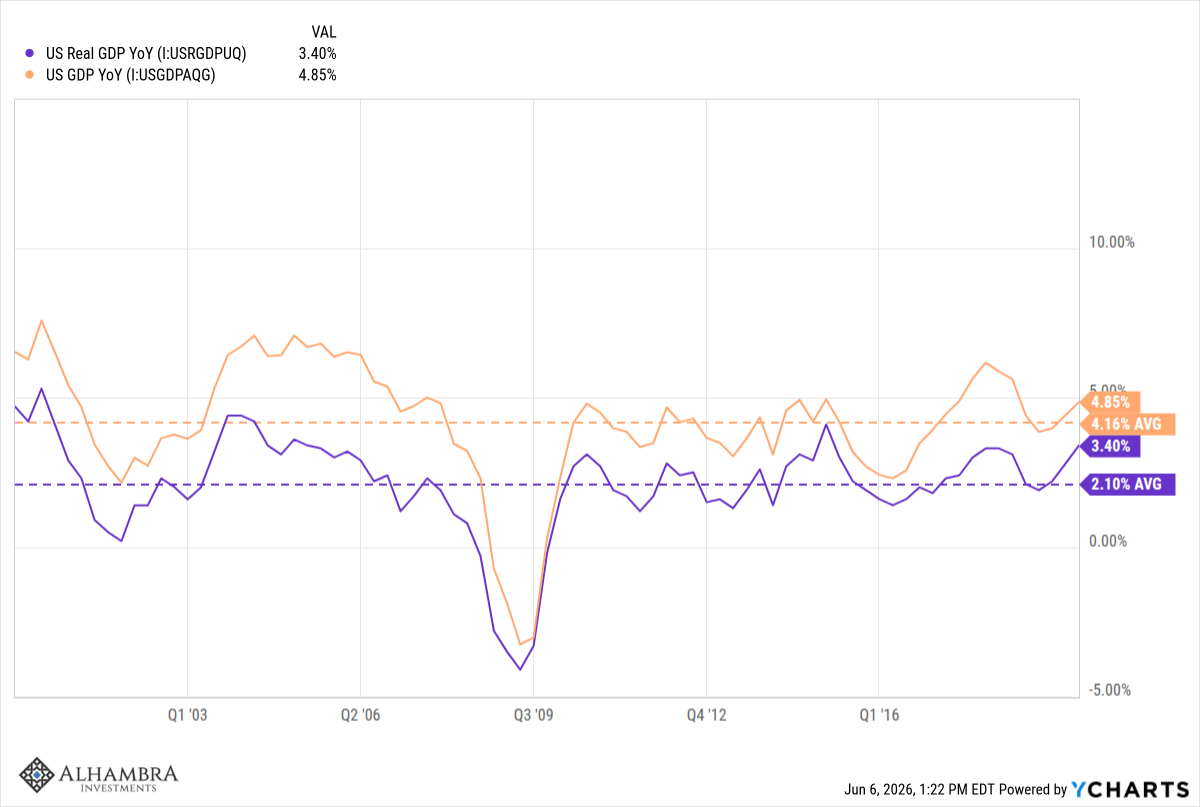
From 2000-2019, nominal growth, real growth and inflation were all lower than the long-term averages.
2000-2019
And so far in the 2020s, we seem to be moving back to that earlier period of higher NGDP growth and higher inflation. Real growth has, so far, been right at the long-term average of 2.6%.
2020-Today
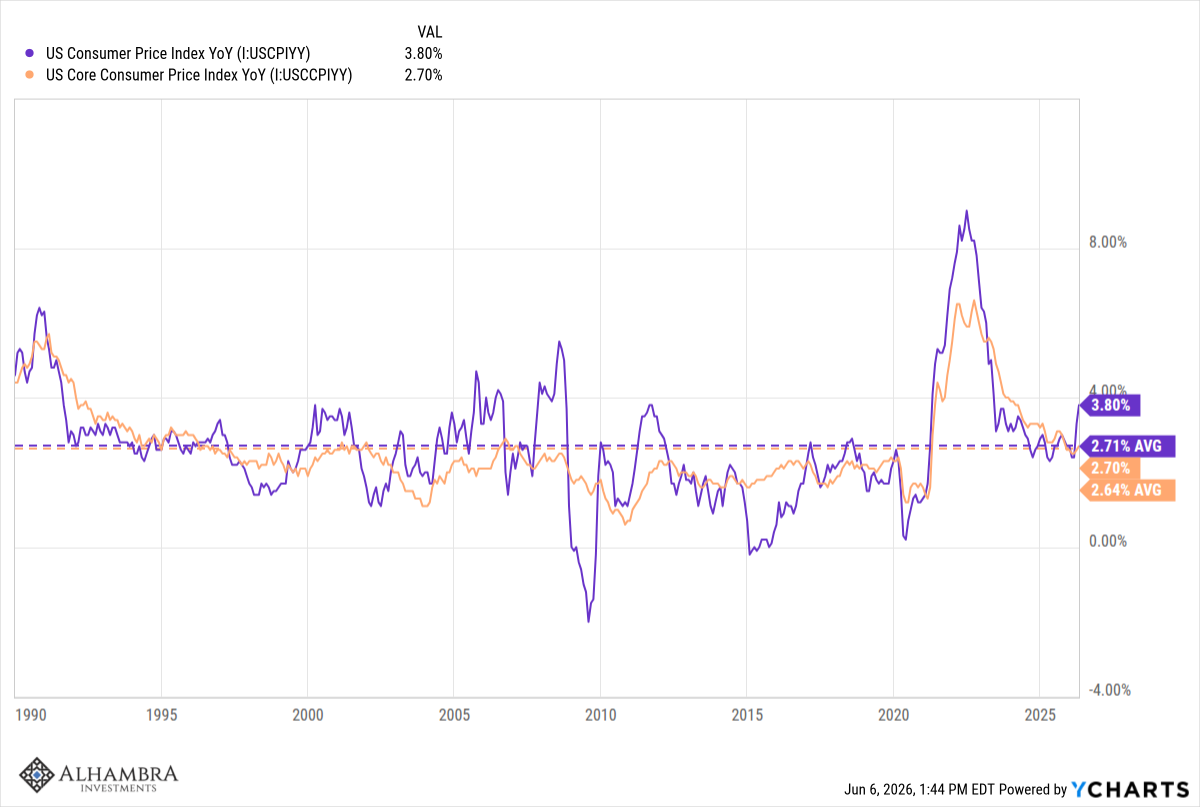
Headline consumer inflation is quite a bit above the average since 1990 (3.8% vs 2.71%) but core is right around average. One word of caution though is that the headline tends to lead the core as energy prices eventually bleed over into other products.
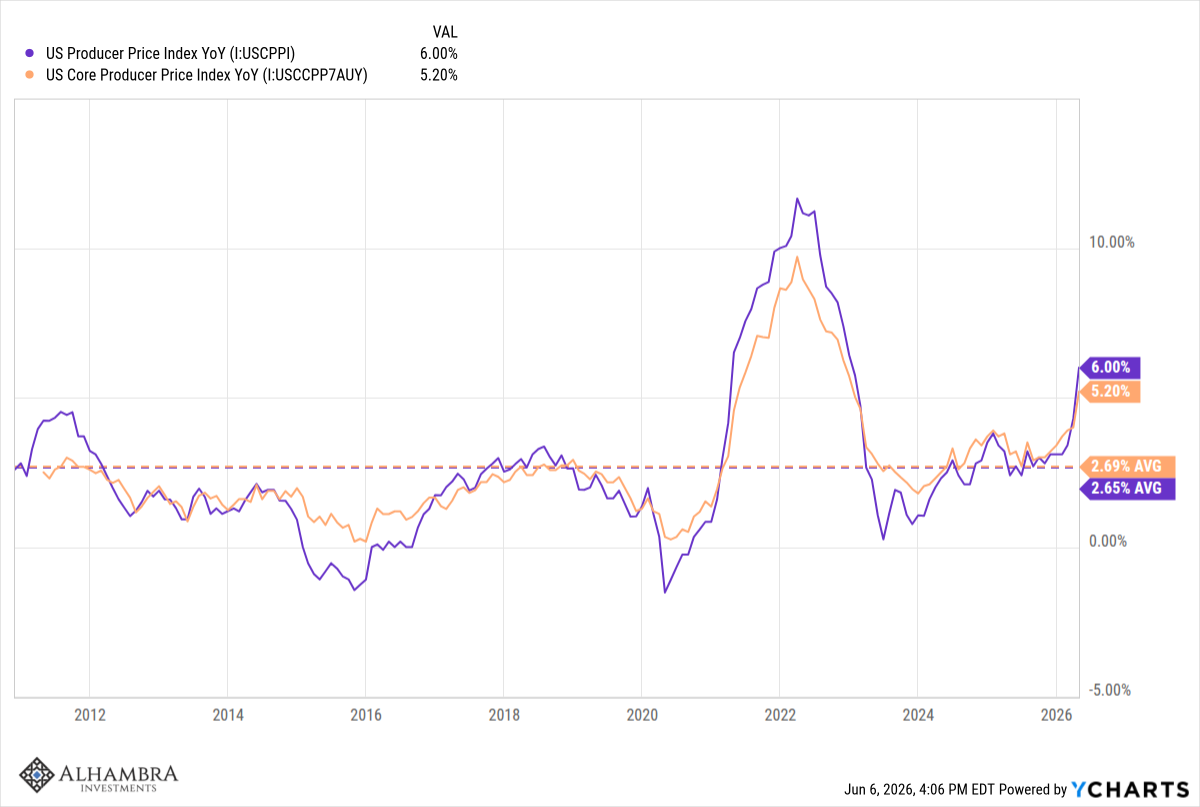
Producer prices are much more concerning, with the headline and core both running well above the average since 2010 (sorry that’s as far back as the data goes on FRED) and accelerating.
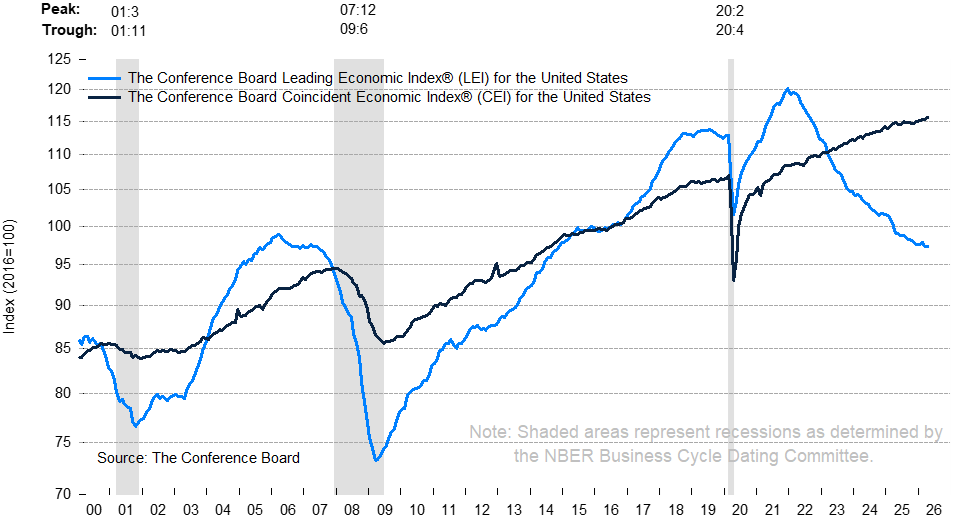
The Conference Board’s Leading Economic Index rose last in April, the second positive reading in the last three. The rate of change over the last six months fell 0.7 a slight improvement from -1 over the previous six months. The trend is obviously still down but maybe it is starting to moderate. In any case, the LEI hasn’t been accurate in this whole post-COVID period so I’m not sure how much weight to put on it.
Another broad based indicator is the Chicago Fed National Activity Index, a weighted average of 85 individual indicators. An index reading of zero means the economy is growing at trend (2-2.5%). The index is currently just slightly over 0 at 0.14 while the 3-month moving average, at 0.03, is right on trend.
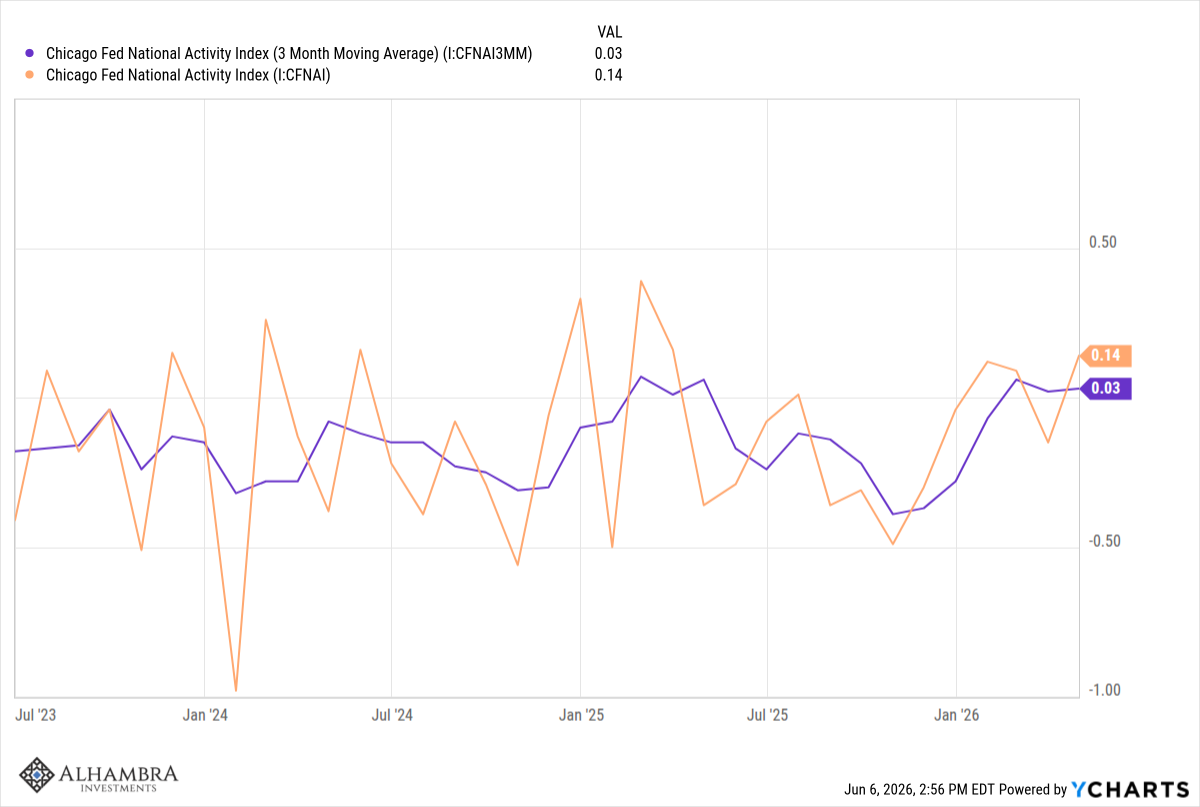
The big picture indicators show an economy growing at trend with slightly elevated inflation.
Markets
Markets are taking notice of the rising NGDP trend. Interest rates are rising and while some of that is about inflation, some of it is about growth too. Real interest rates are up this year, albeit quite modestly; about 20 basis points for the 10-year TIPS vs about 40 basis points for the nominal 10-year Treasury. Over the last year though, the nominal yield is up just 2 basis points while the TIPS yield is unchanged.
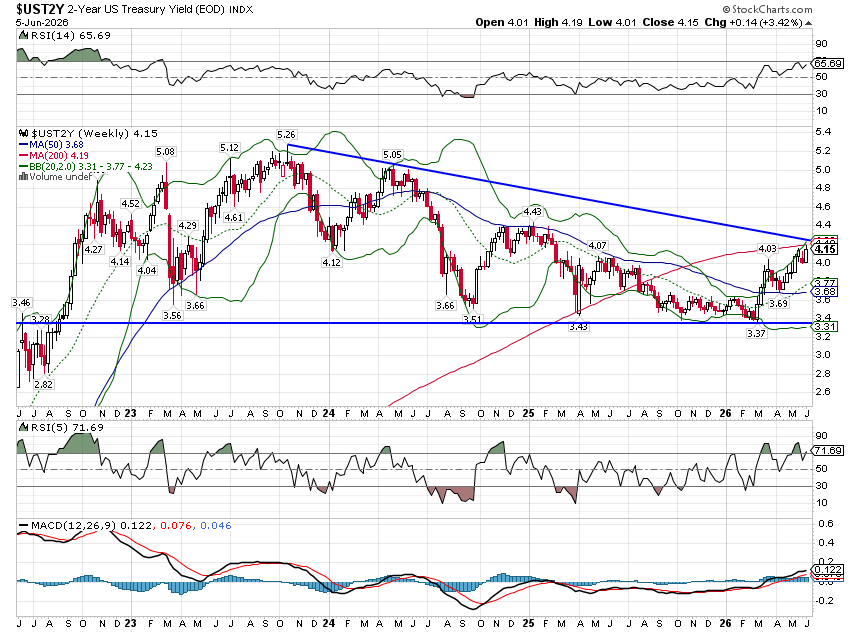
The short end of the curve has risen more than the long end, the 2-year Note yield up 67 basis points on the year. The rate over the last year though is only up about 15 basis points so not much change.
2-Year Treasury Note Yield
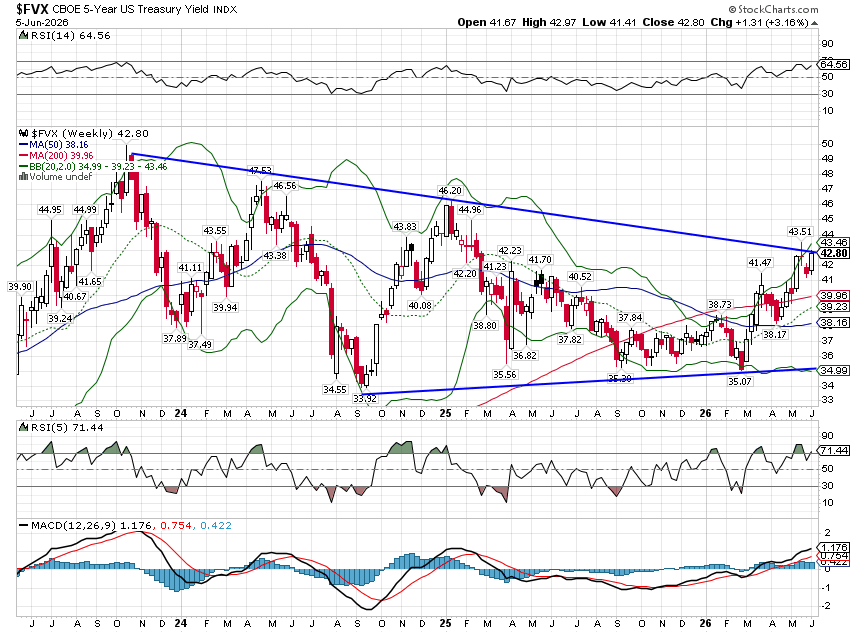
We see similar movement in the 5-year note yield, up 56 basis points this year and about 16 basis points over the last year.
5-Year Treasury Note Yield
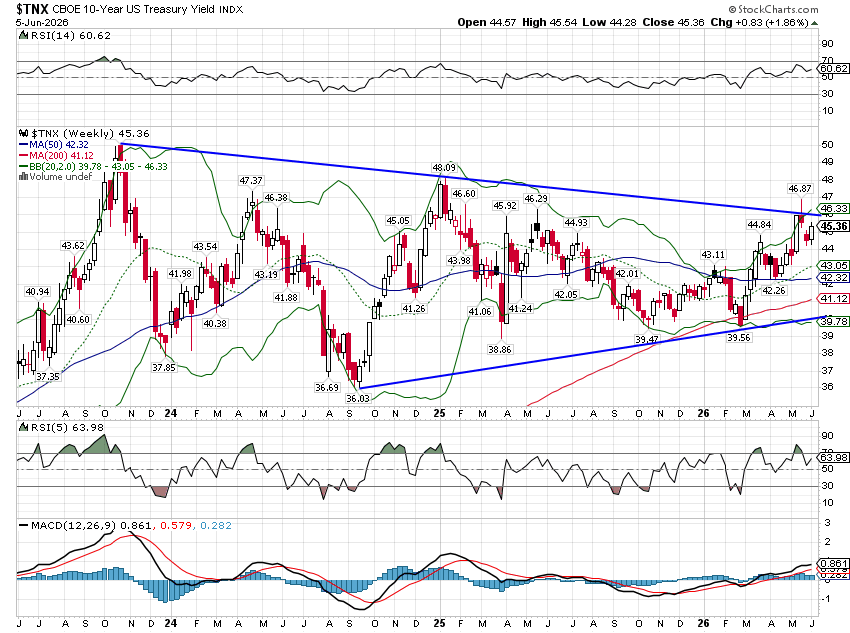
The 10-year is our north star for long-term nominal growth expectations and like NGDP it is rising. The rate has been trading in this cone for 3 years; it will be interesting to see if it breaks out higher. Stocks will probably not look kindly on such a development.
10-Year Treasury Note Yield
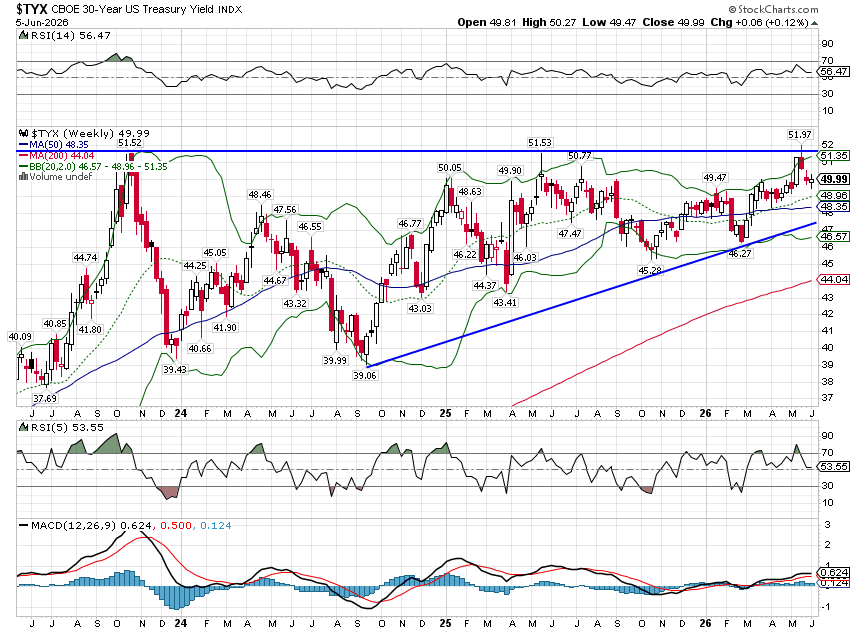
The long end of the curve is also trading sideways for three years and is closer to breaking to new highs than the 10-year. The 30-year bond yield is up 16 basis points this year but is essentially unchanged from a year ago.
30-Year Treasury Bond Yield
The interest rate complex tells us that while growth expectations – nominal and real – have risen some this year, they are mostly unchanged from a year ago. With the 10-year inflation breakeven up just 7 basis points (2.36%) over the last year, long-term inflation expectations haven’t changed much either, despite the recent rise in inflation.
The dollar index, at 100.07 is just a tad above the average since it started to float in the early 70s. It is down since peaking early last year but it has been pretty stable over the last 5 and 10 years.
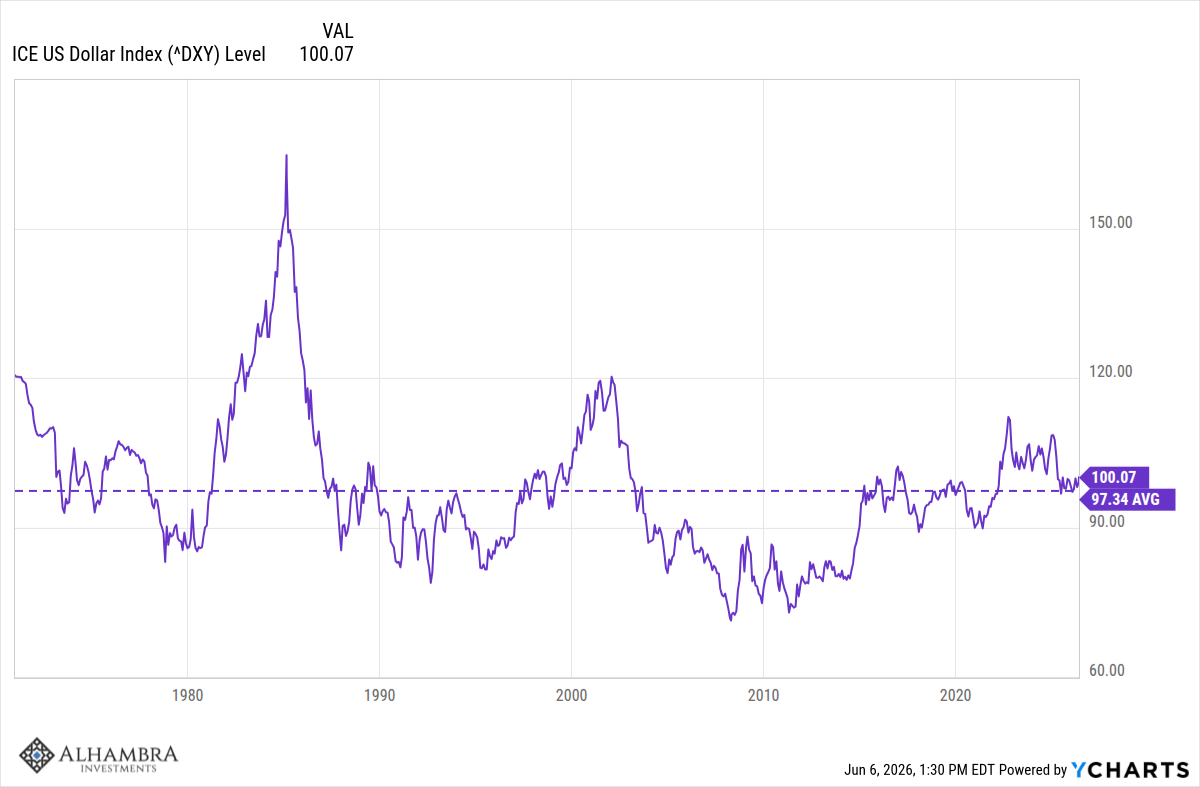
The dollar gives us an indication of expected relative growth between the US and the rest of the world. There has been little change in recent years.
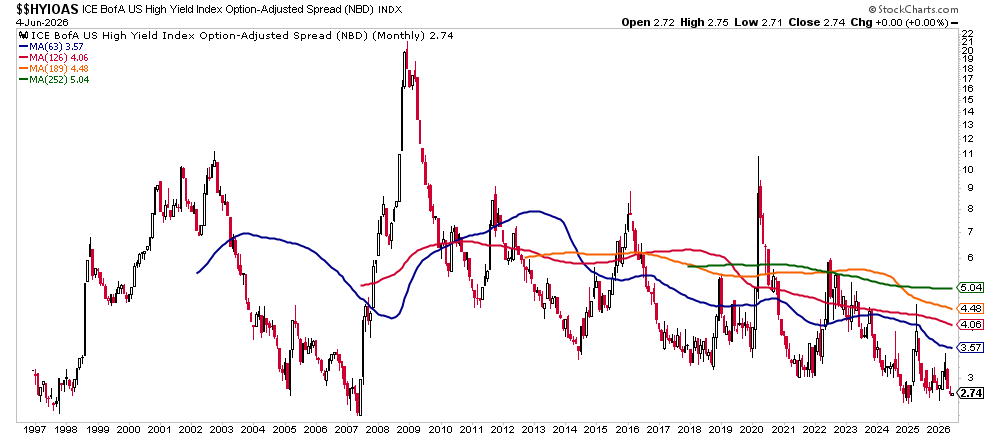
Credit spreads are near their cycle lows. The good news is that spreads are low so credit is cheap for borrowers. The bad news is it doesn’t get much better than this.
HY Credit Spreads
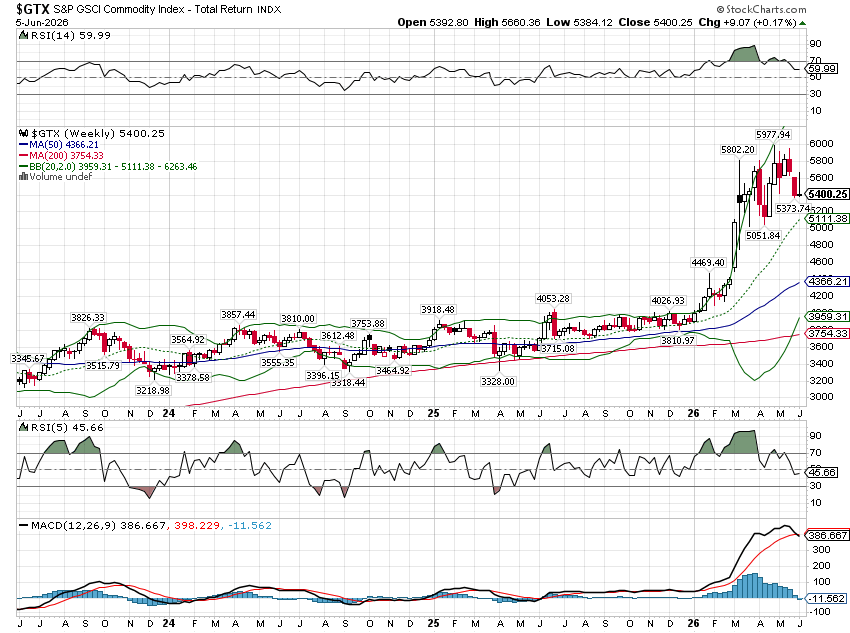
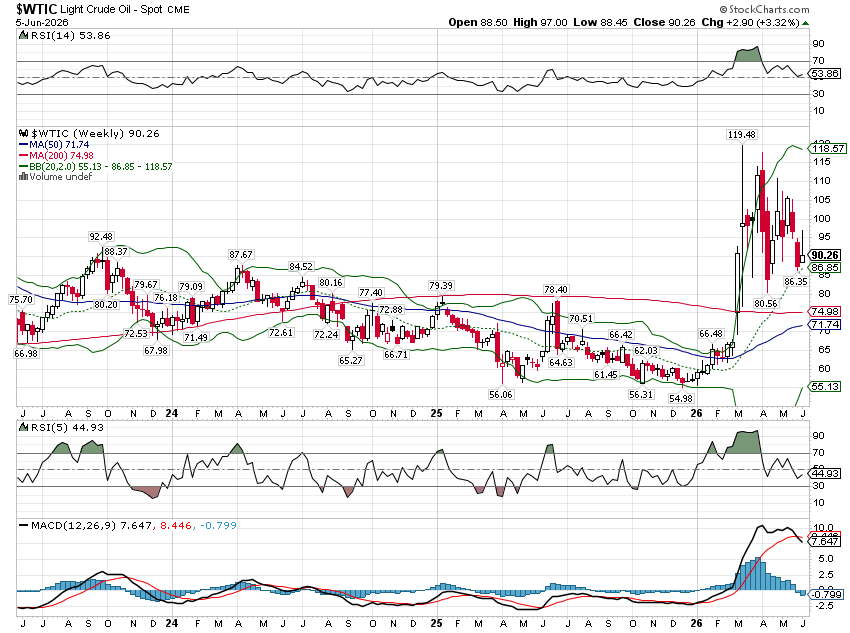
Commodities have spiked with oil prices from the Iran War and are past their recent peak. Whether this is just a rest before another leg higher I can’t say but commodities have performed well over the last 5 years, averaging a 16% annual return. On the other hand those gains were concentrated around two events – the Russian invasion of Ukraine and the current Iran War. General commodity market trends are mostly just reflections of the dollar trend and since there has been no dollar trend there has been no commodity trend. I think that is likely to change in coming years but it hasn’t yet.
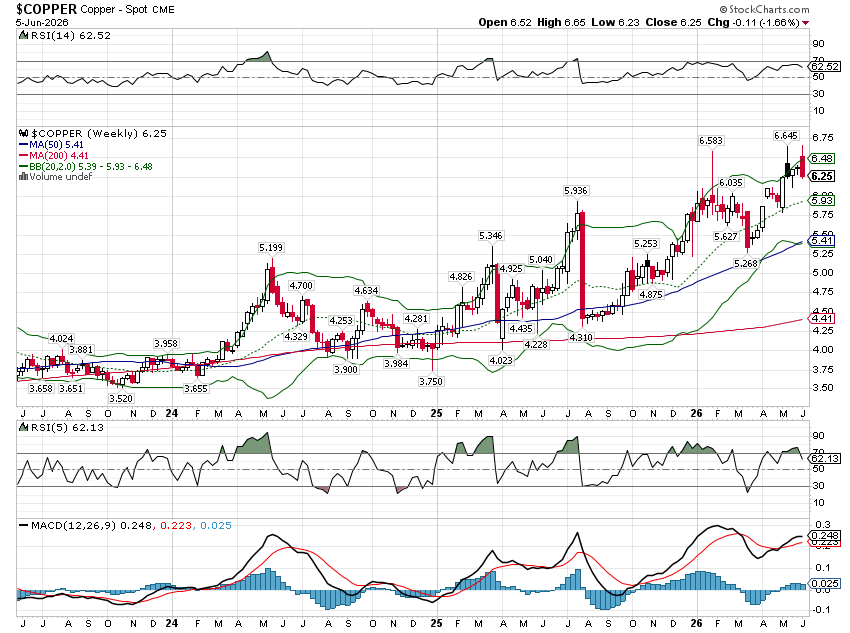
Copper is trending higher which is usually a decent indicator of growth. In this case I think it is mostly an indicator that AI takes lots of electricity.
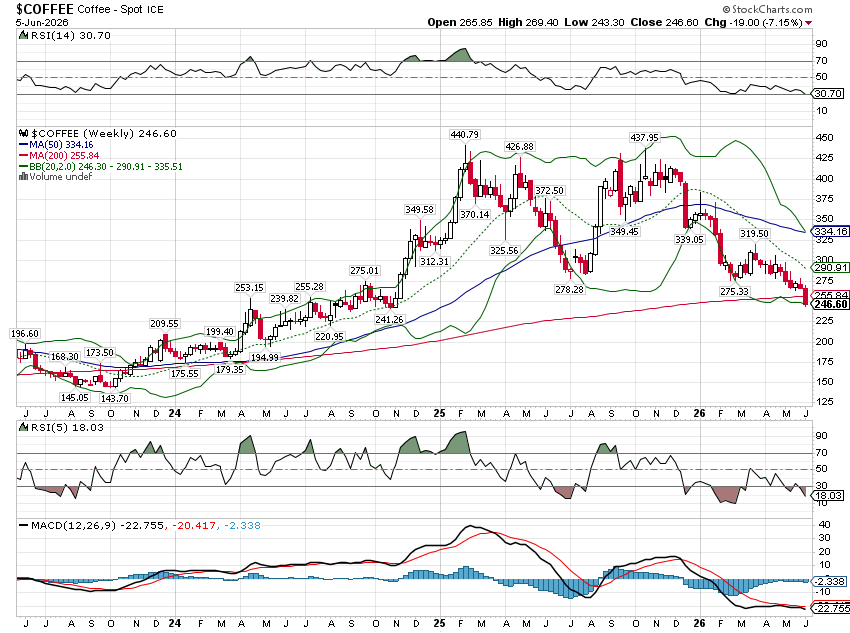
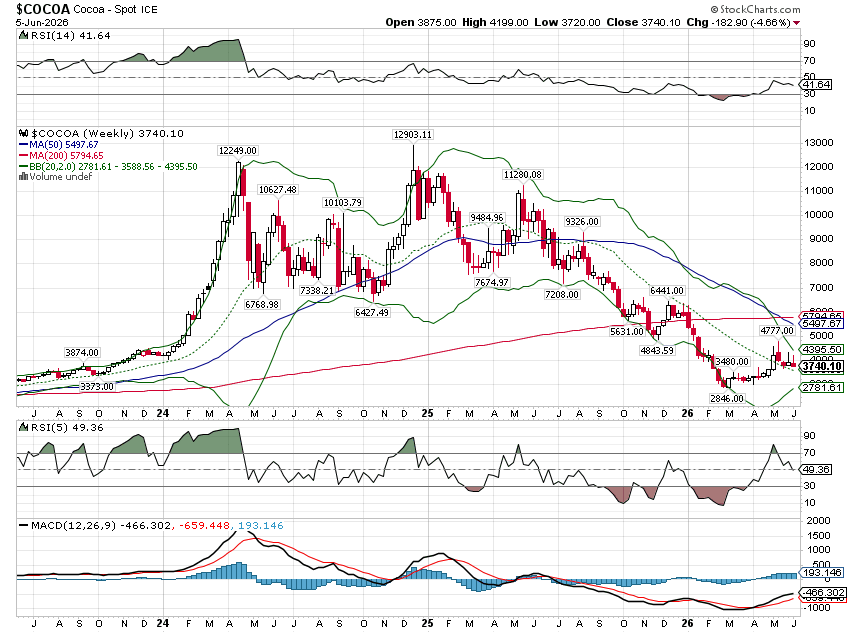
Some of soft commodities have come back down from peaks set at around the beginning of 2025. Coffee and cocoa are down significantly from their peaks, 44% and 71% respectively. That doesn’t mean we’ll get relief at the grocery store; it may just help Hershey, Nestle, and Starbucks’ margins.
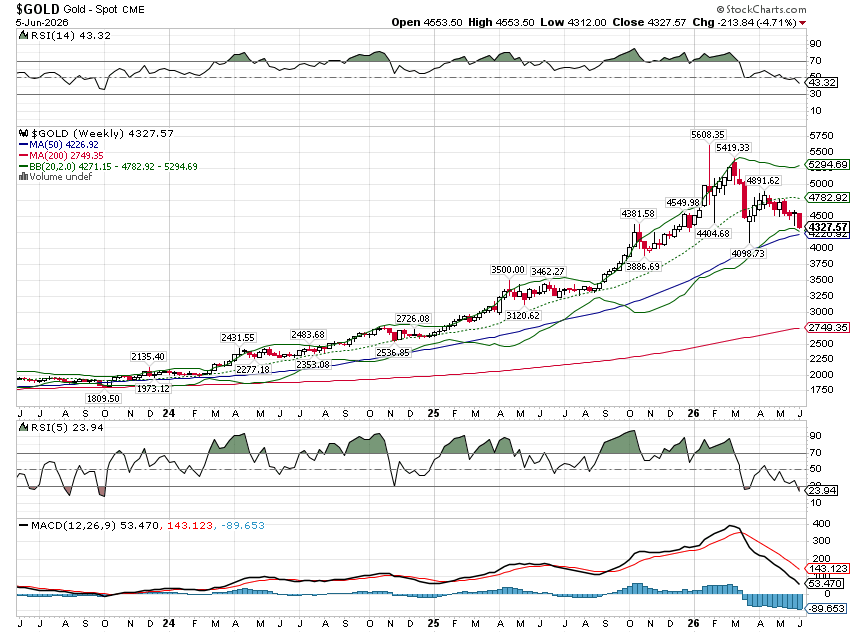
Gold has also come down off its highs, flat for the year now. It is still up 28% from a year ago and 125% over the last 5 years though. Central bank holdings of gold recently surpassed holdings of Treasuries although a lot of that was just from the price rise. I have always thought of gold as the best indicator of the value of the dollar over the long term but in the short term it is very volatile. The rise in gold over the last 10 years does not speak well of the US economy or the US dollar. We are watching this closely to see if it breaks the uptrend. To the extent gold falls, I’d see that as a positive statement about the US economy.
Oil prices have come down from their highs.
Economic Data
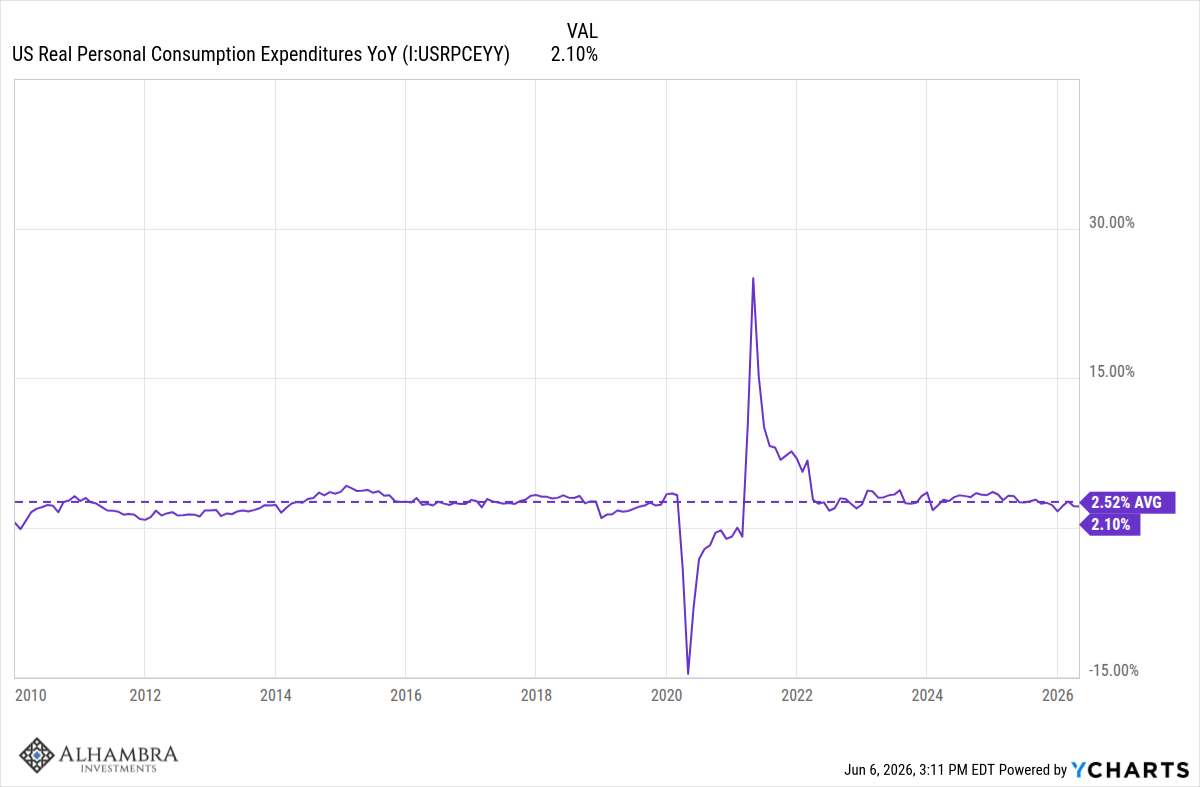
Personal consumption growth is a little below average.
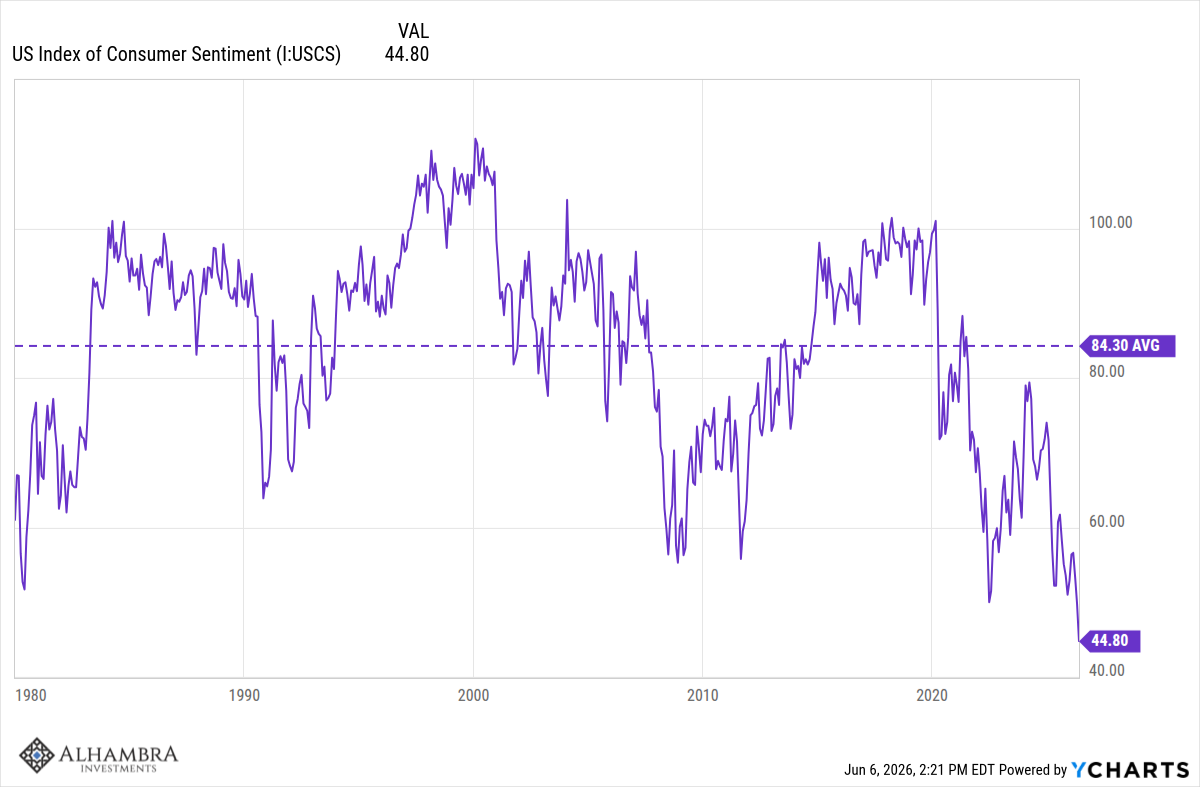
Which is surprising for its strength given consumer sentiment at all-time lows.
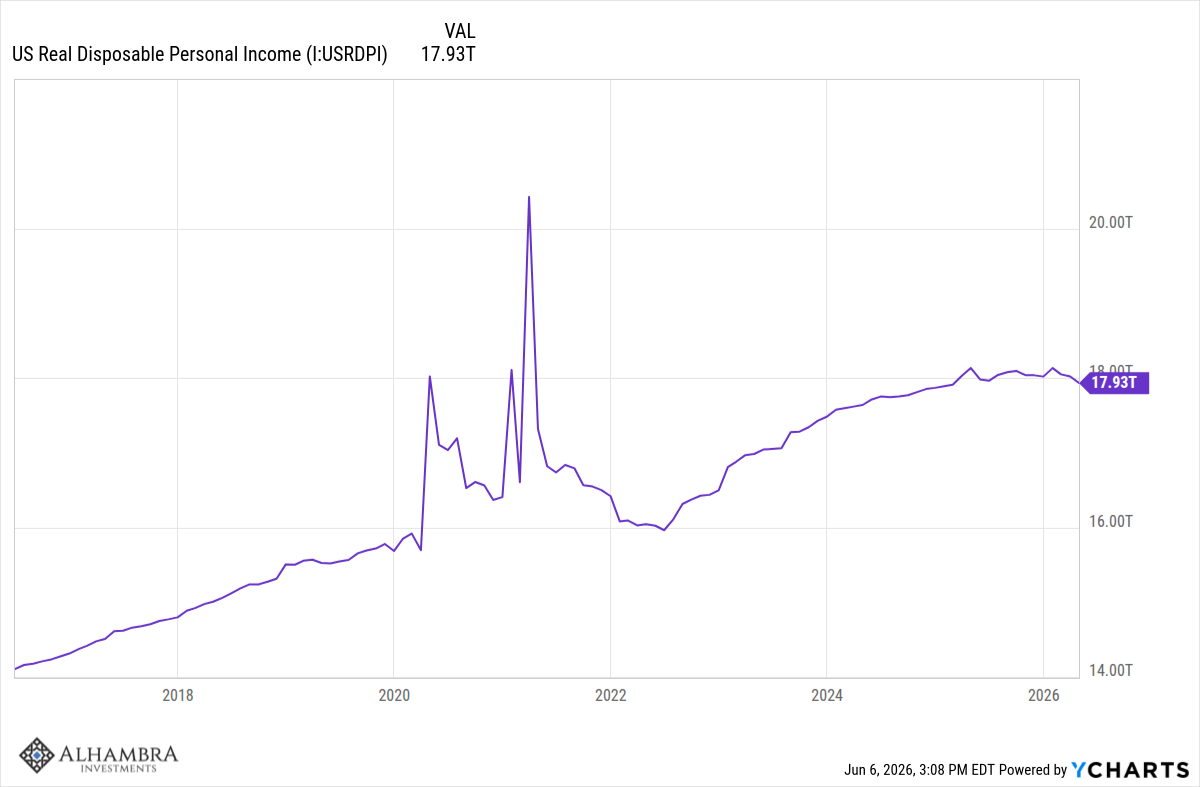
Real disposable personal income (after tax, adjusted for inflation) peaked in April of 2025 and is down 1.1% just since January of this year. This is not a good trend and along with inflation, explains the lousy consumer sentiment.
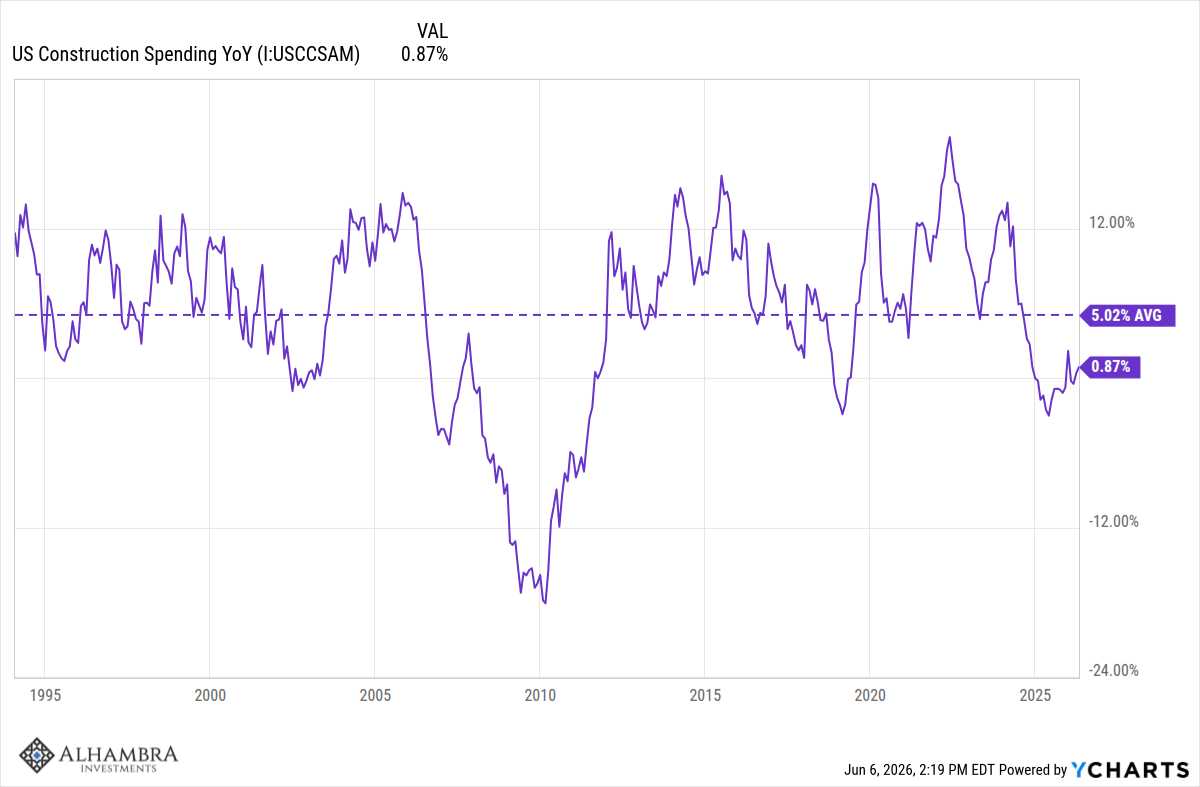
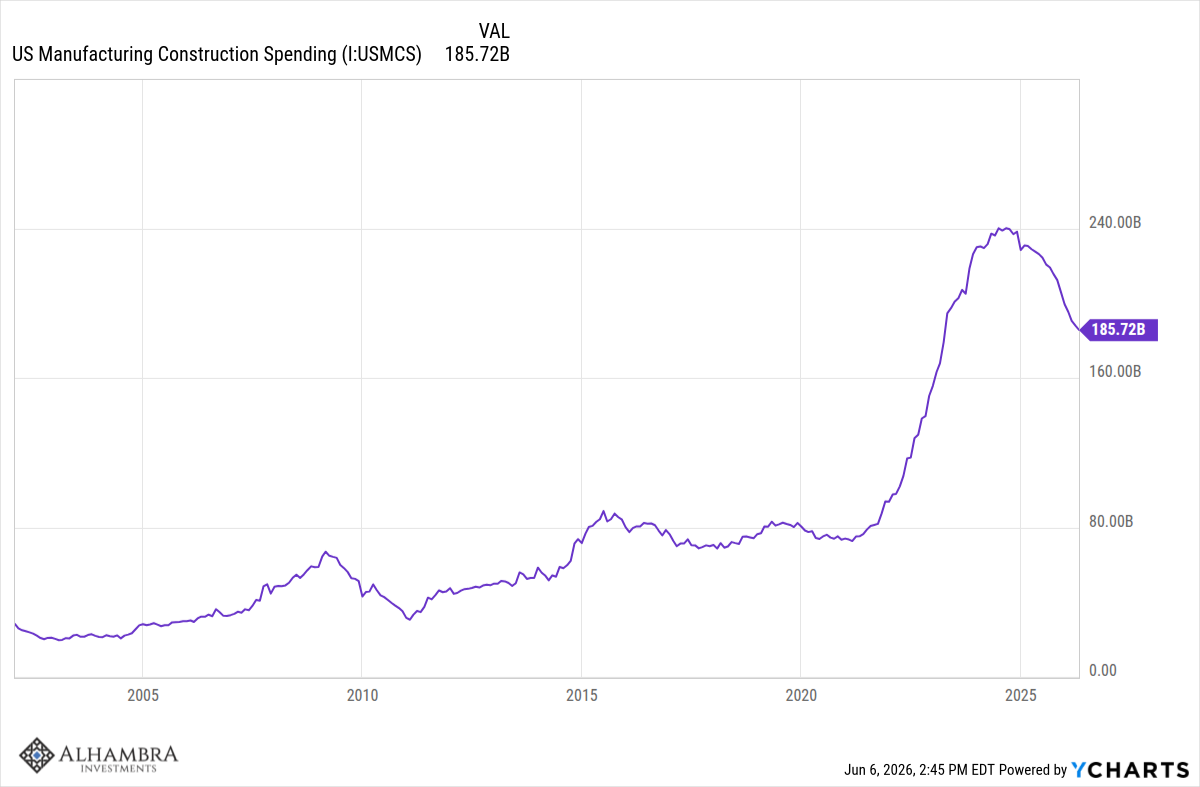
Construction spending is down year-over-year and well below the long-term average gain of 5%. But it isn’t what you think….
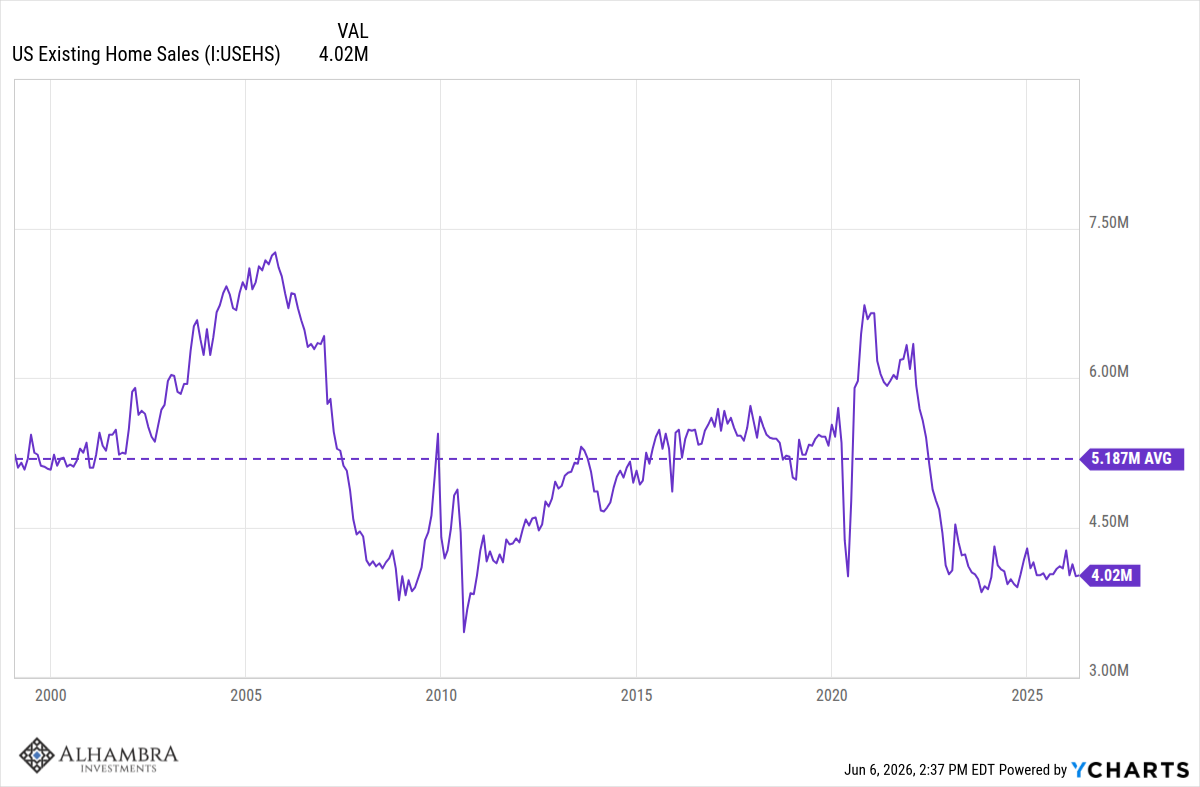
Existing home sales are still well below average…
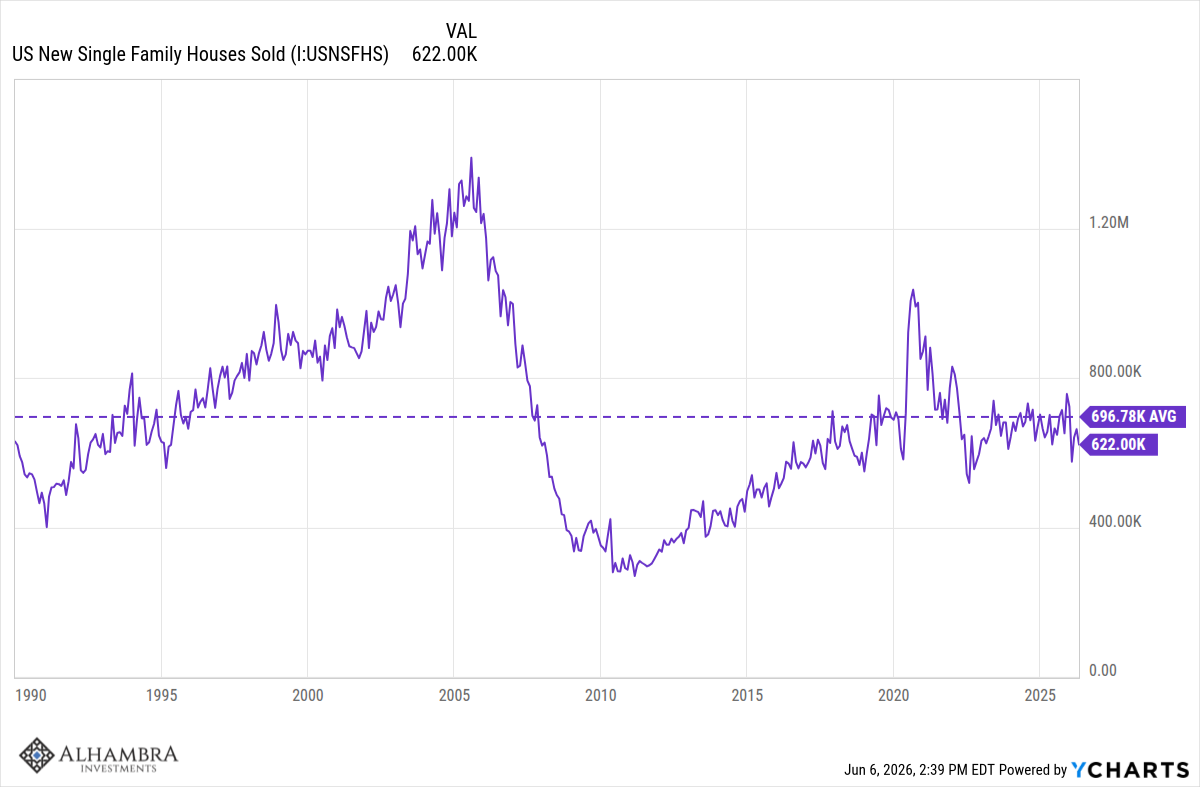
But new home sales are about average.
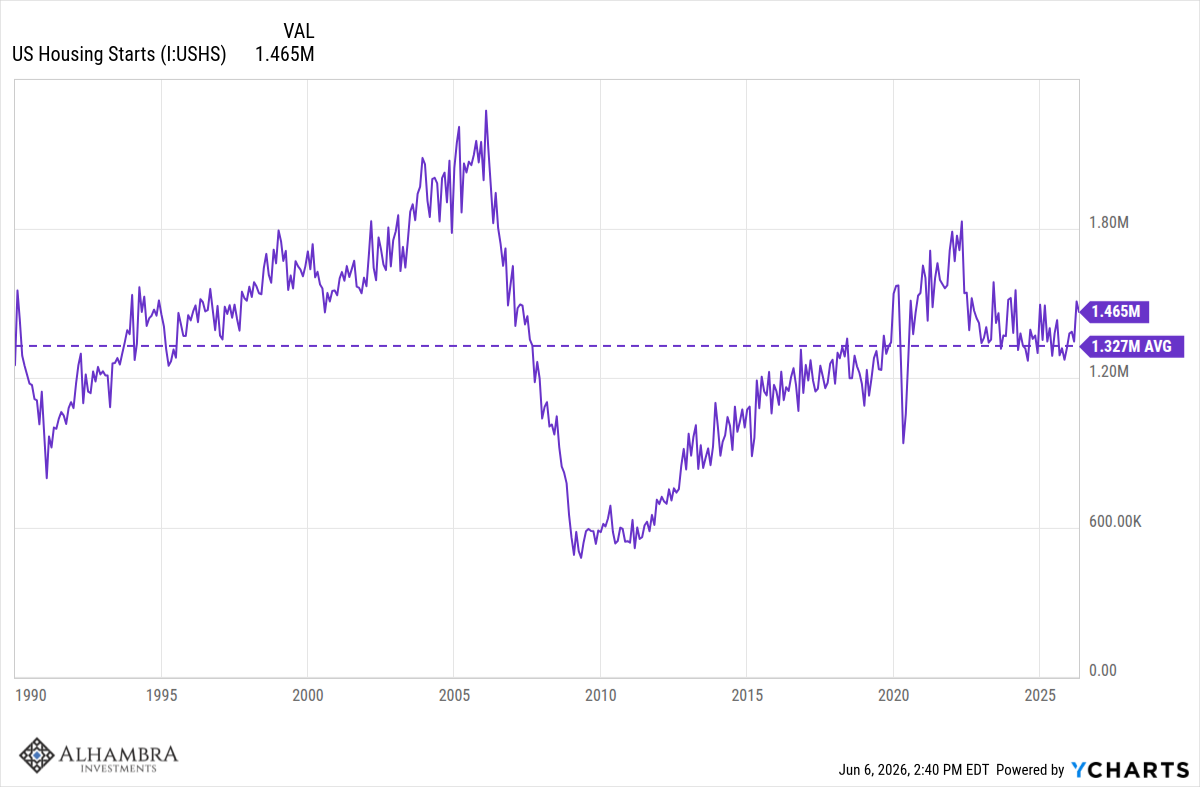
As are housing starts.
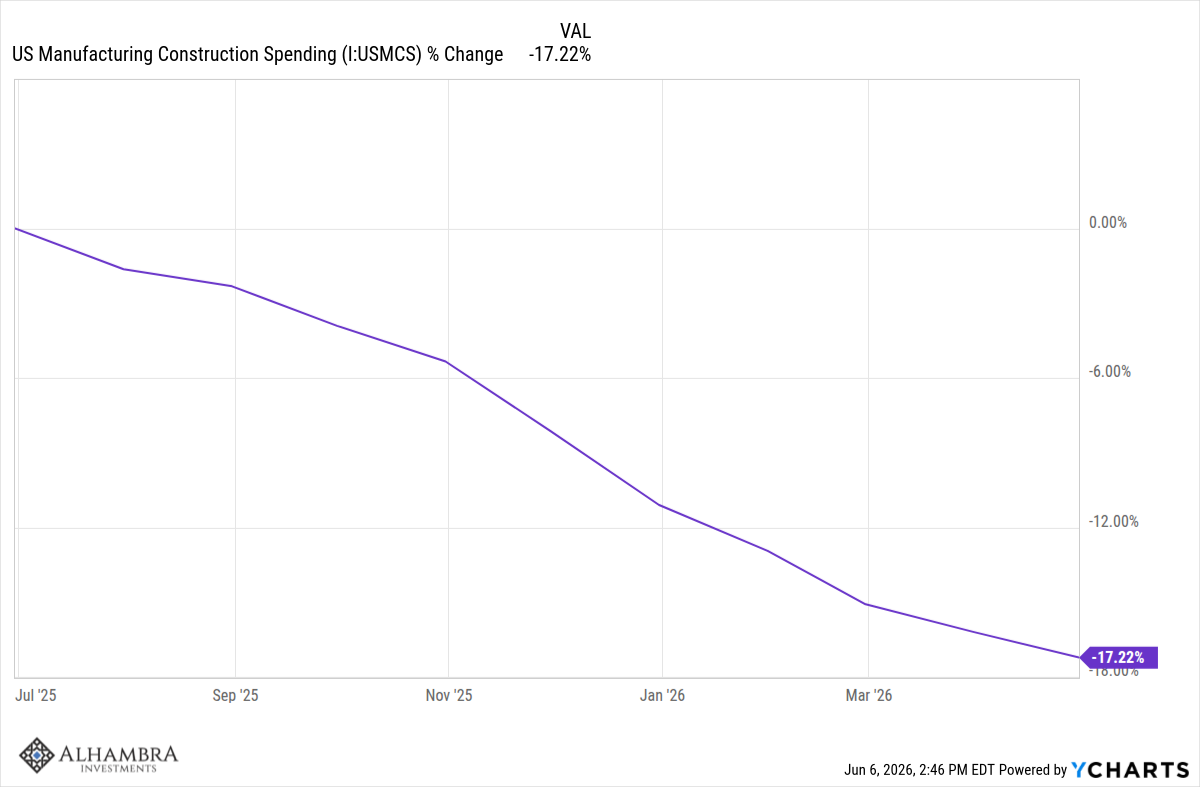
What’s down is manufacturing construction. I think this is nothing more than the hangover from the Biden administration’s various programs to encourage this kind of building.
This is partially restocking but that doesn’t mean it isn’t real. It is and inventories are low enough that it may go on for a while.
Durable goods orders are surging for a variety of reasons from restocking due to low inventories to fear of new supply chain disruptions to the AI buildout to a surge in aircraft orders (backlog release).
Core capital goods orders are also surging from AI but also from building out those factories that got constructed during the Biden administration.
Joe Calhoun
Stay In Touch